Thinking out loud
Where we share the insights, questions, and observations that shape our approach.
A path to a successful AI adoption
Artificial Intelligence seems to be a quite overused term in recent years, yet it is hard to argue that it is definitely the greatest technological promise of current times. Every industry strongly believes that AI will empower them to introduce innovations and improvements to drive their businesses, increase sales, and reduce costs.
But even though AI is no longer a new thing, companies struggle with adopting and implementing AI-driven applications and systems . That applies not only to large scale implementations (which are still very rare) but often to the very first projects and initiatives within an organization. In this article, we will shed some light on how to successfully adopt AI and benefit from it.
AI adoption - how to start?
How to start then? The answer might sound trivial, but it goes like this: start small and grow incrementally. Just like any other innovation, AI cannot be rolled out throughout the organization at once and then harvested across various business units and departments. The very first step is to start with a pilot AI adoption project in one area, prove its value and then incrementally scale up AI applications to other areas of the organization.
But how to pick the right starting point? A good AI pilot project candidate should have certain characteristics:
- It should create value in one of 3 ways:
- By reducing costs
- By increasing revenue
- By enabling new business opportunities
- It should give a quick win (6-12 months)
- It should be meaningful enough to convince others to follow
- It should be specific to your industry and core business
At Grape Up, we help our customers choose the initial AI project candidate by following a proven process. The process consists of several steps and eventually leads to implementing a single pilot AI project in production.
Step 1: Ideation
We start with identifying possible areas in the organization that might be enhanced with AI, e.g., parts of processes to improve, problems to solve, or tasks to automate. This part of the process is the most essential as it becomes the baseline for all subsequent phases. Therefore it is crucial to execute it together with the customer but also ensure the customer understands what AI can do for their organization. To enable that, we explain the AI landscape, including basic technology, data, and what AI can and cannot do. We also show exemplary AI applications to a customer-specific industry or similar industries.
Having that as a baseline, we move on to the more interactive part of that phase. Together with customer executives and business leaders, we identify major business value drivers as well as current pain points & bottlenecks through collaborative discussion and brainstorming. We try to answer questions such as:
- What in current processes impedes your business development?
- What tasks in current processes are repeatable, manual, and time-consuming?
- What are your pain points, bottlenecks, and inefficiencies in your current processes?
This step results in a list of several (usually 5 to 10) ideas ready for further investigation on where to potentially start applying AI in the organization.
Step 2: Business value evaluation
The next step aims at detailing the previously selected ideas. Again, together with the customer, we define detailed business cases describing how problems identified in step 1 could be solved and how these solutions can create business value.
Every idea is broken down into a more detailed description using the Opportunity Canvas approach - a simple model that helps define the idea better and consider its business value. Using filled canvas as the baseline, we analyze each concept and evaluate against the business impact it might deliver, focusing on business benefits and user value but also expected effort and cost.
Eventually, we choose 4-8 ideas with the highest impact and the lowest effort and describe detailed use cases (from business and high-level functional perspective).
Step 3: Technical evaluation
In this phase, we evaluate the technical feasibility of previously identified business cases – in particular, whether AI can address the problem, what data is needed, whether the data is available, what is the expected cost and timeframe, etc.
This step usually requires technical research to identify AI tools, methods, and algorithms that could best address the given computational problem, data analysis – to verify what data is needed vs. what data is available and often small-scale experiments to better validate the feasibility of concepts.
We finalize this phase with a list of 1-3 PoC candidates that are technically feasible to implement but more importantly – are verified to have a business impact and to create business value.
Step 4: Proof of Concept
Implementation of the PoC project is the goal of this phase and involves data preparation (to create data sets whose relationship to the model targets is understood), modeling (to design, train, and evaluate machine learning models), and eventual deployment of the PoC model that best addresses the defined problem.
It results in a working PoC that creates business value and is the foundation for the production-ready implementation.

How to move AI adoption forward?
Once the customer is satisfied with PoC results, they want to productionize the solution to fully benefit from the AI-driven tool. Moving pilots to production is also a crucial part of scaling up AI adoption. If the successful projects remain still just experiments and PoCs, then it is demanding for a company to move forward and apply AI to other processes within the organization .
To summarize the most important aspects of a successful AI adoption:
- Start small – do not try to roll out innovation globally at once.
- Begin with a pilot project – pick the meaningful starting point that provides business value but also is feasible.
- Set realistic expectations – do not perceive AI as the ultimate solution for all your problems.
- Focus on quick wins – choose a solution that can be built within 6-12 months to quickly see the results and benefits.
- Productionize – move out from the PoC phase to production to increase visibility and business impact.

Automotive Tech Week Megatrends: Key takeaways
For the last couple of months, the ones during which we have to cope with COVID-19, we could have heard people all over the world saying that virtual events are pointless, and it’s not the same as it used to be. Presentations are pre-recorded, and speakers are reading the text instead of presenting. If you ask the speaker a question, you may not get the answer because s/he is not there, and the audience is very limited.
Luckily, not all the events go like this. A perfect example of a great virtual event is Automotive Tech Week Megatrends that took place 2 weeks ago. Great speakers, insightful topics even for the most demanding automotive industry enthusiasts. A lot of attendees and most importantly - everything was happening live!
If you are a member of the automotive community, or at least you follow the industry trends, you have probably noticed how impactful changes have happened there during the last few years. From a very conservative industry, it turned into a forefront of digital disruption, adopting the newest technologies and trends faster than ever. How does it work? High-speed internet availability, LTE and 5G network coverage increased largely. Extreme miniaturization of fast, low-energy silicon chips made modern technologies like augmented reality or autonomous driving available for the users, but it also completely changed the way OEM’s build cars. We can also observe new channels of monetization in the industry.
Results are spectacular. Not so long ago, introducing a new model or solutions used to take a few years, now automotive enterprises work at a rapid pace having a new competition on the market like Tesla or Rimac. Subscription-based monetization models are here to stay, as well as huge infotainment screens and very sophisticated, intelligent driver assistants.
But technology is not the only aspect of the fast-changing world. The other, maybe even more important trend is the ecology in mobility, with the main focus on electric and hybrid drivetrains. Reducing the CO 2 footprint of the automotive industry by decreasing fossil fuel share in favor of electric or even fuel cell motors have become important and limited only by charging infrastructure and, still awaiting for game-changing invention, batteries capacity.
However, what are the next fundamental trends for the industry? Which of the trends, we can notice now, are here to stay and which are just fads? Speakers of Automotive Tech Week Megatrends tried to answer that specific question in the last week of January 2021.
Presentations covered a wide spectrum of topics: electric cars and charging infrastructures, urban mobility, and mobility as a service, user experience based vehicle and infotainment designs, V2X, and modern vehicle system infrastructure. Let’s quickly walk through the most interesting ones.
Evolving Mobility in an everchanging digital world
In the opening presentation, Stephen Zeh from Silvercar, Audi, explained the challenges of shared mobility, the evolution of their rental services and value of digital offerings, especially subscription-based. The shared mobility experiences dramatic growth caused by a shift in customer behavior and approach - owning a car is no longer a goal, but people still want to travel by car. Different means of travel require different vehicles - small cars for short trips, bigger for family tours, micromobility like electric bikes or scooters for urban travels or shared mobility like Uber replacing taxis.
The automotive industry had to quickly adapt to the pandemic situation, especially when, in April 2020, the ride-halting customer count plummeted as the fear of infection emerged in society and demand for contactless, safe car rental surged.
All of that caused major changes in Audi Dealerships offering, not just limited to vehicle sales anymore, but providing a much wider set of services for their clients.
How user experience drove design for the all-new F-150
The next day, Ehab Kaod, Chief Designer for F-150 at Ford, explained the challenges of designing a modern car by starting from user experience, affecting interior, exterior, and infotainment design and architecture.
Starting from on-site and remote customer research, finding the important features, and their pain points in previous truck models and how the new F-150 can solve their everyday issues. All of that resulted in new UX inventions like stow away, foldable shifter, bigger work surface inside, tailgate workbench or improved front seat design allowing a customer to take a nap in the vehicle.
5G & V2X – shaping the future of automotive
Another important presentation delivered by Claes Herlitz, VP and Head of Global Automotive Services at Ericsson, went through a relevant topic - always-connected vehicle infrastructure.
The challenge of a connected vehicle is the network bandwidth, stability of the connection, but also prioritization of services and a cost factor for the customer.
With overcoming this challenge, organic growth can come because of new services being available: fast, over-the-air updates improving the car and adding new features, data used for analytics to find the ways to improve cost efficiency and user experience.
Finding a balance between customer consent, data & new products
Next, Magnus Gunnarsson from Ericson, Sebastian Lasek from Skoda Auto, Manfred Wiedemann from Porsche AG, and Diego Villuendas Pellicero from Seat jointly participated in a panel covering the customer data handling from the perspective of different regions: Europe, USA, and China, using the data for designing and evaluating new products and strategies increasing customer acceptance for the handling of data securely.
With cars becoming always connected, IoT devices, the amounts of data about customer behavior or the vehicles itself grows exponentially. This may raise questions about data security, user consent for data storage and usage for e-commerce, marketing and improving user experience.
In Europe, the common framework for handling this situation is GDPR (General Data Protection Regulation), which helps to establish a common baseline for all manufacturers regarding data security and customer consent. It also helps OEMs feel safe when operating under this kind of strict regulations.
On the other hand, the big question arises if other regions, like America or China, should use the same processes, as both legal regulations and cultural differences may be an important aspect to consider when, for example, the vehicle infotainment asks customers for license acceptance or data usage consent when this is not really necessary.
All things considered, the big challenge for data monetization in Europe now is getting higher user acceptance.
The future of in-car payments – converting the car to a marketplace
Will Judge, Vice-President for Mobility Payments in Mastercard, explained in his presentation how car infotainment can be converted into a digital marketplace. For most customers, the convenience of digital commerce is not as important as its security. They want to feel they control the payment process with full knowledge about all parties that can access their sensitive data. Modern credit card providers enable digital transactions using secure tokens of the payment card that can be transferred through the internet, as well as heuristic and AI for fraud detection making the whole process safer.
With this level of security, the digital purchases can be safely provided in-car directly from infotainment systems with a rather easy-to-use manner for the user.
Automotive Tech Week Megatrends covered most of the hot topics that the industry is currently talking about. Great speakers representing world-recognized brands like Skoda and Audi showed some great results of their approach to innovation but most importantly how they are changing the way their organizations think of monetizing cars. Having advertisements appearing on your infotainment and a marketplace in Skoda cars seems to be the way that others will follow in the coming months/years. It is clearly visible how the Internet and Internet of Things, ecology, and data-driven approaches are guiding the industry to expand the market presence through sharing economy and subscription-based mobility. It seems that C.A.S.E strategy (Connected-Autonomous-Shared-Electric) is still the way to go!


Automation testing: Making tests independent from existing data
Each test automation project is different. The apps are different, the approach is different, even though the tools and frameworks used might seem to be the same. Each project brings different challenges and requirements, resulting in a need to adapt to solutions being delivered - although all of it is covered by the term "software testing". This time we want to tackle the issue of test data being used in automation testing.
Setting up the automation testing project
Let's consider the following scenario: as usual, our project implements the Page Object Pattern approach with the use of Cucumber .). This part is no novelty - tidy project structure and test scenarios written in Gherkin, which is easily understandable by non-technical team members. However, the application being tested required total independence from data existing in the database, even in Development and QA environments.
The solution implemented by our team had to ensure that every Test Scenario - laid out in each Feature File, which contains steps for testing particular functionalities, was completely independent from data existing on the environment and did not interfere with other Test Cases. What was also important, the tests were also meant to run simultaneously on Selenium Grid. In a nutshell, Feature Files couldn't rely on any data (apart from login credentials) and had to create all of the test data each time they were run.
To simplify the example we are going to discuss, we will describe an approach where only one user will be used to log in to the app. Its credentials remain unchanged so there are two things to do here to meet the project criteria: the login credentials have to be passed to the login scenario and said scenario has to be triggered before each Feature File since they are run simultaneously by a runner.
Independent logging in
The first part is really straightforward; in your environment file you need to include a similar block of code:
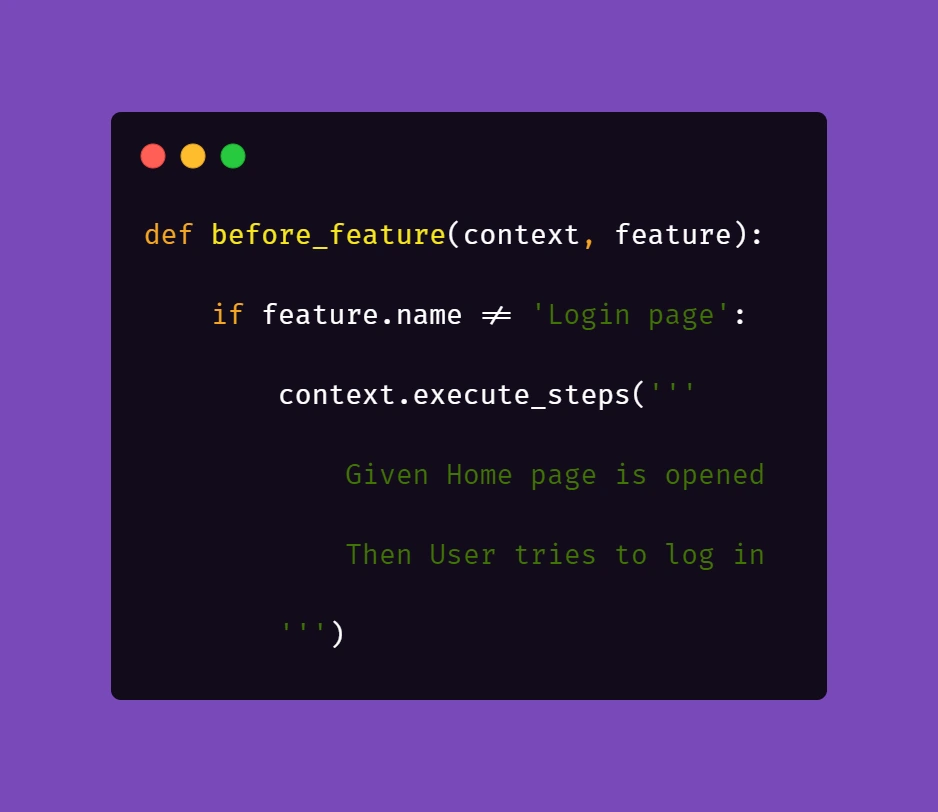
What this does is, before each feature file, which is not a Login scenario, Selenium will attempt to open the homepage of the project and attempt to log in.
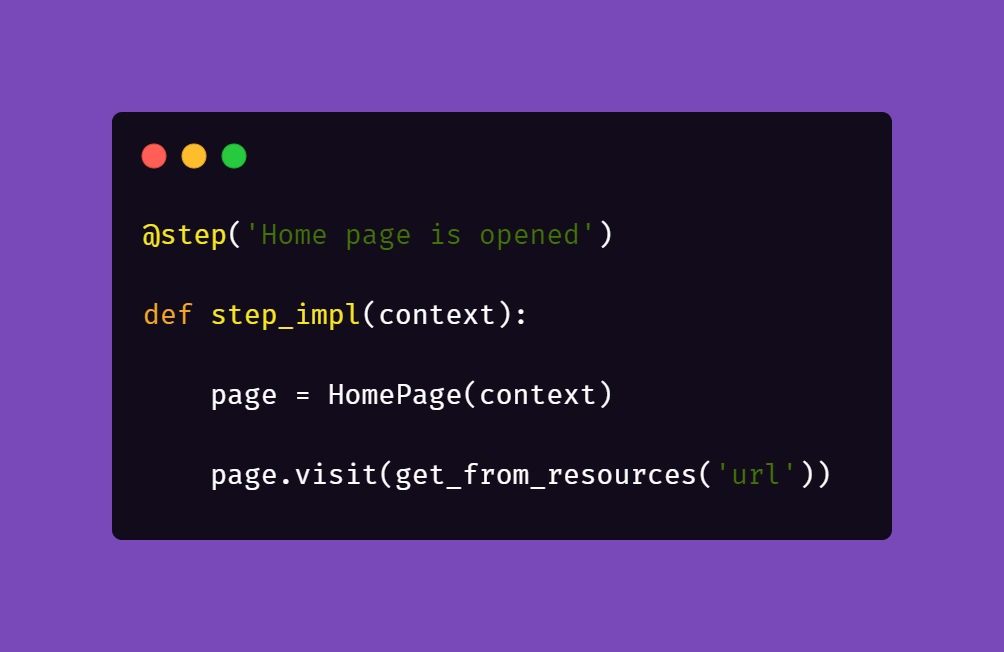
Then, we need to ensure that if a session is active, logging in should be skipped.

Therefore, in the second step 'User tries to log in' we verify if within the instance of running a particular feature file, the user's session is still active. In our case, when the homepage is opened and a logged user's session is active, the app's landing page is opened. Otherwise, the user is redirected to the login page. So in the above block of code we simply verify whether the login page is opened and if login_prompt_is_displayed method returns True , login steps are executed.
Once we dealt with logging in during simultaneous test runs, we need to handle the data being used during the tests. Again, let us simplify the example: let's assume that our hypothetical application allows its users - store staff - to add and review products the company has to offer. The system allows manipulating many data fields that affect other factors in workflows, e.g. product bundles, discounts, and suppliers. On top of that, the stock constantly grows and changes, thus even in test environments we shouldn't just run tests against migrated data to ensure consistency in test results.
As a result of that, our automation tests will have to cover the whole flow, adding all the necessary elements to the system to test against later on. In short: if we want to cover a scenario for editing certain data in a product, the tests will need to create that specific product, save it, search for it, manipulate the data, save changes and verify the results.
Create and manipulate
Below are the test steps to the above scenario laid out in Gherkin to illustrate what will it look like:
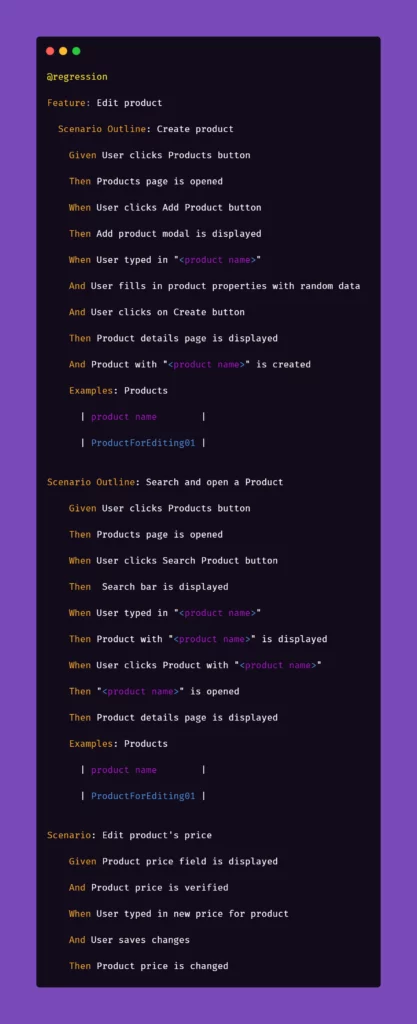
While the basic premise of the above scenarios may seem straightforward, the tricky part may be ensuring consistency during test runs. Of course, scripting a single scenario of adding an item in the app sounds simple, but what if we would have to do that a couple dozens of time during the regression suite run?
We want to have consistent, trackable test data while avoiding multiplying lines of code. To achieve that, we introduced another file to the project structure called 'globals' and placed it in the directory of feature files. Please note that in the above snippet, we extensively use "Examples" sections along with the "Scenario Outline" approach in Gherkin. We do that to pass parameters into test step definitions and methods that create and manipulate the actions we want to test in the application. That first stage of parametrization of a test scenario works in conjunction with the aforementioned 'globals' file. Let's consider the following contents of such file:
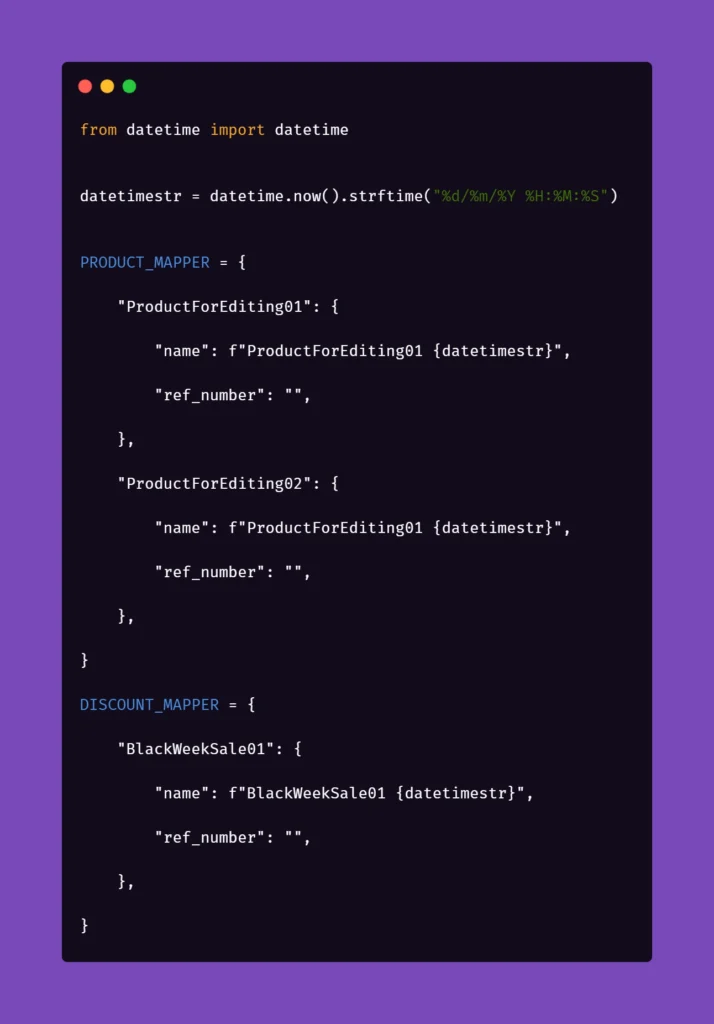
Inside the ‘globals’ file, you can find mappers for each type of object that the application can create and manipulate, for now including only a name and a reference number as an empty string. As you can see, each element will receive a datetime stamp right after its core name, each time the object in the mapper is called for. That will ensure the data created will always be unique. But what is the empty string for, you may ask?
The answer is as simple as its usage: we can store different parameters of objects inside the app that we test. For example, if a certain object can be found only by its reference number, which is unique and assigned by the system after creating, e.g., a product, we might want to store that in the mapper to use it later. But why stop there? The possibilities go pretty much as far as your imagination and patience go. You can use mappers to pass on various parameters to test steps if you need:

As you can see, the formula of mappers can really come in handy when your test suite needs to create somewhat repeatable, custom data for tests. The above snippet includes parameters for the creation of an item in the app which is a promotional campaign including certain types of products. Above that, you can see a mapping for a product that falls into one of the categories qualifying it for the promotional campaign. So hypothetically, if you want to test a scenario where enabling a promotional campaign will automatically discount certain products in the app, the mapping could help with that. But let's stick to basic examples to illustrate how to pass these parameters into the methods behind test steps.
Let us begin with the concept of creating products mentioned in the Gherkin snippet. Below is the excerpt from /steps file for step "User typed in "<product name>"":
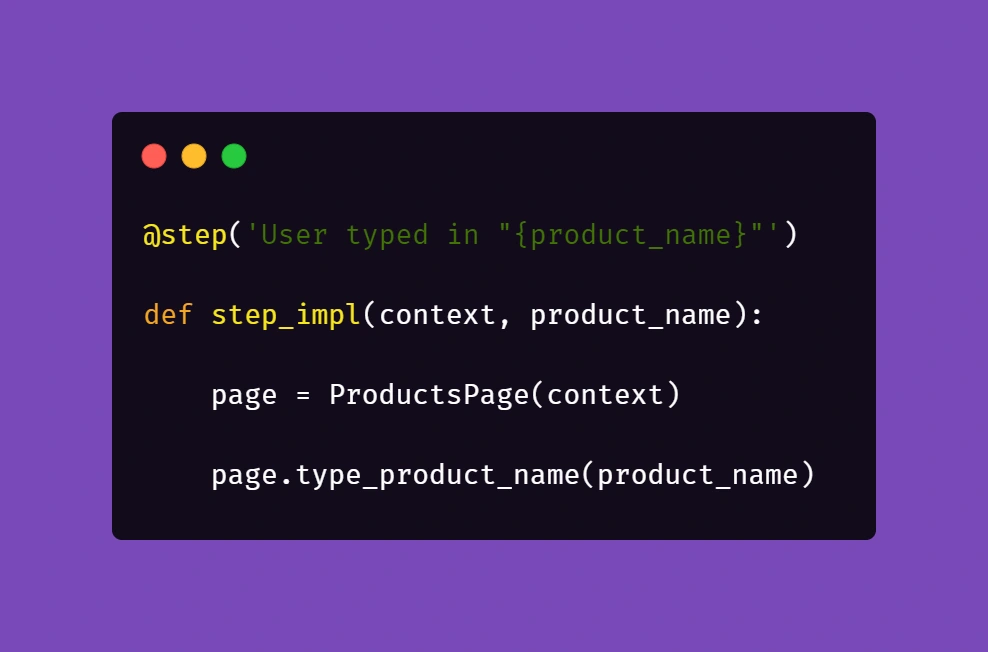
Above, we just simply pass the parameter from Gherkin to the method. Nothing fancy here. But it gets more interesting in /pages file:
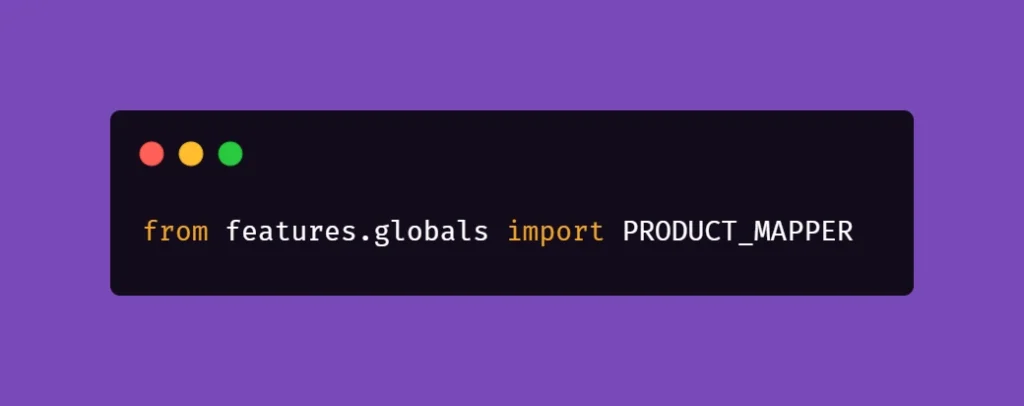
First, you'll need to import a globals file to get to the data mapped out there:
Next, we want to extract the data from mapper:
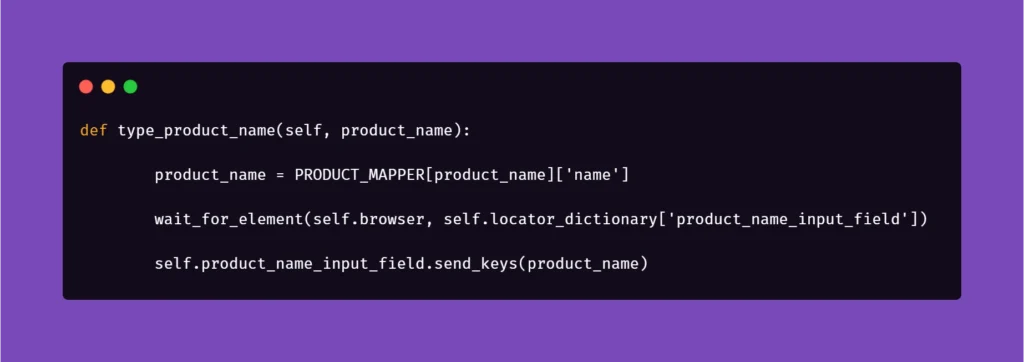
Basically, the name for the product inputted in the Examples section in Scenario Outline matches the name in PRODUCT_MAPPER . Used as a variable, it allows Selenium to input the same name with a timestamp each time the scenario asks for the creation of a certain object. This concept can be used quite extensively in the test code, parameterizing anything you need.
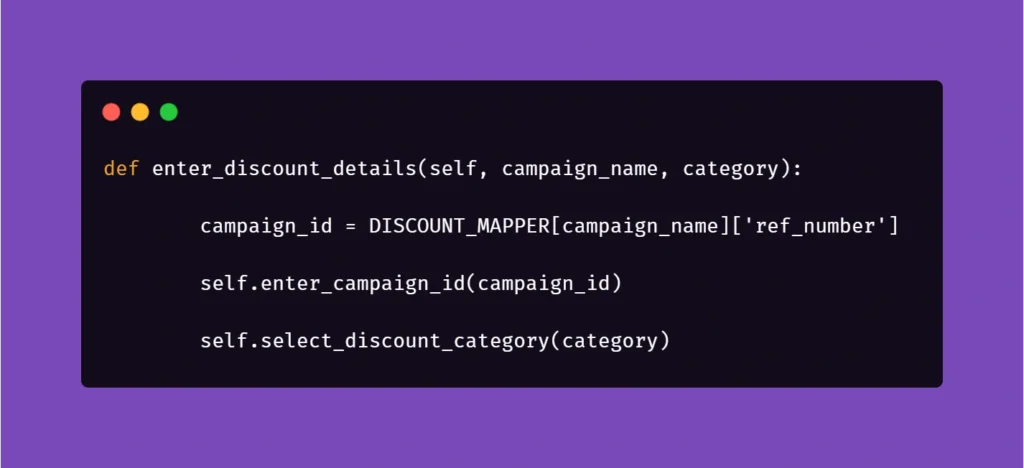
And another example:

Here, we get the data from mapper to create a specific locator to use in a specific context. This way, if the app supports it, test code can be reduced due to parametrization.
We hope that the concepts presented in this article will help you get on with your work on test automation suites. These ideas should help you automate tests faster, more clever, and much more efficiently, resulting in maximum consistency and stable results.

Kafka transactions - integrating with legacy systems
The article covers setting up and using Kafka transactions, specifically in the context of legacy systems that run on JPA/JMS frameworks. We look at various issues that may occur from using different TransactionManagers and how to properly use these different transactions to achieve desired results. Finally, we analyze how Kafka transactions can be integrated with JTA.
Many legacy applications were built on JMS consumers with the JPA database, relying on transactions to ensure exactly-once delivery. These systems rely on the stability and surety of transactional protocols so that errors are avoided. The problem comes when we try to integrate such systems with newer systems built upon non-JMS/JPA solutions – things like Kafka, MongoDB, etc.
Some of these systems, like MongoDB , actively work to make the integration with legacy JMS/JPA easier. Others, like Kafka, introduce their own solutions to such problems. We will look more deeply into Kafka and the ways we can integrate it with our legacy system.
If you want some introduction to Kafka fundamentals, start with this article covering the basics .
Classic JMS/JPA setup
First, let us do a quick review of the most common setups for legacy systems. They often use JMS to exchange messages between different applications, be it IBM MQ, RabbitMQ, ActiveMQ, Artemis, or other JMS providers – these are used with transactions to ensure exactly-once delivery. Messages are then processed in the application, oftentimes saving states in a database via JPA API using Hibernate/Spring Data to do so. Sometimes additional frameworks are used to make the processing easier to write and manage, but in general, the processing may look similar to this example:
@JmsListener(destination = "message.queue")
@Transactional(propagation = Propagation.REQUIRED)
public void processMessage(String message) {
exampleService.processMessage(message);
MessageEntity entity = MessageEntity.builder().content(message).build();
messageDao.save(entity);
exampleService.postProcessMessage(entity);
messageDao.save(entity);
jmsProducer.sendMessage(exampleService.createResponse(entity));
}
Messages are read, processed, saved to the database, processed further, updated in the database, and the response is sent to a further JMS queue. It is all done in a transactional context in one of two possible ways:
1) Using a separate JMS and JPA transaction during processing, committing a JPA transaction right before committing JMS.
2) Using JTA to merge JMS and JPA transactions so that both are committed or aborted at the same time.
Both solutions have their upsides and pitfalls; neither of them fully guarantees a lack of duplicates, though JTA definitely gives better guarantees than separate transactions. JTA also does not run into the problem of idempotent consumers, it does, however, come with an overhead. In either case, we may run into problems if we try to integrate this with Kafka.
What are Kafka transactions?
Kafka broker is fast and scalable, but the default mode in which it runs does not hold to exactly-once message delivery guarantee. We may see duplicates, or we may see some messages lost depending on circumstances, something that old legacy systems based on transactions cannot accept. As such, we need to switch Kafka to transactional mode, enabling exactly-once guarantee.
Transactions in Kafka are designed so that they are mainly handled on the producer/message broker side, rather than the consumer side. The consumer is effectively an idempotent reader, while the producer/coordinator handle the transaction.
This reduces performance overload on the consumer side, though at the cost of the broker side. The flow looks roughly like this:
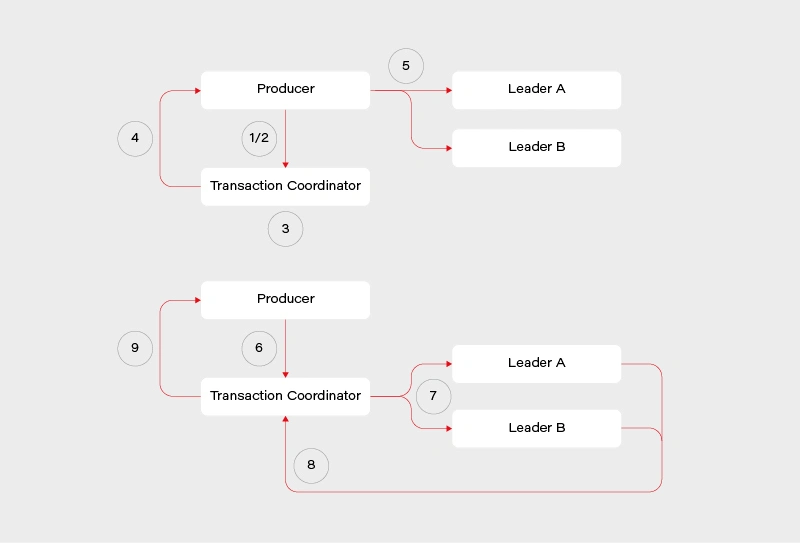
1) Determine which broker is the coordinator in the group
2) Producer sends beginTransaction() request to the coordinator
3) The coordinator generates transaction-id
4) Producer receives a response from the coordinator with transaction-id
5) Producer sends its messages to the leading brokers of data partitions together with transaction-id
6) Producer sends commitTransaction() request to the coordinator and awaits the response
7) Coordinator sends commitTransaction() request to every leader broker and awaits their responses
8) Leader brokers set the transaction status to committed for the written records and send the response to the coordinator
9) Coordinator sends transaction result to the producer
This does not contain all the details, explaining everything is beyond the scope of this article and many sources can be found on this. It does however give us a clear view on the transaction process – the main player responsible is the transaction coordinator. It notifies leaders about the state of the transaction and is responsible for propagating the commit. There is some locking involved in the producer/coordinator side that may affect performance negatively depending on the length of our transactions.
Readers, meanwhile, simply operate in read-committed mode, so they will be unable to read messages from transactions that have not been committed.
Kafka transactions - setup and pitfalls
We will look at a practical example of setting up and using Kafka transactions, together with potential pitfalls on the consumer and producer side, also looking at specific ways Kafka transactions work as we go through examples. We will use Spring to set up our Kafka consumer/producer. To do this, we first have to import Kafka into our pom.xml :
<!-- Kafka -->
<dependency>
<groupId>org.springframework.kafka</groupId>
<artifactId>spring-kafka</artifactId>
</dependency>
To enable transactional processing for the producer, we need to tell Kafka to explicitly enable idempotence, as well as give it transaction-id :
producer:
bootstrap-servers: localhost:9092
transaction-id-prefix: tx-
properties:
enable.idempotence: true
transactional.id: tran-id-1
Each producer needs its own, unique transaction-id , otherwise, we will encounter errors if more than one producer attempts to perform a transaction at the same time. It is crucial to make sure that each instance of an application in a cloud environment has its own unique prefix/transaction-id . Additional setup must also be done for the consumer:
consumer:
bootstrap-servers: localhost:9092
group-id: group_id
auto-offset-reset: earliest
enable-auto-commit: false
isolation-level: read_committed
The properties that interest us set enable-auto-commit to false so that Kafka does not periodically commit transactions on its own. Additionally, we set isolation-level to read committed, so that we will only consume messages when the producer fully commits them. Now both the consumer and the producer are set to exactly-once delivery with transactions.
We can run our consumer and see what happens if an exception is thrown after writing to the queue but before the transaction is fully committed. For this purpose, we will create a very simple REST mapping so that we write several messages to the Kafka topic before throwing an exception:
@PostMapping(value = "/required")
@Transactional(propagation = Propagation.REQUIRED)
public void sendMessageRequired() {
producer.sendMessageRequired("Test 1");
producer.sendMessageRequired("Test 2");
throw new RuntimeException("This is a test exception");
}
The result is exactly as expected – the messages are written to the queue but not committed when an exception is thrown. As such the entire transaction is aborted and each batch is aborted as well. This can be seen in the logs:
2021-01-20 19:44:29.776 INFO 11032 --- [io-9001-exec-10] c.g.k.kafka.KafkaProducer : Producing message "Test 1"
2021-01-20 19:44:29.793 INFO 11032 --- [io-9001-exec-10] c.g.k.kafka.KafkaProducer : Producing message "Test 2"
2021-01-20 19:44:29.808 ERROR 11032 --- [producer-tx-1-0] o.s.k.support.LoggingProducerListener : Exception thrown when sending a message with key='key-1-Test 1' and payload='1) Test 1' to topic messages_2:
org.apache.kafka.common.KafkaException: Failing batch since transaction was aborted
at org.apache.kafka.clients.producer.internals.Sender.maybeSendAndPollTransactionalRequest(Sender.java:422) ~[kafka-clients-2.5.1.jar:na]
at org.apache.kafka.clients.producer.internals.Sender.runOnce(Sender.java:312) ~[kafka-clients-2.5.1.jar:na]
at org.apache.kafka.clients.producer.internals.Sender.run(Sender.java:239) ~[kafka-clients-2.5.1.jar:na]
at java.base/java.lang.Thread.run(Thread.java:834) ~[na:na]
2021-01-20 19:44:29.808 ERROR 11032 --- [producer-tx-1-0] o.s.k.support.LoggingProducerListener : Exception thrown when sending a message with key='key-1-Test 2' and payload='1) Test 2' to topic messages_2:
org.apache.kafka.common.KafkaException: Failing batch since transaction was aborted
at org.apache.kafka.clients.producer.internals.Sender.maybeSendAndPollTransactionalRequest(Sender.java:422) ~[kafka-clients-2.5.1.jar:na]
at org.apache.kafka.clients.producer.internals.Sender.runOnce(Sender.java:312) ~[kafka-clients-2.5.1.jar:na]
at org.apache.kafka.clients.producer.internals.Sender.run(Sender.java:239) ~[kafka-clients-2.5.1.jar:na]
at java.base/java.lang.Thread.run(Thread.java:834) ~[na:na]
The LoggingProducerListener exception contains the key and contents of the message that failed to be sent. The exception tells us that the batch has been failed because the transaction was aborted. Exactly as expected, the entire transaction is atomic so failing it at the end will cause messages successfully written beforehand to not be processed.
We can do the same test for the consumer, the expectation is that the transaction will be rolled back if a message processing error occurs. For that, we will create a simple consumer that will log something and then throw it.
@KafkaListener(topics = "messages_2", groupId = "group_id")
public void consumePartitioned(String message) {
log.info(String.format("Consumed partitioned message \"%s\"", message));
throw new RuntimeException("This is a test exception");
}
We can now use our REST endpoints to send some messages to the consumer. Sure enough, we see the exact behavior we expect – the message is read, the log happens, and then rollback occurs.
2021-01-20 19:48:33.420 INFO 14840 --- [ntainer#0-0-C-1] c.g.k.kafka.KafkaConsumer : Consumed partitioned message "1) Test 1"
2021-01-20 19:48:33.425 ERROR 14840 --- [ntainer#0-0-C-1] essageListenerContainer$ListenerConsumer : Transaction rolled back
org.springframework.kafka.listener.ListenerExecutionFailedException: Listener method 'public void com.grapeup.kafkatransactions.kafka.KafkaConsumer.consumePartitioned(java.lang.String)' threw exception; nested exception is java.lang.RuntimeException: This is a test exception
at org.springframework.kafka.listener.adapter.MessagingMessageListenerAdapter.invokeHandler(MessagingMessageListenerAdapter.java:350) ~[spring-kafka-2.5.7.RELEASE.jar:2.5.7.RELEASE]
Of course, because of the rollback, the message goes back on the topic. This results in the consumer reading it again, throwing and rolling back, creating an infinite loop that will lock other messages out for this partition. This is a potential issue that we must keep in mind when using Kafka transactions messaging, the same way as we would with JMS. The message will persist if we restart the application or the broker so mindful handling of the exception is required – we need to identify exceptions that require a rollback and those that do not. This is a very-application-specific problem so there is no way to give a clear-cut solution in this article simply because such a solution does not exist.
Last but not least, it is worth noting that propagation works as expected with Spring and Kafka transactions. If we start a new transaction via @Transactional annotation with REQUIRES_NEW propagation, then Kafka will start a new transaction that commits separately from the original one and whose commit/abort result has no effect on the parent one.
There are a few more things we have to keep in mind when working with Kafka transactions, some of them to be expected, others not as much. The first thing is the fact that producer transactions lock down the topic partition that it writes. This can be seen if we run 2 servers and make one transaction delayed. In our case, we started a transaction on server 1 that wrote messages to a topic and then waited 10 seconds to commit the transaction. Server 2 in the meantime wrote its own messages and committed immediately while Server 1 was waiting. The result can be seen in the logs:
Server 1:
2021-01-20 21:38:27.560 INFO 15812 --- [nio-9001-exec-1] c.g.k.kafka.KafkaProducer : Producing message "Test 1"
2021-01-20 21:38:27.578 INFO 15812 --- [nio-9001-exec-1] c.g.k.kafka.KafkaProducer : Producing message "Test 2"
Server 2:
2021-01-20 21:38:35.296 INFO 14864 --- [ntainer#0-0-C-1] c.g.k.kafka.KafkaConsumer : Consumed message "1) Test 1 Sleep"
2021-01-20 21:38:35.308 INFO 14864 --- [p_id.messages.0] o.a.k.c.p.internals.TransactionManager : [Producer clientId=producer-tx-2-group_id.messages.0, transactionalId=tx-2-group_id.messages.0] Discovered group coordinator gu17.ad.grapeup.com:9092 (id: 0 rack: null)
2021-01-20 21:38:35.428 INFO 14864 --- [ntainer#0-0-C-1] c.g.k.kafka.KafkaConsumer : Consumed message "1) Test 2 Sleep"
2021-01-20 21:38:35.549 INFO 14864 --- [ntainer#0-0-C-1] c.g.k.kafka.KafkaConsumer : Consumed message "1) Test 1"
2021-01-20 21:38:35.676 INFO 14864 --- [ntainer#0-0-C-1] c.g.k.kafka.KafkaConsumer : Consumed message "1) Test 2"
Messages were consumed by Server 2 after Server 1 has committed its long-running transaction. Only a partition is locked, not the entire topic – as such, depending on the partitions that producers send messages to, we may encounter full, partial, or no locking at all. The lock is held until the end of the transaction, be it via commit or abort.
Another interesting thing is the order of messages – messages from Server 1 appear before messages from Server 2, even though Server 2 committed its transaction first. This is in contrast to what we would expect from JMS – the messages committed to JMS first would appear first, unlike our example. It should not be a major problem but it is something we must, once again, keep in mind while designing our applications.
Putting it all together
Now that we have Kafka transactions running, we can try and add JMS/JPA configuration to it. We can once again utilize the Spring setup to quickly integrate these. For the sake of the demo, we use an in-memory H2 database and ActiveMQ:
<!-- JPA setup -->
<dependency>
<groupId>org.springframework.boot</groupId>
<artifactId>spring-boot-starter-data-jpa</artifactId>
</dependency>
<dependency>
<groupId>com.h2database</groupId>
<artifactId>h2</artifactId>
<scope>runtime</scope>
</dependency><!-- Active MQ -->
<dependency>
<groupId>org.springframework.boot</groupId>
<artifactId>spring-boot-starter-activemq</artifactId>
</dependency>
<dependency>
<groupId>org.apache.activemq</groupId>
<artifactId>activemq-broker</artifactId>
</dependency>
<dependency>
<groupId>com.google.code.gson</groupId>
<artifactId>gson</artifactId>
</dependency>
We can set up a simple JMS listener, which reads a message in a transaction, saves something to the database via JPA, and then publishes a further Kafka message. This reflects a common way to try and integrate JMS/JPA with Kafka:
@JmsListener(destination = "message.queue")
@Transactional(propagation = Propagation.REQUIRED)
public void processMessage(String message) {
log.info("Received JMS message: {}", message);
messageDao.save(MessageEntity.builder().content(message).build());
kafkaProducer.sendMessageRequired(message);
}
Now if we try running this code, we will run into issues – Spring will protest that it got 2 beans of TransacionManager class. This is because JPA/JMS uses the base TransactionManager and Kafka uses its own KafkaTransactionManager . To properly run this code we have to specify which transaction manager is to be used in which @Transactional annotation. These transaction managers are completely separate and the transactions they start or commit do not affect each other. As such, one can be committed and one aborted if we throw an exception at a correct time. Let’s amend our listener for further analysis:
@JmsListener(destination = "message.queue")
@Transactional(transactionManager = "transactionManager", propagation = Propagation.REQUIRED)
public void processMessage(String message) {
log.info("Received JMS message: {}", message);
messageDao.save(MessageEntity.builder().content(message).build());
kafkaProducer.sendMessageRequired(message);
exampleService.processMessage(message);
}
In this example, we correctly mark @Transactional annotation to use a bean named transactionManager , which is the JMS/JPA bean. In a similar way, @Transactional annotation in KafkaProducer is marked to use kafkaTransactionManager , so that Kafka transaction is started and committed within that function. The issue with this code example is the situation, in which ExampleService throws in its processMessage function at line 10.
If such a thing occurs, then the JMS transaction is committed and the message is permanently removed from the queue. The JPA transaction is rolled back, and nothing is actually written to the database despite line 6. The Kafka transaction is committed because no exception was thrown in its scope. We are left with a very peculiar state that would probably need manual fixing.
To minimize such situations we should be very careful about when to start which transaction. Optimally, we would start Kafka transactions right after starting JMS and JPA transactions and commit it right before we commit JPA and JMS. This way we minimize the chance of such a situation occurring (though still cannot fully get rid of it) – the only thing that could cause one transaction to break and not the other is connection failure between commits.
Similar care should be done on the consumer side. If we start a Kafka transaction, do some processing, save to database, send a JMS message, and send a Kafka response in a naive way:
@KafkaListener(topics = "messages_2", groupId = "group_id")
@Transactional(transactionManager = "kafkaTransactionManager", propagation = Propagation.REQUIRED)
public void processMessage(String message) {
exampleService.processMessage(message);
MessageEntity entity = MessageEntity.builder().content(message).build();
messageDao.save(entity);
exampleService.postProcessMessage(entity);
messageDao.save(entity);
jmsProducer.sendMessage(message);
kafkaProducer.sendMessageRequired(exampleService.createResponse(entity));
}
Assuming MessageDAO/JmsProducer start their own transaction in their function, what we will end up with if line 12 throws is a duplicate entry in the database and a duplicate JMS message. The Kafka transaction will be properly rolled back, but the JMS and JPA transactions were already committed, and we will now have to handle the duplicate. What we should do in our case, is to start all transactions immediately and do all of our logic within their scope. One of the solutions to do so, is to create a helper bean that accepts a function to perform within a @Transactional call:
@Service
public class TransactionalHelper {
@Transactional(transactionManager = "transactionManager",
propagation = Propagation.REQUIRED)
public void executeInTransaction(Function f) {
f.perform();
}
@Transactional(transactionManager = "kafkaTransactionManager",
propagation = Propagation.REQUIRED)
public void executeInKafkaTransaction(Function f) {
f.perform();
}
public interface Function {
void perform();
}
}
This way, our call looks like this:
@KafkaListener(topics = "messages_2", groupId = "group_id")
@Transactional(transactionManager = "kafkaTransactionManager", propagation = Propagation.REQUIRED)
public void processMessage(String message) {
transactionalHelper.executeInTransaction(() -> {
exampleService.processMessage(message);
MessageEntity entity = MessageEntity.builder().content(message).build();
messageDao.save(entity);
exampleService.postProcessMessage(entity);
messageDao.save(entity);
jmsProducer.sendMessage(message);
kafkaProducer.sendMessageRequired(exampleService.createResponse(entity));
});
}
Now we start the processing within the Kafka transaction and end it right before the Kafka transaction is committed. This is of course assuming no REQUIRES_NEW propagation is used throughout the inner functions. Once again, in an actual application, we would need to carefully consider transactions in each subsequent function call to make sure that no separate transactions are running without our explicit knowledge and consent.
We will run into a problem, however – the way Spring works, JPA transactions will behave exactly as expected. JMS transaction will be started in JmsProducer anyway and committed on its own. The impact of this could be minimized by moving ExampleService call from line 13 to before line 12, but it’s still an issue we need to keep an eye on. It becomes especially important if we have to write to several different JMS queues as we process our message.
There is no easy way to force Spring to merge JPA/JMS transactions, we would need to use JTA for that.
What can and cannot be done with JTA
JTA has been designed to merge several different transactions, effectively treating them as one. When the JTA transaction ends, each participant votes whether to commit or abort it, with the result of the voting being broadcasted so that participants commit/abort at once. It is not 100% foolproof, we may encounter a connection death during the voting process, which may cause one or more of the participants to perform a different action. The risk, however, is minimal due to the way transactions are handled.
The main benefit of JTA is that we can effectively treat several different transactions as one – this is most often used with JMS and JPA transactions. So the question arises, can we merge Kafka transactions into JTA and treat them all as one? Well, the answer to that is sadly no – the Kafka transactions do not follow JTA API and do not define XA connection factories. We can, however, use JTA to fix the issue we encountered previously between JMS and JPA transactions.
To set up JTA in our application, we do need a provider; however, base Java does not provide an implementation of JTA, only the API itself. There are various providers for this, sometimes coming with the server, Websphere, and its UOP Transaction Manager being a good example. Other times, like with Tomcat, nothing is provided out of the box and we have to use our own. An example of a library that does this is Atomikos – it does have a paid version but for the use of simple JTA, we are good enough with the free one.
Spring made importing Atomikos easy with a starter dependency:
<!-- JTA setup -->
<dependency>
<groupId>org.springframework.boot</groupId>
<artifactId>spring-boot-starter-jta-atomikos</artifactId>
</dependency>
Spring configures our JPA connection to use JTA on its own; to add JMS to it, however, we have to do some configuration. In one of our @Configuration classes, we should add the following beans:
@Configuration
public class JmsConfig {
@Bean
public ActiveMQXAConnectionFactory connectionFactory() {
ActiveMQXAConnectionFactory connectionFactory = new ActiveMQXAConnectionFactory();
connectionFactory.setBrokerURL("tcp://localhost:61616");
connectionFactory.setPassword("admin");
connectionFactory.setUserName("admin");
connectionFactory.setMaxThreadPoolSize(10);
return connectionFactory;
}
@Bean(initMethod = "init", destroyMethod = "close")
public AtomikosConnectionFactoryBean atomikosConnectionFactory() {
AtomikosConnectionFactoryBean atomikosConnectionFactory = new AtomikosConnectionFactoryBean();
atomikosConnectionFactory.setUniqueResourceName("XA_JMS_ConnectionFactory");
atomikosConnectionFactory.setXaConnectionFactory(connectionFactory());
atomikosConnectionFactory.setMaxPoolSize(10);
return atomikosConnectionFactory;
}
@Bean
public JmsTemplate jmsTemplate() {
JmsTemplate template = new JmsTemplate();
template.setConnectionFactory(atomikosConnectionFactory());
return template;
}
@Bean
public DefaultJmsListenerContainerFactory jmsListenerContainerFactory(PlatformTransactionManager transactionManager) {
DefaultJmsListenerContainerFactory factory = new DefaultJmsListenerContainerFactory();
factory.setConnectionFactory(atomikosConnectionFactory());
factory.setConcurrency("1-1");
factory.setTransactionManager(transactionManager);
return factory;
}
}
We define an ActiveMQXAConnectionFactory , which implements XAConnectionFactory from JTA API. We then define a separate AtomikosConnectionFactory , which uses ActiveMQ one. For all intents and purposes, everything else uses Atomikos connection factory – we set it for JmsTemplate and DefaultJmsListenerContainerFactory . We also set the transaction manager, which will now become the JTA transaction manager.
Having all of that set, we can run our application again and see if we still encounter issues with transactions not behaving as we want them to. Let’s set up a JMS listener with additional logs for clarity:
@JmsListener(destination = "message.queue")
@Transactional(transactionManager = "transactionManager", propagation = Propagation.REQUIRED)
public void processMessage(final String message) {
transactionalHelper.executeInKafkaTransaction(() -> {
MessageEntity entity = MessageEntity.builder().content(message).build();
messageDao.save(entity);
log.info("Saved database entity");
kafkaProducer.sendMessageRequired(message);
log.info("Sent kafka message");
jmsProducer.sendMessage("response.queue", "Response: " + message);
log.info("Sent JMS response");
throw new RuntimeException("This is a test exception");
});
}
We expect that JTA and Kafka transactions will both roll back, nothing will be written to the database, nothing will be written to response.queue , nothing will be written to Kafka topic, and that the message will not be consumed. When we run this, we get the following logs:
2021-01-20 21:56:00.904 INFO 9780 --- [enerContainer-1] c.g.kafkatransactions.jms.JmsConsumer : Saved database entity
2021-01-20 21:56:00.906 INFO 9780 --- [enerContainer-1] c.g.k.kafka.KafkaProducer : Producing message "This is a test message"
2021-01-20 21:56:00.917 INFO 9780 --- [enerContainer-1] c.g.kafkatransactions.jms.JmsConsumer : Sent kafka message
2021-01-20 21:56:00.918 INFO 9780 --- [enerContainer-1] c.g.kafkatransactions.jms.JmsProducer : Sending JMS message: Response: This is a test message
2021-01-20 21:56:00.922 INFO 9780 --- [enerContainer-1] c.g.kafkatransactions.jms.JmsConsumer : Sent JMS response
2021-01-20 21:56:00.935 WARN 9780 --- [enerContainer-1] o.s.j.l.DefaultMessageListenerContainer : Execution of JMS message listener failed, and no ErrorHandler has been set.
org.springframework.jms.listener.adapter.ListenerExecutionFailedException: Listener method 'public void com.grapeup.kafkatransactions.jms.JmsConsumer.processMessage(java.lang.String)' threw exception; nested exception is java.lang.RuntimeException: This is a test exception
at org.springframework.jms.listener.adapter.MessagingMessageListenerAdapter.invokeHandler(MessagingMessageListenerAdapter.java:122) ~[spring-jms-5.2.10.RELEASE.jar:5.2.10.RELEASE]
The exception thrown is followed by several errors about rolled back transactions. After checking our H2 database and looking at Kafka/JMS queues, we can indeed see that everything we expected has been fulfilled. The original JMS message was not consumed either, starting an endless loop which, once again, we would have to take care of in a running application. The key part though is that transactions behaved exactly as we intended them to.
Is JTA worth it for that little bit of surety? Depends on the requirements – do we have to write to several JMS queues simultaneously while writing to the database and Kafka? We will have to use JTA. Can we get away with a single write at the end of the transaction? We might not need to. There is sadly no clear-cut answer, we must use the right tools for the right job.
Summary
We managed to successfully launch Kafka in transactional mode, enabling exactly-once delivery mechanics. This can be integrated with JMS/JPA transactions, although we may encounter problems in our listeners/consumers depending on circumstances. If needed, we may introduce JTA to allow us an easier control of different transactions and whether they are committed or aborted. We used ActiveMQ/H2/Atomikos for this purpose, but this works with any JMS/JPA/JTA providers.
If you're looking for help in mastering cloud technologies , learn how our team works with innovative companies.

Using Azure DevOps Platform for configurable builds of a multicomponent iOS application
In this article, we share our experience with building CI/CD for a multicomponent multi-language project. The article describes the structure of the pipeline set up and focuses on two important features needed in our project’s automation workflow: pipeline chaining and build variants.
The CI/CD usage is a standard in any application development process . Mobile apps are no exception here.
In our project, we have several iOS applications and libraries. Each application uses several components (frameworks) written in different languages. The components structure is as in the picture below:
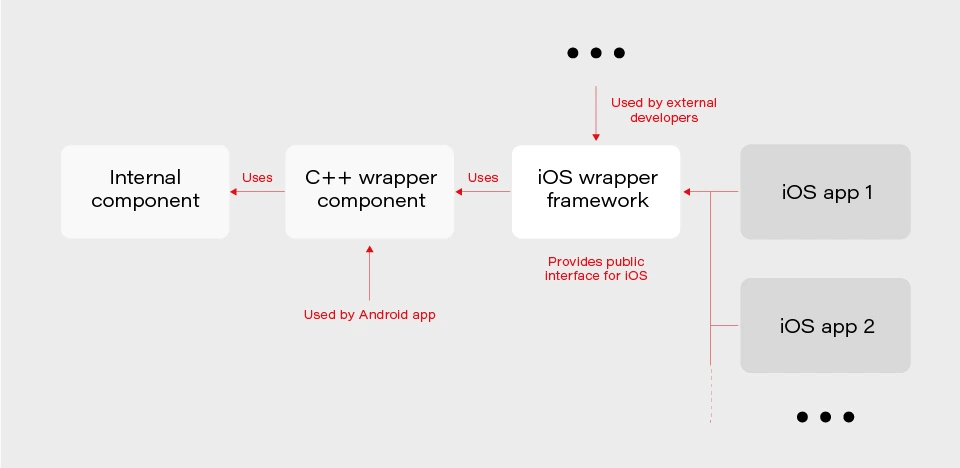
The internal component contains all the core (domain) logic that apps use. The first two components are C/C++ based and are compiled as frameworks. The wrapper framework provides an Objective-C/Swift layer that is necessary for using it in an iOS application. There are several iOS applications that are using the wrapper framework. Additionally, this framework is also used by external developers in their own applications.
The wrapper framework should be built for both x86_64 and arm64 architecture to be used on both a simulator and a real iOS device. Also, we need a debug and release version for each architecture. When it comes to applications each of them may be built for AppStore, internal testing (Ad-Hoc) or TestFlight beta testing.
Without an automated CI/CD system, it would be extremely inefficient to build the whole chain of components manually. As well as to track the status of merges/pull requests for each component. That is to control if the component is still building after the merge. Let’s see how our pipelines are organized.
Using Azure DevOps pipelines
For building CI/CD, we’ve chosen Azure DevOps. We use Azure Pipelines for building our components and Azure Artifacts to host the built components, as well as several external 3rd party libraries.
To check the integrity and track the build status of each component, we have special integration pipelines that are integrated with GitHub. That is, each pull request that is going to be merged to the development branch of a particular component triggers this special integration pipeline.
For regular builds, we have pipelines based on the purpose of each branch type: experimental, feature, bugfix, development, and master.
Since each component depends on another component built on Azure, we should somehow organize the dependency management. That is versioning of the dependent components and their download. Let’s take a look at our approach to dependency management.
Dependency management
Azure provides basic CLI tools to manipulate pipelines. We may use it to download dependencies (inform of Azure artifacts) required to build a particular component. At a minimum, we need to know the version, configuration (debug or release) and architecture (x86_64 or arm64) of a particular dependency. Let’s take a look at the options that Azure CLI gives us:
az artifacts universal download \
--organization "${Organization}" \
--feed "${Feed}" \
--name "${Name}" \
--version "${Version}" \
--path "${DownloadPath}"
The highlighted parameters are the most important for us. The CLI does not provide explicit support of build configuration or architecture. For this purpose, we simply use the name (specified as --name parameter) that has a predefined format:
<component name>-<configuration>-<architecture>
This makes it possible to have components of the same version with different architecture and build configurations.
The other aspect is how to store info about version, configuration, etc., for each dependency. We’ve decided to use the git config format to store this info. It’s pretty easy to parse using git config and does not require any additional parsing tool. So, each component has its own dependencies.config file. Below is the example file for component dependent on two frameworks:
[framework1]
architecture = "arm64"
configuration = "release"
version = "1.2.3.123"[framework2]
architecture = "arm64"
configuration = "release"
version = "3.2.1.654"
To make it possible to download dependencies as part of the build process, we have a special script that manages dependencies. The script is run as a build phase of the Xcode project of each component. Below are the basic steps the script does.
1. Parse dependencies.config file to get version, architecture, and configuration. The important thing here is that if some info is omitted (e.g. we may not specify build configuration in dependencies.config file) script will use the one the dependent component is being built with. That is, when we build the current component for the simulator script will download dependencies of simulator architecture.
2. Form artifact’s name and version and forward them to az artifacts universal download command .
There are two key features of our build infrastructure: pipeline chaining and build variants support. They cover two important cases in our project. Let’s describe how we implemented them.
Chaining pipelines
When a low-level core component is updated, we want to test these changes in the application. For this purpose, we should build the framework dependent on the core component and build the app using this framework. Automation here is extremely useful. Here’s how it looks like with our pipelines.
1. When a low-level component (let’s call it component1 ) is changed on a specific branch (e.g., integration), a special integration pipeline is triggered. When a component is built and an artifact is published, the pipeline starts another pipeline that will build the next dependent component. For this purpose, az pipelines build queue command is used as follows:
az pipelines build queue \
--project "component2" \
--branch "integration" \
--organization "${Organization}" \
--definition-name "${BuildDefinition}" \
--variables \
"config.pipeline.component1Version=${BUILD_BUILDNUMBER}" \
“config.pipeline.component1Architecture=${CurrentArchitecture}" \
"config.pipeline.component1Configuration=${CurrentConfiguration}"
This command starts the pipeline for building component2 (the one dependent on component1 ).
The key part is passing the variables config.pipeline.component1 Version, config.pipeline.component1Architecture and config.pipeline.component1Configuration to the pipeline. These variables define the version, build configuration, and architecture of component1 (the one being built by the current pipeline) that should be used to build component2 . The command overrides the corresponding values from dependencies.config file of component2 . This means that the resulting component2 will use newly built component1 dependency instead of the one defined by dependencies.config file.
2. When component2 is built, it uses the same approach to launch the next pipeline for building a subsequent component.
3. When all the components in the chain required by the app are ready, the integration pipeline building the app is launched. As a part of its build process, the app is sent to TestFlight.
So, simply pushing changes of the lowest level component to the integration branch gives you a ready-to-test app on TestFlight.
Build variants
Some external developers that use the wrapper iOS framework may need additional features that should not be available in regular public API intended for other developers. This brings us to the need of having different variants of the same component. Such variants may be distinct in different features, or in behavior of the same features.
Additional methods or classes may be provided as a specific or experimental API in a wrapper framework for iOS. The other use case is to have behavior different than the default one for regular (official) public API in the wrapper framework. For instance, a method that writes an image file to a specified directory in some cases may be required to also write additional files along with the image (e.g., file with image processing settings or metadata).
Going further, an implementation may be changed not only in the iOS framework itself but also in its dependencies. As described previously, core logic is implemented in a separate component and iOS framework is dependent on. So, when some code behavior change is required by a particular build variant, most likely it will also be done in the internal component.
Let’s see how to better implement build variants. The proper understanding of use cases and potential extension capabilities are crucial for choosing the correct solution.
The first important thing is that in our project different build variants have few changes in API compared to each other. Usually, a build variant contains a couple of additional methods or classes. Most part of the code is the same for all variants. Inside implementation, there also may be some distinctions based on the concrete variant we’re building. So, it would be enough to have some preprocessor definition (active compilation conditions for Swift) indicating which build variant is being built.
The second thing is that the number of build variants is often changed. Some may be removed, (e.g., when an experimental API becomes generally accessible.) On the other hand, when an external developer requests another specific functionality, we need to create a new variant by slightly modifying the standard implementation or exposing some experimental/internal API. This means that we should be able to add or remove build variants fast.
Let’s now describe our implementation based on the specifics given above. There are two parts of the implementation. The first one is at the pipeline level.
Since we may often add/remove our build variants, creating a pipeline for each build variant is obviously not a good idea. Instead, we add a special variable config.pipeline.buildVariant in the pipeline’s Variables to each pipeline that is supposed to be used for building different variants. The variable should be added to pipelines of all the components the resulting iOS framework depends on because a specific feature often requires code changes, not only in the iOS framework itself but also in its dependencies. Pipeline implementation then will use this variable e.g., for downloading specific dependencies required by a particular variant, tagging build to indicate the variant, and, of course, providing the corresponding build setting to Xcode build command.
The second part is a usage of the build variant setting provided by the pipeline inside the Xcode project. Using Xcode build settings we’re adding a compile-time constant (preprocessor definition for Objective C/C++ code and compilation conditions for Swift) that reflect the selected build variant. It is used to control which functionality to compile. This build settings may also be used to choose to build variant-specific resources to be embedded into the framework.
When chaining pipelines we just pass the variable to next pipeline:
az pipelines build queue \
--project "component2" \
--branch "integration" \
--organization "${Organization}" \
--definition-name "${BuildDefinition}" \
--variables \
"config.pipeline.component1Version=${BUILD_BUILDNUMBER}" \
"config.pipeline.component1Architecture=${CurrentArchitecture}" \
"config.pipeline.component1Configuration=${CurrentConfiguration}" \
“config.pipeline.buildVariant=${CONFIG_PIPELINE_BUILDVARIANT}"
Summary
In this article, we’ve described our approach to multi-component app CI/CD infrastructure based on Azure . We’ve focused on two important features of our build infrastructure: chaining component builds and building different variants of the same component. It’s worth mentioning that the described solution is not the only correct one. It's rather the most optimal that fits our needs. You may experiment and try different approaches utilizing a flexible developed pipeline system that Azure provides.

8 tips for an agile debugging of a web application
Building a complex web application, you've probably encountered the fact that something didn’t work as planned. You’ve spent hours and hours looking for a bug in your code and then on the internet searching for help with fixing the problem. To make it easier for you, in this article we explain some effective techniques of debugging a web application that significantly reduce the pain of debugging and shorten the time of detecting issues.
Console.log
First, a commonly used javascript method console.log. You can insert a method in your code with the given variable. During code execution, the application will return the value of the variables specified inside the method in the console. This is the easiest way to check if the program returns the expected value.
Unfortunately, this is not a very effective method of debugging. Such an approach t does not allow us to see the progress of code execution (unless we insert console.log every few lines, but then the amount of data thrown in the console will be unreadable and we will only make a mess in the code.) Furthermore, it returns only the passed variable, provided that the application does not throw an error while executing the code.
Tip no. 1
If you have many console.logs put the name in a string and the next variable, e.g., console.log(‘variable’, variable).
Chrome DevTools (Source Tab)
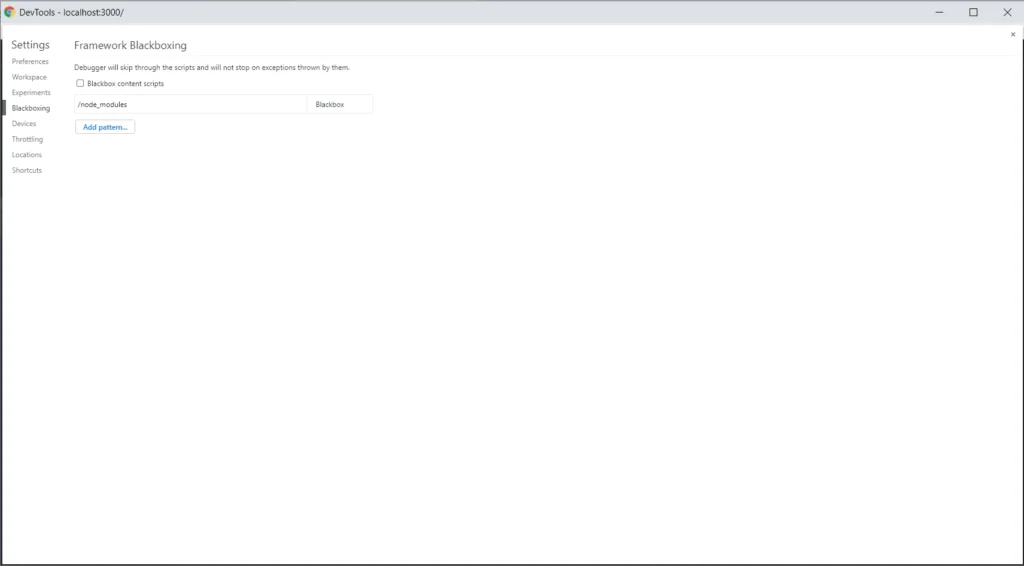
A more efficient method for debugging a web application is to use Chrome DevTools and Source Tab. Before we start debugging in the source tab, we need to add node_modules to black boxing. We add this rule so that when going through breakpoints it does not show us files from external packages, which makes debugging difficult. We need to open settings in Chrome → Blackboxing → Add patterns and then write there /node_modules .
When you add node_modules to black boxing we can go to the Source Tab. Let’s assume you want to follow in real time the process of your function, and check the outputs. Press Ctrl + O in the source tab, and enter a source file name. Then put the breakpoints on the lines of code that interest, you and you can start executing the process in your browser. When the lines you selected start processing, the browser will stop executing the code. See the screenshot below.
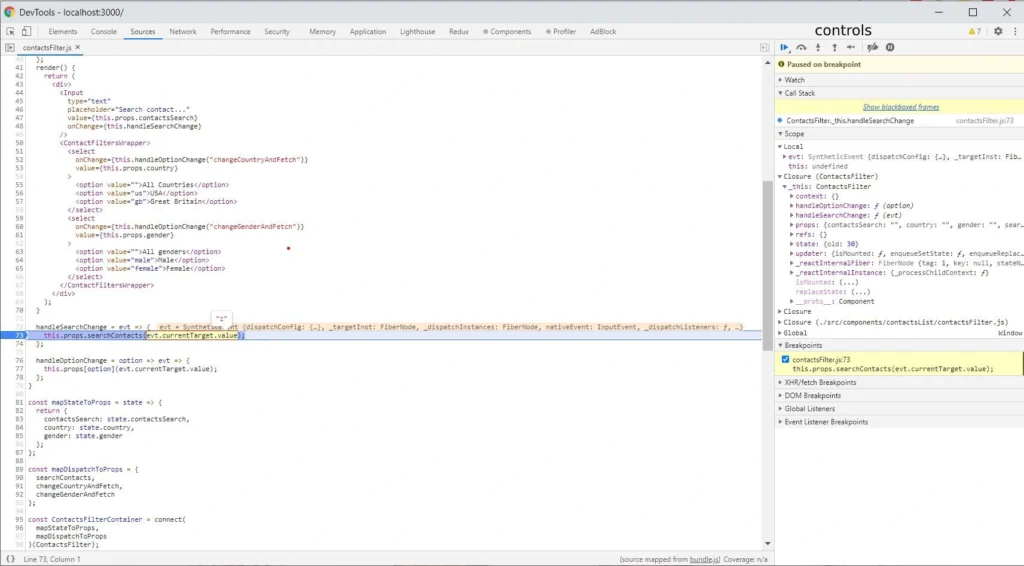
As you can see, the current line of code where the browser has stopped has a blue background. On the right side, there is a bar where our command center is located. Here is our brief introduction.
Controls
At the top of the bar, you have the controls section. Let's focus on the crucial elements. The first Resume control takes us to the next marked breakpoint within the scope of the code being executed. The second control Step over next function call takes us to the next line of the code being executed. The last Deactive breakpoints control deactivates the selected breakpoints. It’s a useful control when we have many breakpoints selected, and we want to go back to clicking through the application for a while without pausing at every breakpoint.
Scopes
We have a scopes section below. We have several types of scopes: local (the currently performed function), and closures depending on the scope in which we are (for example, the parent of the currently performed function or a component). In each of these scopes, the browser shows us all variables occurring in them.
Breakpoints
The last section discussed is breakpoints. It shows what breakpoints and in what files are marked. Using checkboxes, we can easily deactivate and reactivate them.
Tips no. 2-5
- If you use immutable.js in your project, install the Immutable.js Object Formatter plugin and activate it in browser settings. This will significantly simplify the debugging of immutable objects.
- If you do not use immutable.js in your project and you use Visual Studio Code as IDE, We strongly recommend installing and configuring Debugger for Chrome (VSC does not have an immutable.js formatting plugin). It simplifies debugging even further and allows for faster code changes.
- If the source tab doesn’t show your local files check the source map in your project.
- When the browser stops on a breakpoint you have access to variables also in the console.
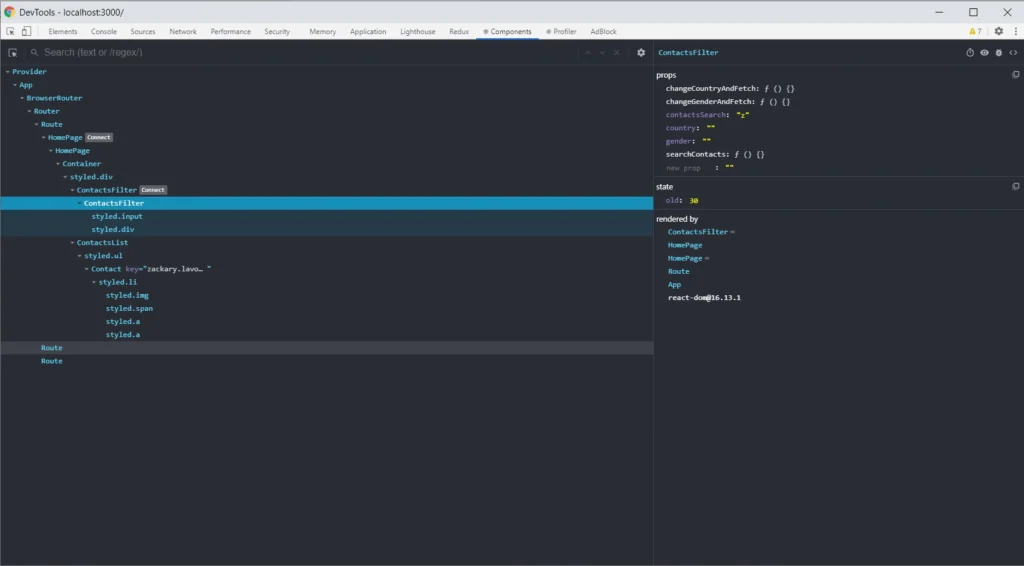
React Developer Tools
React Developer Tools are also helpful solutions. Such tools allow you to easily view the React tree structure in your project, the states, and props in the component. The Select an element in the page to inspect it function is powerful, especially when you don't know the whole project. It helps you find the component you need to update.
Tip no. 6
If you use Vue.js, you can use Vue.js devtools. The extension has similar functions and access to Vuex (the redux equivalent in react).
Redux DevTools
If you use Redux in your project, Redux DevTools is a must-have. Such a solution allows you to track the full flow of actions, status changes, payload, and view the current store after each action performed. If something does not work as we assume, and everything seems fine in the code, it is worth considering what actions are dispatching, with what payload. Sometimes there are simple mistakes like copying the constant from the above action, renaming without changing the value, and then calling something completely different. Below is a gif showing the most important Redux DevTools functions.
Tip no. 7
If your application runs a large number of actions, the extension may not function properly due to insufficient memory to process that many actions. You can try to configure it in the extension options (in this case, the maxAge option.)
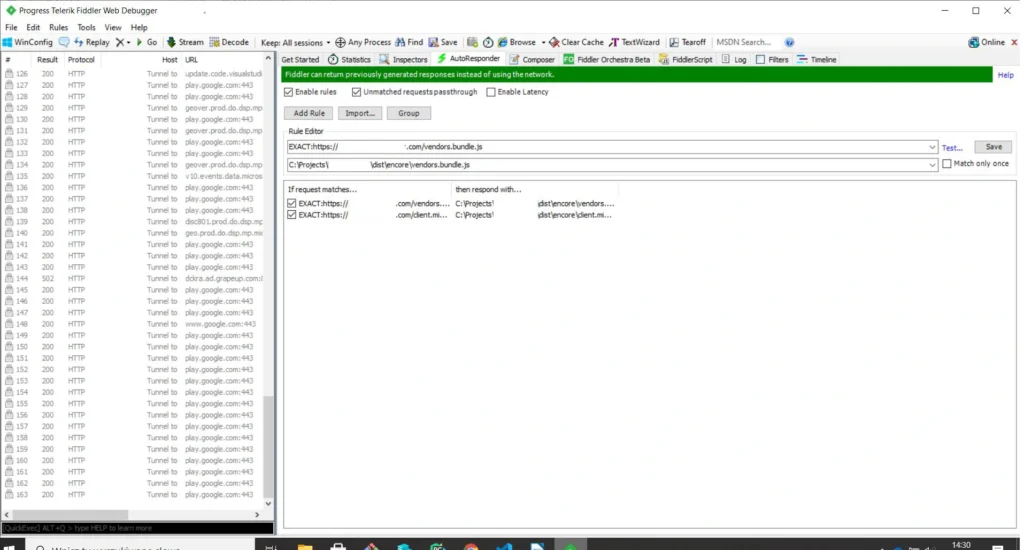
Fiddler
The last tool we would like to introduce is Fiddler . The tool was created to manage network traffic. It is extremely useful when we have some production bugs and we cannot copy the production data to a lower environment to debug locally. In such a situation, to have access to production data in the local environment, we set the traffic in the AutoResponder tab. When you open the page, instead of downloading the js file from the server, Fidler connects our locally built production file. Further debugging is done in the chrome dev tools source tab. Below is a screenshot with the setting to redirect traffic to the local file. The program also allows for mock endpoints.
Tip no. 8
If you want to create mocks of endpoints in an easy and fast way, you can use a mock moon program.
Summary of an agile debugging of a web application
For many of us, the process of debugging a web application is associated with a headache and long hours spent in front of the computer. However, this process can be shortened and made more pleasant if you have the right tools and know-how to use them. Often they are at your fingertips and for free. We shared with you the most important and useful tools that we use daily .

Connected car: Challenges and opportunities for the automotive industry
The development of connected car technology accelerated digital disruption in the automotive industry. Verified Market Research valued the connected car market at USD 72.68 billion in 2019 and projected its value to reach USD 215.23 billion by 2027. Along with the rapid growth of this market’s worth, we observe the constant development of new customer-centric services that goes far beyond driving experience.
While the development of connected car technology created a demand for connectivity solutions and drive-assistance systems, companies willing to build their position in this market have to face some significant challenges. This article is the first one of the mini-series that guides you through the main obstacles with building software for connected cars. We start with the basics of a connected vehicle, then dive into the details of prototyping and providing production-ready solutions. Finally, we analyze and predict the future of verticals associated with automotive-rental car enterprises, insurers, and mobility providers.
This series provides you with hands-on knowledge based on our experience in developing production-grade and cutting-edge software for the leading automotive and car rental enterprises. We share our insights and pointers to overcome recurring issues that happen to every software development team working with these technologies.
What is a Connected Car?
A Connected Car is a vehicle that can communicate bidirectionally with other systems outside the car , such as infrastructure, other vehicles, or home/office. Connected cars belong to the expanding environment of devices that comprise the Internet of Things landscape. As well as all devices that are connected to the internet, some functions of a vehicle can be managed remotely.
Along with that, IoT devices are valuable resources of data and information that enable further development of associated services. And while most car owners would describe it as the mobile application paired with a car that allows users to check the fuel level, open/close doors, control air conditioning, and, in some cases, start the ignition, this technology goes much further.
V2C - Vehicle to Cloud
Let’s focus on some real-case scenarios to showcase the capabilities of connected car technology. If a car is connected, it may also have a sat-nav system with a traffic monitoring feature that can alert a driver if there is a traffic jam in front of them and suggest an alternative route. Or maybe there is a storm at the upcoming route and navigation can warn the driver. How does it work?
That is mostly possible thanks to what we call V2C - Vehicle to Cloud communication. Utilizing the fact that a car is connected, and it is sending and gathering data, a driver may also try to find it, in case it was stolen. Telematics data is also helpful to understand the reasons behind an accident on the road - we can analyze what happened before the accident and what may have led to the event. The data can be also used for predictive maintenance, even if the rules managing the dates are changing dynamically.
While this seems just like a nice-to-have feature for the drivers, it allows car manufacturers to provide an extensive set of subscription-based features and functionalities for the end-users. The availability of services may depend on the current car state - location, temperature, and technical availability. As an example: during the winter, if the car is equipped with heated seats and the temperature drops under 0 Celsius, but the subscription for this feature expires, the infotainment can propose to buy the new one - which is more tempting when the user is at this time cold.
V2I - Vehicle to Infrastructure
A vehicle equipped with connected car technology is not limited to communicating only with the cloud. Such a car is capable of exchanging data and information with road infrastructure, and this functionality is called V2I - Vehicle to Infrastructure communication. A car processes information from infrastructure components - road signs, lane markings, traffic lights to support the driving experience by suggesting decision makings. In the next steps, V2I can provide drivers with information about traffic jams and free parking spots.
Currently, in Stuttgart, Germany, the city’s infrastructure provides the data live traffic lights data for vehicle manufacturers, so drivers can see not just what light is on, but how long they have to wait for the red light to switch to green again. This part of connected car technology can rapidly develop with the utilization of wireless communication and the digitalization of road infrastructure.
V2V - Vehicle to Vehicle
Another highly valuable type of communication provided by connected car technology is V2V - Vehicle to Vehicle. By developing an environment in which numerous cars are able to wirelessly exchange data, the automotive industry offers a new experience - every vehicle can use the information provided by a car belonging to the network, which leads to more effective communication covering traffic, car parking, alternative routes, issues on the road, or even some worth-seeing spots.
It may also significantly increase safety on the road, when one car notifies another that drives a few hundred meters behind him that it just had a hard breaking or that the road surface is slippery, using the information from ABS, ESP, or TC systems. That has not just an informational value but is also used for Adaptive Cruise Control or Travel Assist systems and reduces the speed of vehicles automatically increasing the safety of the travelers. V2V communication makes use of network and scale effects - the more users have connected to the network, the more helpful and complete information the network provides.
The list of use cases for connected car technology is only limited by our imagination but is excelling rapidly as many teams are joining the movement aiming to transform the way we travel and communicate. The Connected Car revolution leads to many changes and impacts both user experience and business models of the associated industries.
How connected car technology impacts business models of the automotive industry
Connected cars bring innovative solutions to the whole environment comprising the automotive landscape. Original Equipment Manufacturers (OEMs) have gained new revenue streams. Now vehicles allow their users to access stores and purchase numerous features and associated services that enhance customer experience, such as infotainment systems. By delivering aftermarket services directly to a car, the automotive industry monetizes new channels. Furthermore, these systems enable automakers to deliver advertisements, which become an increasing source of revenue.
The development of new technology in automotive creates a similar change as we observed in the mobile phone market. When smartphones equipped with operating systems had become a new normal, significantly increased the number of new apps that now allow their users to manage numerous services and tasks using the device.
But it is just an introduction to numerous business opportunities provided by connected cars. Since data has become a new competitive advantage that fuels the digital economy, collecting and distributing data about user behavior and vehicle performance is seen as highly profitable, especially when taking into account the potential interest of insurers providers.
Assembled data while used properly gives OEMs powerful insights into customer behavior that should lead to the rapid growth of new technologies and products improving customer experiences, such as predictive maintenance or fleet management.
The architecture behind connected car technology
Automotive companies utilize data from vehicle sensors and allow 3rd party providers to access their systems through dedicated API layers. Let’s dive into such architecture.
High-Level Architecture
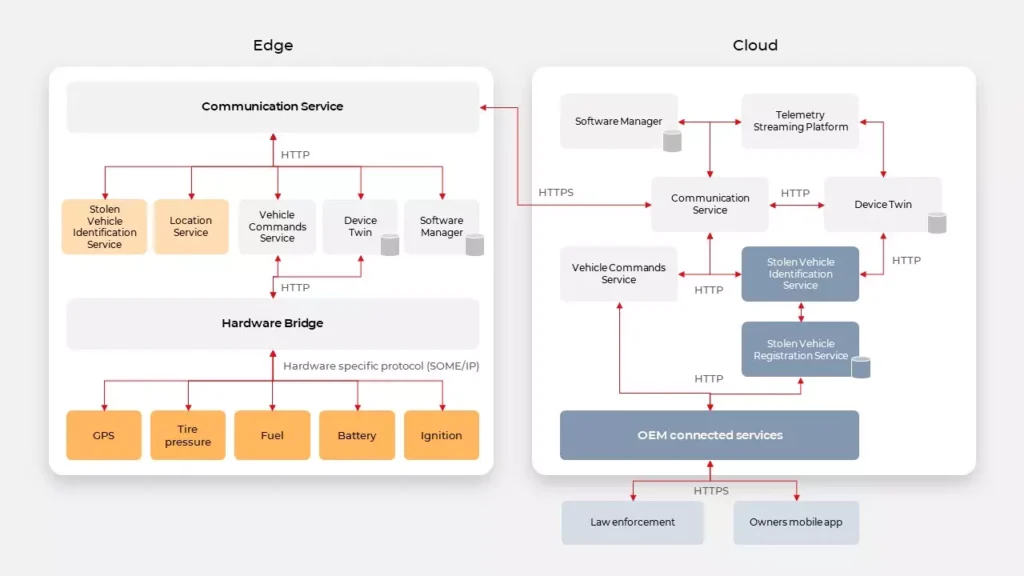
System components
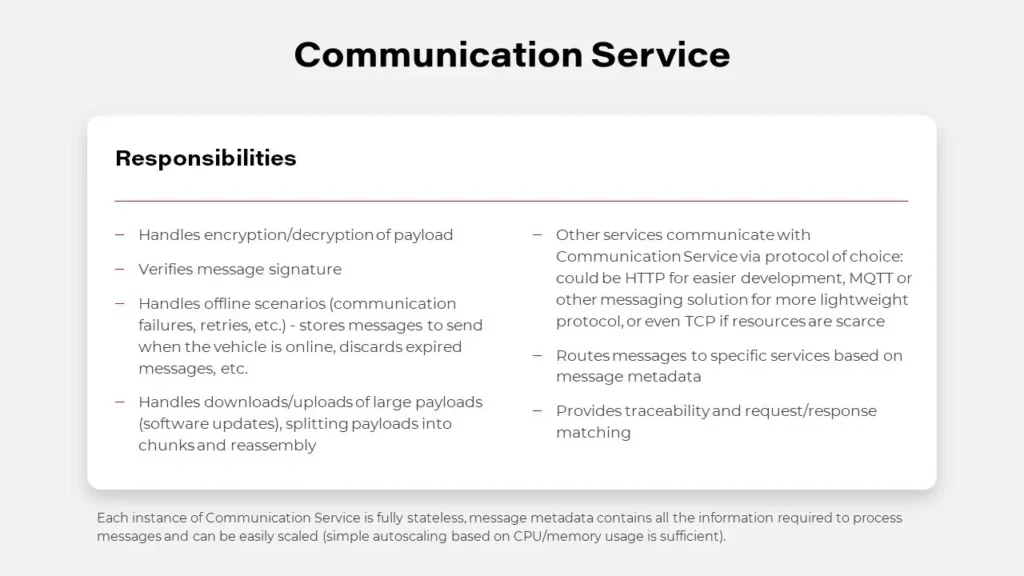
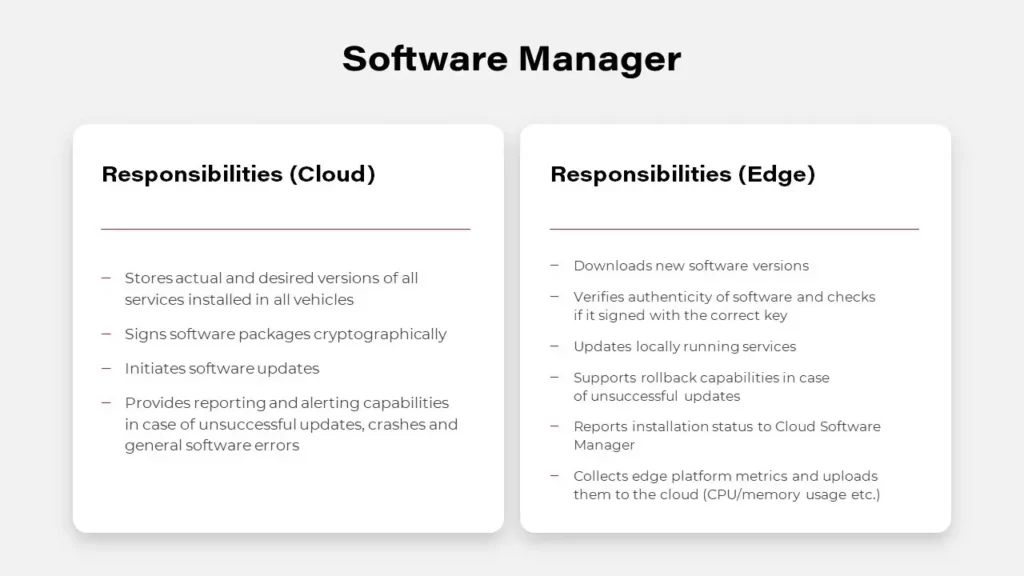

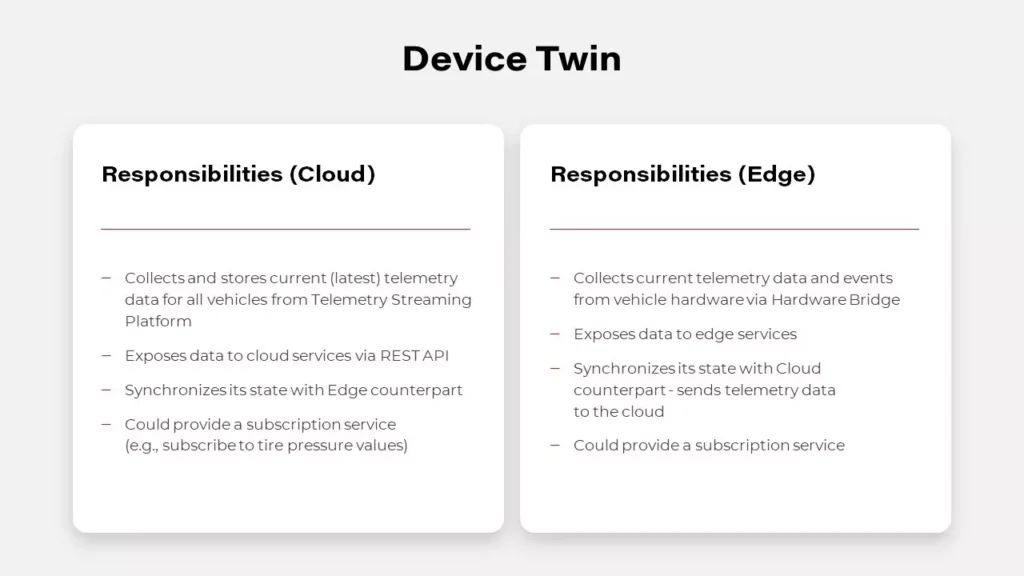
Digital Twin in automotive
A digital twin is a virtual replica and software representation of a product, system, or process. This concept is being adopted and developed in the automotive industry, as carmakers utilize its powerful capabilities to increase customer satisfaction, improve the way they develop vehicles and their systems, and innovate. A digital twin empowers automotive companies to collect various information from numerous sensors, as this tool allows to capture operational and behavioral data generated by a vehicle. Equipped with these insights, the leading automotive enterprises work on enhancing performance and customize user experience, but meanwhile, they have to tackle significant challenges.
First of all, getting data from vehicles is problematic. Hardware built-in vehicles have particular limits, which leads to reduced capabilities in providing software. Unlike software, once shipped hardware cannot be easily adjusted to the changing conditions and works for several years at least. Furthermore, while willing to deliver a customer-centric experience, automakers still have to protect their users from numerous threats. To protect vehicles from denial of service attacks, vehicles can throttle the number of requests. Overall, it’s a good idea but can have a terrible impact when multiple applications are trying to get data from vehicles, e.g., in the rental domain. This complex problem can be simply solved by Digital Twin. It can expose data to all applications without them needing to connect to the vehicle by simply gathering all real-time vehicle data in the cloud.
Implementation of this pattern is possible by using NoSQL databases like MongoDB or Cassandra and reliable communication layers, examples are described below. Digital Twin may be implemented in two possible ways, uni- or bidirectional.
Unidirectional Digital Twin
Unidirectional Digital Twin is saving only values received from the vehicle, in case of conflict it resolves the situation based on event timestamp. However, it doesn’t mean that the event causing the conflict is discarded and lost, usually every event is sent to the data platform. The data platform is a useful concept for data analysis and became handy when implementing complex use cases like analyzing driver habits.
Bidirectional Digital Twin
The Bidirectional Digital Twin design is based on the concept of the current and desired state. The vehicle is reporting the current state to the platform, and on the other hand, the platform is trying to change the state in the vehicle to the desired value. In this situation, in case of conflict, not only the timestamp matters as some operations from the cloud may not be applied to the vehicle in every state, eg., the engine can’t be disabled when the vehicle is moving.
However, meeting the goal of developing a Digital Twin may be tricky though as it all depends on the OEM and provided API. Sometimes it doesn’t expose enough properties or doesn’t provide real-time updates. In such cases, it may be even impossible to implement this pattern.
API
At first, designing a Connected Car API isn’t different from designing an API for any other backend system. It should start with an in-depth analysis of a domain, in this case, automotive. Then user stories should be written down, and with that, the development team should be able to find common parts and requirements to be able to determine the most suitable communication protocol. There are a lot of possible solutions to choose from. There are several reliable and high-traffic oriented message brokers like Kafka or hosted solutions AWS Kinesis. However, the simplest solution based on HTTP can also handle the most complex cases when used with Server-Sent Events or WebSockets. When designing API for mobile applications, we should also consider implementing push notifications for a better user experience.
When designing API in the IoT ecosystem, you can’t rely too much on your connection with edge devices. There are a lot of connectivity challenges, for example, a weak cellular range. You can’t guarantee when your command to a car will be delivered, and if a car will respond in milliseconds or even at all. One of the best patterns here is to provide the asynchronous API. It doesn’t matter on which layer you’re building your software if it’s a connector between vehicle and cloud or a system communicating with the vehicle’s API provider. Asynchronous API allows you to limit your resource consumption and avoid timeouts that leave systems in an unknown state. It’s a good practice to include a connector, the logic which handles all connection flaws. Well designed and developed connectors should be responsible for retries, throttling, batching, and caching of request and response.
OEM’s are now implementing a unified API concept that enables its customers to communicate with their cars through the cloud at the same quality level as when they use direct connections (for example using Wi-Fi). This means that the developer sees no difference in communicating with the car directly or using the cloud. What‘s also worth noting: the unified API works well with the Digital Twin concept, which leads to cuts in communication with the vehicle as third-party apps are able to connect with the services in the cloud instead of communicating directly with an in-car software component.
What’s next for connected car technology
Once the challenges become tackled, connected vehicles provide automakers and adjacent industries with a chance to establish beneficial co-operations, build new revenue streams, or even create completely new business models. The possibilities delivered thanks to over-the-air communication (OTA) allowing to send fixes, updates, and upgrades to already sold cars, provide new monetization channels, and sustain customer relationships.
As previously mentioned, the global connected car market is projected to reach USD 215.23 billion by 2027. To acquire shares in this market, automotive companies are determined to adjust their processes and operations. Among key factors that impact the development of connected car technology, we can point out a few crucial. The average lifecycle of a car is about 10 years. Today, automakers make decisions regarding connected cars that will go into production two to four years from now. For the cellular connectivity strategy to remain relevant over 12 to 15 years, significant challenges and assumptions need to be collaboratively addressed by OEMs, telematics control unit suppliers, and service providers.
Automakers must manage software in the field reliably, cost-efficiently, and, most importantly, securely – not just patch fixes, but also continually upgrade and enhance the functionality. The availability of OTA updates reduces the burden on dealerships and certified repair centers but requires better and more extensive testing, as the breakage of critical features is not an option.
Cellular solutions need to be agile to be compatible with emerging network technologies over the vehicle lifetime, e.g., 5G to be the industry standard in the next few years. The chosen solution must deliver reliable, seamless, uninterrupted coverage in all countries and markets where the vehicles are sold and driven.
Solution developers must offer scalable, cost-effective ways to develop upgradeable software that can be universally deployed across technologies, hardware, and chipsets. A huge focus must be put on testing the changes automatically on both the cloud platform side and the vehicle side.
As Connected Vehicles proliferate, the auto industry will need to adapt and transform itself into the growing technological dependency. OEMs and Tier-1 manufacturers must partner with technology specialists to thrive in an era of software-defined vehicles. As connectivity requires skills and capabilities outside of the OEMs’ domain, automakers will necessarily have to be software developers. An open platform environment will go a long way to encourage external developers to design apps for vehicle connectivity platforms.

How to build hypermedia API with Spring HATEOAS
Have you ever considered the quality of your REST API? Do you know that there are several levels of REST API? Have you ever heard the term HATEOAS? Or maybe you wonder how to implement it in Java? In this article, we answer these questions with the main emphasis on the HATEOAS concept and the implementation of that concept with the Spring HATEOAS project.
Learn more about services provided by Grape Up
You are at Grape Up blog, where our experts share their expertise gathered in projects delivered for top enterprises. See how we work.
Enabling the automotive industry to build software-defined vehicles
Empowering insurers to create insurance telematics platforms
Providing AI & advanced analytics consulting
What is HATEOAS?
H ypermedia A s T he E ngine O f A pplication S tate - is one of the constraints of the REST architecture. Neither REST nor HATEOAS is any requirement or specification. How you implement it depends only on you. At this point, you may ask yourself - how RESTful your API is without using HATEOAS? This question is answered by the REST maturity model presented by Leonard Richardson. This model consists of four levels, as set out below:
- Level 0
The API implementation uses the HTTP protocol but does not utilize its full capabilities. Additionally, unique addresses for resources are not provided. - Level 1
We have a unique identifier for the resource, but each action on the resource has its own URL. - Level 2
We use HTTP methods instead of verbs describing actions, e.g., DELETE method instead of URL .../delete - Level 3
The term HATEOAS has been introduced. Simply speaking, it introduces hypermedia to resources. That allows you to place links in the response informing about possible actions, thereby adding the possibility to navigate through API.
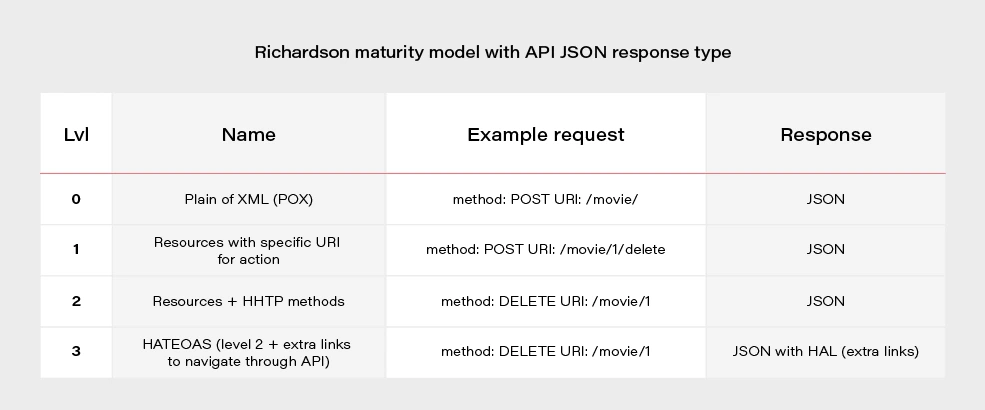
Most projects these days are written using level 2. If we would like to go for the perfect RESTful API, we should consider HATEOAS.
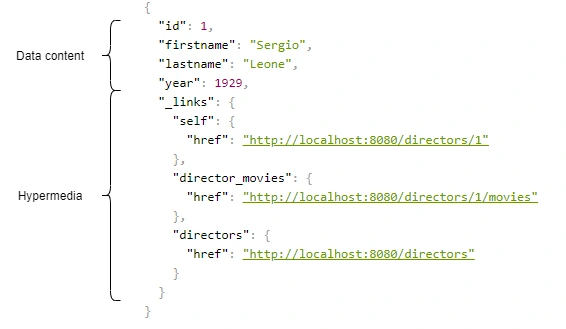
Above, we have an example of a response from the server in the form of JSON+HAL. Such a resource consists of two parts: our data and links to actions that are possible to be performed on a given resource.
Spring HATEOAS 1.x.x
You may be asking yourself how to implement HATEOAS in Java? You can write your solution, but why reinvent the wheel? The right tool for this seems to be the Spring Hateoas project. It is a long-standing solution on the market because its origins date back to 2012, but in 2019 we had a version 1.0 release. Of course, this version introduced a few changes compared to 0.x. They will be discussed at the end of the article after presenting some examples of using this library so that you better understand what the differences between the two versions are. Let’s discuss the possibilities of the library based on a simple API that returns us a list of movies and related directors. Our domain looks like this:
@Entity
public class Movie {
@Id
@GeneratedValue
private Long id;
private String title;
private int year;
private Rating rating;
@ManyToOne
private Director director;
}
@Entity
public class Director {
@Id
@GeneratedValue
@Getter
private Long id;
@Getter
private String firstname;
@Getter
private String lastname;
@Getter
private int year;
@OneToMany(mappedBy = "director")
private Set<Movie> movies;
}
We can approach the implementation of HATEOAS in several ways. Three methods represented here are ranked from least to most recommended.
But first, we need to add some dependencies to our Spring Boot project:
<dependency>
<groupId>org.springframework.boot</groupId>
<artifactId>spring-boot-starter-hateoas</artifactId>
</dependency>
Ok, now we can consider implementation options.
Entity extends RepresentationModel with links directly in Controller class
Firstly, extend our entity models with RepresentationModel.
public class Movie extends RepresentationModel<Movie>
public class Director extends RepresentationModel<Director>
Then, add links to RepresentationModel within each controller. The example below returns all directors from the system. By adding two links to each director - to himself and to the entire collection. A link is also added to the collection. The key elements of this code are two methods with static imports:
-
linkTo() -
methodOn()
@GetMapping("/directors")
public ResponseEntity<CollectionModel<Director>> getAllDirectors() {
List<Director> directors = directorService.getAllDirectors();
directors.forEach(director -> {
director.add(linkTo(methodOn(DirectorController.class).getDirectorById(director.getId())).withSelfRel());
director.add(linkTo(methodOn(DirectorController.class).getDirectorMovies(director.getId())).withRel("directorMovies"));
});
Link allDirectorsLink = linkTo(methodOn(DirectorController.class).getAllDirectors()).withSelfRel());
return ResponseEntity.ok(CollectionModel.of(directors, allDirectorsLink));
}
This is the response we get after invoking such controller:
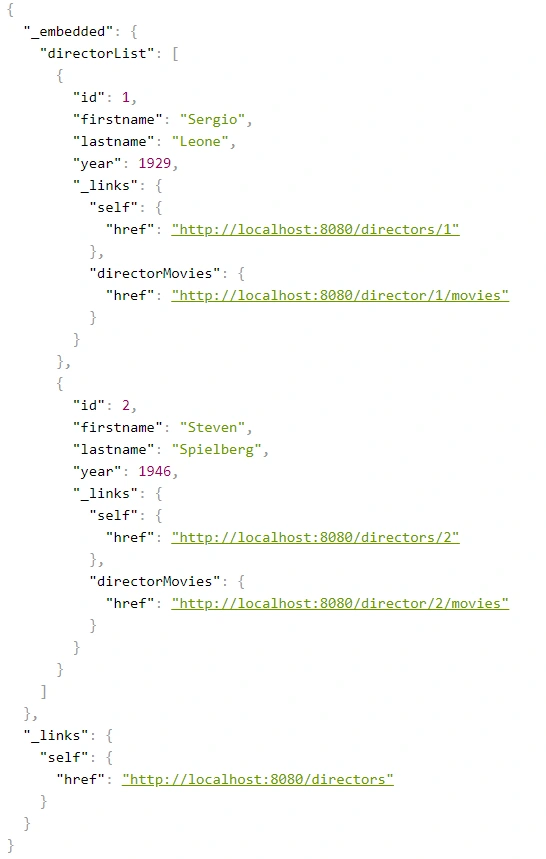
We can get a similar result when requesting a specific resource.
@GetMapping("/directors/{id}")
public ResponseEntity<Director> getDirector(@PathVariable("id") Long id) {
return directorService.getDirectorById(id)
.map(director -> {
director.add(linkTo(methodOn(DirectorController.class).getDirectorById(id)).withSelfRel());
director.add(linkTo(methodOn(DirectorController.class).getDirectorMovies(id)).withRel("directorMovies"));
director.add(linkTo(methodOn((DirectorController.class)).getAllDirectors()).withRel("directors"));
return ResponseEntity.ok(director);
})
.orElse(ResponseEntity.notFound().build());
}
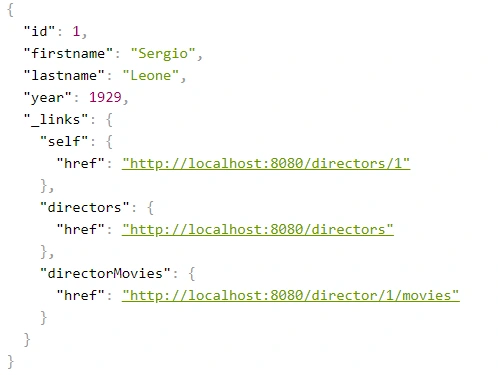
The main advantage of this implementation is simplicity. But making our entity dependent on an external library is not a very good idea. Plus, the code repetition for adding links for a specific resource is immediately noticeable. You can, of course, bring it to some private method, but there is a better way.
Use Assemblers - SimpleRepresentationModelAssembler
And it’s not about assembly language, but about a special kind of class that converts our resource to RepresentationModel.
One of such assemblers is SimpleRepresentationModelAssembler. Its implementation goes as follows:
@Component
public class DirectorAssembler implements SimpleRepresentationModelAssembler<Director> {
@Override
public void addLinks(EntityModel<Director> resource) {
Long directorId = resource.getContent().getId();
resource.add(linkTo(methodOn(DirectorController.class).getDirectorById(directorId)).withSelfRel());
resource.add(linkTo(methodOn(DirectorController.class).getDirectorMovies(directorId)).withRel("directorMovies"));
}
@Override
public void addLinks(CollectionModel<EntityModel<Director>> resources) {
resources.add(linkTo(methodOn(DirectorController.class).getAllDirectors()).withSelfRel());
}
}
In this case, our entity will be wrapped in an EnityModel (this class extends RepresentationModel ) to which the links specified by us in the addLinks() will be added. Here we overwrite two addLinks() methods - one for entire data collections and the other for single resources. Then, as part of the controller, it is enough to call the toModel() or toCollectionModel() method ( addLinks() are template methods here), depending on whether we return a collection or a single representation.
@GetMapping
public ResponseEntity<CollectionModel<EntityModel<Director>>> getAllDirectors() {
return ResponseEntity.ok(directorAssembler.toCollectionModel(directorService.getAllDirectors()));
}
@GetMapping(value = "directors/{id}")
public ResponseEntity<EntityModel<Director>> getDirectorById(@PathVariable("id") Long id) {
return directorService.getDirectorById(id)
.map(director -> {
EntityModel<Director> directorRepresentation = directorAssembler.toModel(director)
.add(linkTo(methodOn(DirectorController.class).getAllDirectors()).withRel("directors"));
return ResponseEntity.ok(directorRepresentation);
})
.orElse(ResponseEntity.notFound().build());
}
The main benefit of using the SimpleRepresentationModelAssembler is the separation of our entity from the RepresentationModel , as well as the separation of the adding link logic from the controller.
The problem arises when we want to add hypermedia to the nested elements of an object. Obtaining the effect, as in the example below, is impossible in a current way.
{
"id": "M0002",
"title": "Once Upon a Time in America",
"year": 1984,
"rating": "R",
"directors": [
{
"id": "D0001",
"firstname": "Sergio",
"lastname": "Leone",
"year": 1929,
"_links": {
"self": {
"href": "http://localhost:8080/directors/D0001"
}
}
}
],
"_links": {
"self": {
"href": "http://localhost:8080/movies/M0002"
}
}
}
Create DTO class with RepresentationModelAssembler
The solution to this problem is to combine the two previous methods, modifying them slightly. In our opinion, RepresentationModelAssembler offers the most possibilities. It removes the restrictions that arose in the case of nested elements for SimpleRepresentationModelAssembler . But it also requires more code from us because we need to prepare DTOs, which are often done anyway. This is the implementation based on RepresentationModelAssembler :
@Component
public class DirectorRepresentationAssembler implements RepresentationModelAssembler<Director, DirectorRepresentation> {
@Override
public DirectorRepresentation toModel(Director entity) {
DirectorRepresentation directorRepresentation = DirectorRepresentation.builder()
.id(entity.getId())
.firstname(entity.getFirstname())
.lastname(entity.getLastname())
.year(entity.getYear())
.build();
directorRepresentation.add(linkTo(methodOn(DirectorController.class).getDirectorById(directorRepresentation.getId())).withSelfRel());
directorRepresentation.add(linkTo(methodOn(DirectorController.class).getDirectorMovies(directorRepresentation.getId())).withRel("directorMovies"));
return directorRepresentation;
}
@Override
public CollectionModel<DirectorRepresentation> toCollectionModel(Iterable<? extends Director> entities) {
CollectionModel<DirectorRepresentation> directorRepresentations = RepresentationModelAssembler.super.toCollectionModel(entities);
directorRepresentations.add(linkTo(methodOn(DirectorController.class).getAllDirectors()).withSelfRel());
return directorRepresentations;
}
}
When it comes to controller methods, they look the same as for SimpleRepresentationModelAssembler , the only difference is that in the ResponseEntity the return type is DTO - DirectorRepresentation .
@GetMapping
public ResponseEntity<CollectionModel<DirectorRepresentation>> getAllDirectors() {
return ResponseEntity.ok(directorRepresentationAssembler.toCollectionModel(directorService.getAllDirectors()));
}
@GetMapping(value = "/{id}")
public ResponseEntity<DirectorRepresentation> getDirectorById(@PathVariable("id") String id) {
return directorService.getDirectorById(id)
.map(director -> {
DirectorRepresentation directorRepresentation = directorRepresentationAssembler.toModel(director)
.add(linkTo(methodOn(DirectorController.class).getAllDirectors()).withRel("directors"));
return ResponseEntity.ok(directorRepresentation);
})
.orElse(ResponseEntity.notFound().build());
}
Here is our DTO model:
@Builder
@Getter
@EqualsAndHashCode(callSuper = false)
@Relation(itemRelation = "director", collectionRelation = "directors")
public class DirectorRepresentation extends RepresentationModel<DirectorRepresentation> {
private final String id;
private final String firstname;
private final String lastname;
private final int year;
}
The @Relation annotation allows you to configure the relationship names to be used in the HAL representation. Without it, the relationship names match the class name and a suffix List for the collection.
By default, JSON+HAL looks like this:
{
"_embedded": {
"directorRepresentationList": [
…
]
},
"_links": {
…
}
}
However, annotation @Relation can change the name of directors :
{
"_embedded": {
"directors": [
…
]
},
"_links": {
…
}
}
Summarizing the HATEOAS concept, it consists of a few pros and cons.
Pros:
- If the client uses it, we can change the API address for our resources without breaking the client.
- Creates good self-documentation, and table of contents of API to the person who has the first contact with our API.
- Can simplify building some conditions on the frontend, e.g., whether the button should be disabled / enabled based on whether the link to corresponding the action exists.
- Less coupling between frontend and backend.
- Just like writing tests imposes on us to stick to the SRP principle in class construction, HATEOAS can keep us in check when designing API.
Cons:
- Additional work needed on implementing non-business functionality.
- Additional network overhead. The size of the transferred data is larger.
- Adding links to some resources can be sometimes complicated and can introduce mess in controllers.
Changes in Spring HATEOAS 1.0
Spring HATEOAS has been available since 2012, but the first release of version 1.0 was in 2019.
The main changes concerned the changes to the package paths and names of some classes, e.g.
Old New ResourceSupport RepresentationModel Resource EntityModel Resources CollectionModel PagedResources PagedModel ResourceAssembler RepresentationModelAssembler
It is worth paying attention to a certain naming convention - the replacement of the word Resource in class names with the word Representation . It occurred because these types do not represent resources but representations, which can be enriched with hypermedia. It is also more in the spirit of REST. We are returning the resource representations, not the resources themselves. In the new version, there is a tendency to move away from constructors in favor of static construction methods - .of() .
It is also worth mentioning that the old version has no equivalent for SimpleRepresentationModelAssembler . On the other hand, the ResourceAssembler interface has only the toResource() method (equivalent - toModel() ) and no equivalent for toCollectionModel() . Such a method is found in RepresentationModelAssembler and is the toModelCollection() method.
The creators of the library have also included a script that migrates old package paths and old class names to the new version. You can check it here .


Practical tips to testing React apps with Selenium
If you ever had to write some automation scripts for an app with the frontend part done in React and you used Selenium Webdriver to get it to work, you’ve probably noticed that those two do not always get along very well. Perhaps you had to ‘hack’ your way through the task, and you were desperately searching for solutions to help you finish the job. I’ve been there and done that – so now you don’t have to. If you’re looking for a bunch of tricks which you can learn and expand your automation testing skillset, you’ve definitely come to the right place. Below I’ll share with you several solutions to problems I’ve encountered in my experience with testing against React with Selenium . Code examples will be presented for Python binding.
They see me scrolling
First, let’s take a look at scrolling pages. To do that, the solution that often comes to mind in automation testing is using JavaScript. Since we’re using Python here, the first search result would probably suggest using something like this:
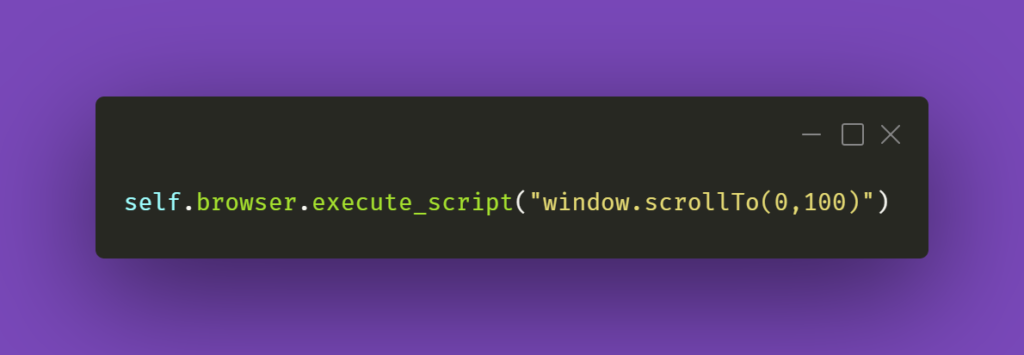
The first argument in the JS part is the number of pixels horizontally, and the second one is the number of pixels vertically. If we just paste window.scrollTo(0,100) into browsers’ console with some webpage opened, the result of the action will be scrolling the view vertically to the pixel position provided.
You could also try the below line of code:
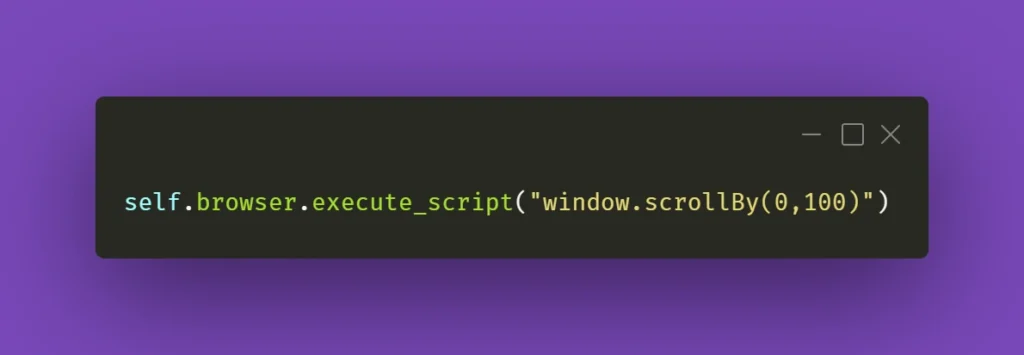
And again, you can see how it works by pasting window.scrollBy(0,100) into browsers’ console – the page will scroll down by the number of pixels provided. If you do this repeatedly, you’ll eventually reach the bottom of the page.
However, that might not always work wonders for you. Perhaps you do not want to scroll the whole page, but just a part of it – the scrollbars might be confusing, and when you think it’s the whole page you need to scroll, it might be just a portion of it. In that case, here’s what you need to do. First, locate the React element you want to scroll. Then, make sure it has an ID assigned to it. If not, do it yourself or ask your friendly neighborhood developer to do it for you. Then, all you have to do is write the following line of code:
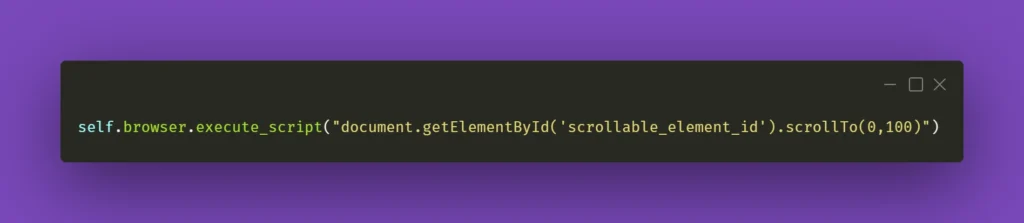
Obviously, don’t forget to change ‘scrollable_element_id’ to an ID of your element. That will perform a scroll action within the selected element to the position provided in arguments. Or, if needed, you can try .scrollBy instead of .scrollTo to get a consistent, repeatable scrolling action.
To finish off, you could also make a helper method out of it and call it whenever you need it:
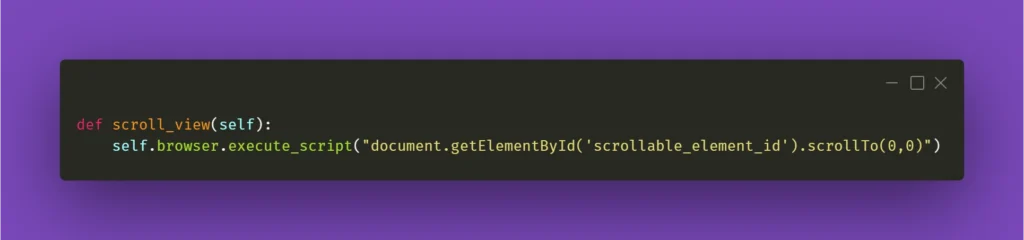
I’ll be mentioning the above method in the following paragraph, so please keep in mind what scroll_view is about.
Still haven’t found what you were looking for
Now that you have moved scrolling problems out of the way, locating elements and interacting with them on massive React pages should not bother you anymore, right? Well, not exactly. If you need to perform some action on an element that exists within a page, it has to be scrolled into view so you can work with it. And Selenium does not automatically do that. Let’s assume that you’re working on a web app that has various sub-pages, or tabs. Each of those tabs contains elements of a different sort but arranged in similar tables with search bars on top of each table at the beginning of the tab. Imagine the following scenario: you navigate to the first tab, scroll the view down, then navigate to the second tab, and you want to use the search bar at the top of the page. Sounds easy, doesn’t it?
What you need to be aware of is the React’s feature which does not always move the view to the top of the page after switching subpages of the app. In this case, to interact with the aforementioned search box you need to scroll the view to the starting position. That’s why scroll_view method in previous paragraph took (0,0) as .scrollTo arguments. You could use it before interacting with an element just to make sure it’s in the view and can be found by Selenium. Here’s an example:
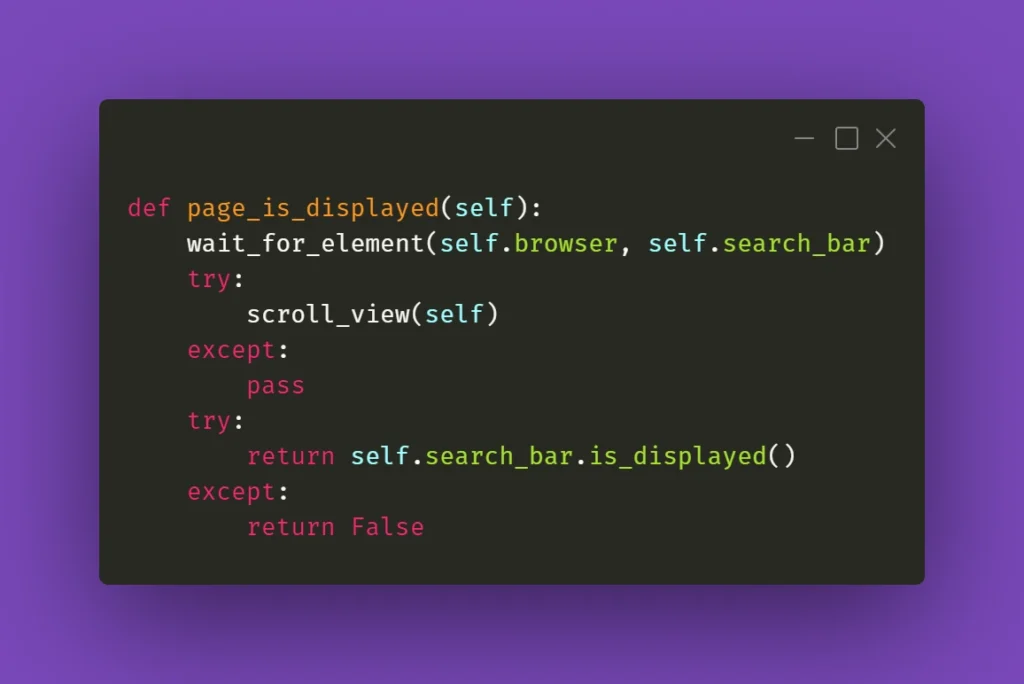
When it doesn’t click
Seems like a basic action like clicking on an element should be bulletproof and never fail. Yet again, miracles happen and if you’re losing your mind trying to find out what’s going on, remember that Selenium doesn’t always work great with React. If you have to deal with some stubborn element, such as a checkbox, for example, you could just simply make the code attempt the action several times:
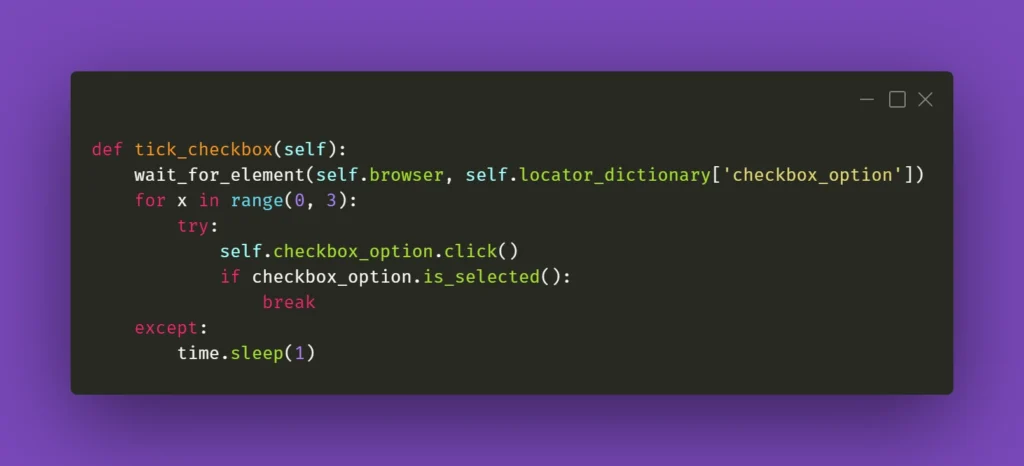
The key here is the if statement; it has to verify whether the requested action had actually taken place. In the above case, a checkbox is selected, and Selenium has a method for verifying that. In other situations, you could just provide a specific selector which applies to a particular element when it changes its state, eg., an Xpath similar to this:
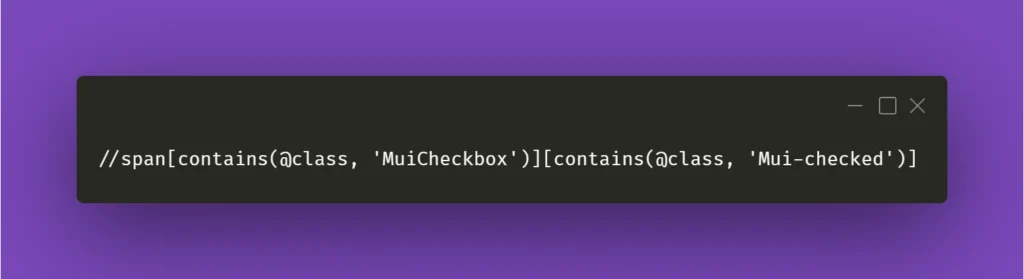
In the above example, Xpath contains generic Material-UI classes, but it could be anything as long as it points out the exact element you needed when it changed its state to whichever you wanted.
Clear situation
Testing often includes dealing with various forms that we need to fill and verify. Fortunately, Selenium’s send_keys() method usually does the job. But when it doesn’t, you could try clicking the text field before inputting the value:
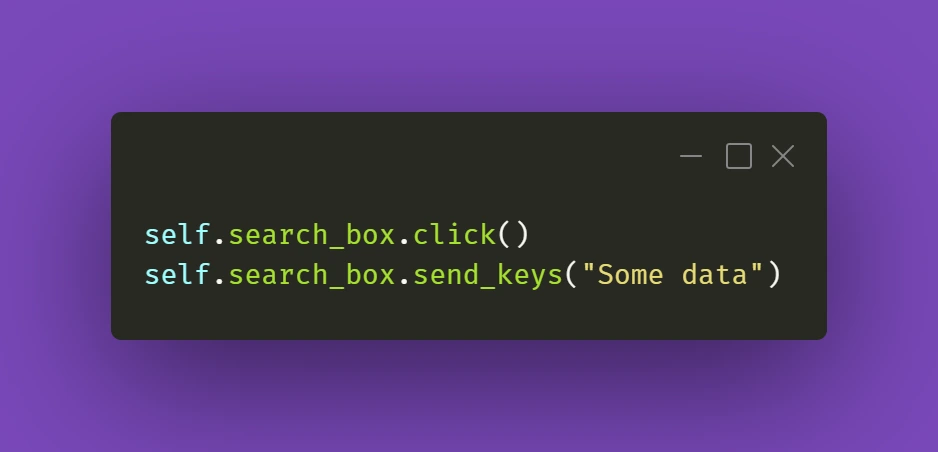
It's a simple thing to do, but we might sometimes have the tendency to forget about such trivial solutions. Anyway, it gets the job done.
The trickier part might actually be getting rid of data in already filled out forms. And Selenium's .clear() method doesn't cooperate as you would expect it to do. If getting the field into focus just like in the above example doesn't work out for you:
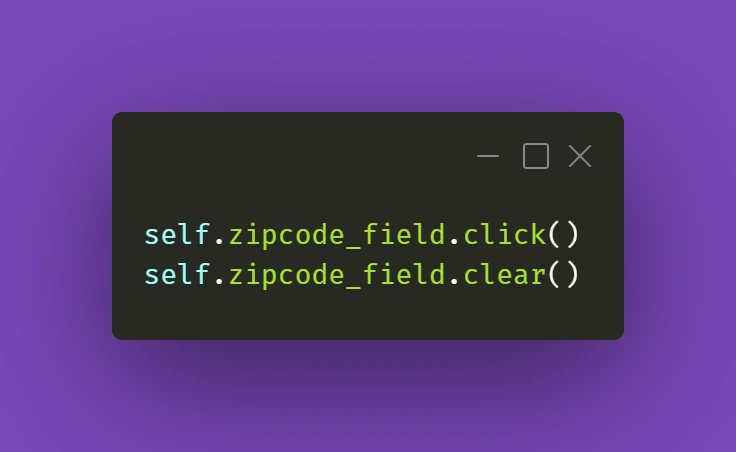
there is a solution that uses some JavaScript (again!). Just make sure your cursor is focused on the field you want to clear and use the following line:
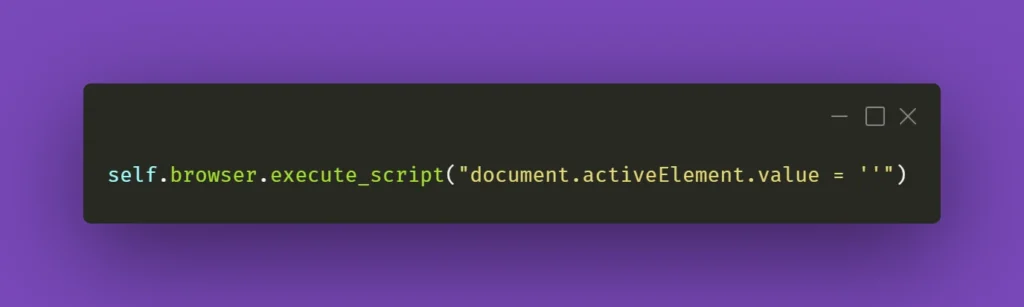
You can also wrap it into a nifty little helper as I did:
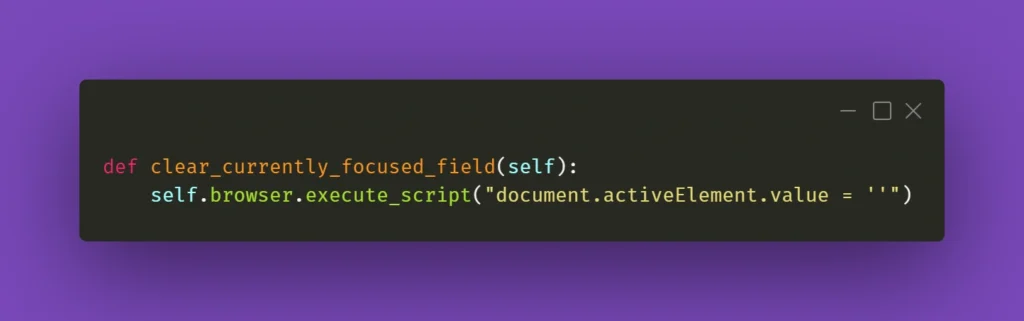
While this should work fine 99% of the time, there might be a situation with a stubborn text field where React quickly restores the previous value. What you can do in such a situation is experiment with sending an empty string to that field right after clearing it or sending some whitespace to it:
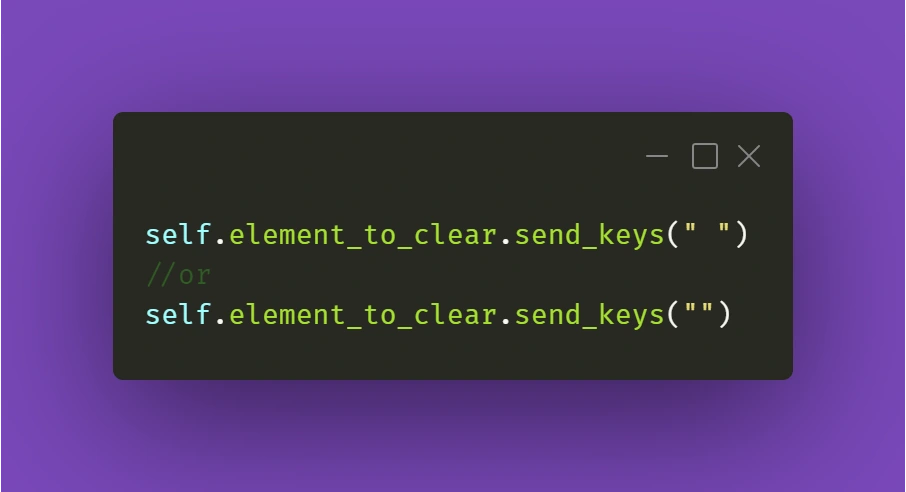
Just make sure it works for you!
Continuing the topic of the text in various fields, which sometimes have to be verified or checked after particular conditions are met, sometimes you need to make sure you're using the right method to extract the text value of an element. They might come in different forms, but the ones below are used quite often. Text in element could be extracted by Selenium with .get_attribute() method:
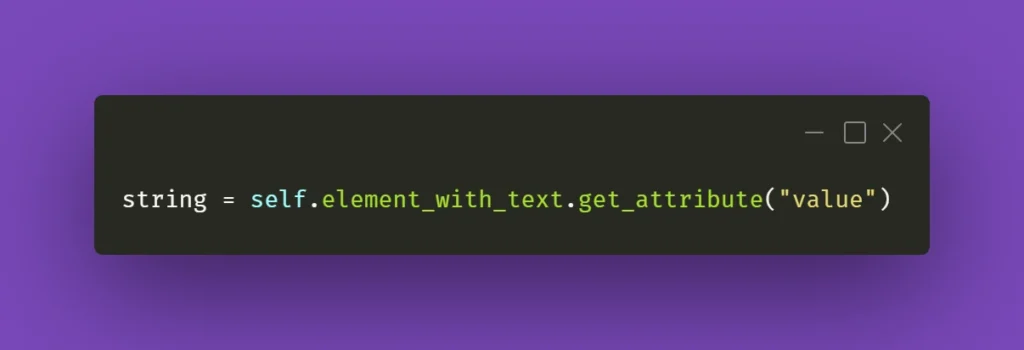
Or sometimes it's just enough to use .text() method:
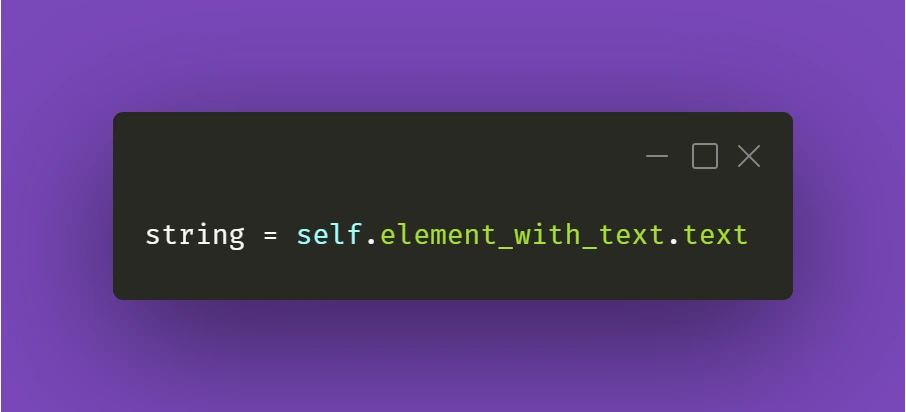
It all depends on the context and the element you're working with. So don't fall into the trap of assuming that all forms and elements in the app are exactly the same. Always check twice, you'll thank yourself for that, and in the end, you'll save tons of time!
React Apps - Keep on testing!
Hopefully, the tips and tricks I presented above will prove most useful for you in your testing projects. There's definitely more to share within the testing field, so make sure you stay tuned in for other articles on our blog!
How to run Selenium BDD tests in parallel with AWS Lambda - Lambda handlers
In our first article about Selenium BDD Tests in Parallel with AWS Lambda, we introduce parallelization in the Cloud and give you some insights into automating testing to accelerate your software development process. By getting familiar with the basics of Lambda Layers architecture and designing test sets, you are now ready to learn more about the Lambda handlers.
Lambda handlers
Now’s the time to run our tests on AWS. We need to create two Lambda handlers. The first one will find all scenarios from the test layer and run the second lambda in parallel for each scenario. In the end, it will generate one test report and upload it to the AWS S3 bucket.
Let’s start with the middle part. In order to connect to AWS, we need to use the boto3 library - AWS SDK for Python. It enables us to create, configure, and manage AWS services. We also import here behave __main__ function , which will be called to run behave tests from the code, not from the command line.
lambda/handler.py
import json
import logging
import os
from datetime import datetime
from subprocess import call
import boto3
from behave.__main__ import main as behave_main
REPORTS_BUCKET = 'aws-selenium-test-reports'
DATETIME_FORMAT = '%H:%M:%S'
logger = logging.getLogger()
logger.setLevel(logging.INFO)
def get_run_args(event, results_location):
test_location = f'/opt/{event["tc_name"]}'
run_args = [test_location]
if 'tags' in event.keys():
tags = event['tags'].split(' ')
for tag in tags:
run_args.append(f'-t {tag}')
run_args.append('-k')
run_args.append('-f allure_behave.formatter:AllureFormatter')
run_args.append('-o')
run_args.append(results_location)
run_args.append('-v')
run_args.append('--no-capture')
run_args.append('--logging-level')
run_args.append('DEBUG')
return run_args
What we also have above is setting arguments for our tests e.g., tags or feature file locations. But let's get to the point. Here is our Lambda handler code:
lambda/handler.py
def lambda_runner(event, context):
suffix = datetime.now().strftime(DATETIME_FORMAT)
results_location = f'/tmp/result_{suffix}'
run_args = get_run_args(event, results_location)
print(f'Running with args: {run_args}')
# behave -t @smoke -t ~@login -k -f allure_behave.formatter:AllureFormatter -o output --no-capture
try:
return_code = behave_main(run_args)
test_result = False if return_code == 1 else True
except Exception as e:
print(e)
test_result = False
response = {'test_result': test_result}
s3 = boto3.resource('s3')
for file in os.listdir(results_location):
if file.endswith('.json'):
s3.Bucket(REPORTS_BUCKET).upload_file(f'{results_location}/{file}', f'tmp_reports/{file}')
call(f'rm -rf {results_location}', shell=True)
return {
'statusCode': 200,
'body': json.dumps(response)
}
The lambda_runner method is executed with tags that are passed in the event. It will handle a feature file having a name from the event and at least one of those tags. At the end of a single test, we need to upload our results to the S3 bucket. The last thing is to return a Lambda result with a status code and a response from tests.
There’s a serverless file with a definition of max memory size, lambda timeout, used layers, and also some policies that allow us to upload the files into S3 or save the logs in CloudWatch.
lambda/serverless.yml
service: lambda-test-runner
app: lambda-test-runner
provider:
name: aws
runtime: python3.6
region: eu-central-1
memorySize: 512
timeout: 900
iamManagedPolicies:
- "arn:aws:iam::aws:policy/CloudWatchLogsFullAccess"
- "arn:aws:iam::aws:policy/AmazonS3FullAccess"
functions:
lambda_runner:
handler: handler.lambda_runner
events:
- http:
path: lambda_runner
method: get
layers:
- ${cf:lambda-selenium-layer-dev.SeleniumLayerExport}
- ${cf:lambda-selenium-layer-dev.ChromedriverLayerExport}
- ${cf:lambda-selenium-layer-dev.ChromeLayerExport}
- ${cf:lambda-tests-layer-dev.FeaturesLayerExport}
Now let’s go back to the first lambda function. There will be a little more here, so we'll go through it in batches. Firstly, imports and global variables. REPORTS_BUCKET should have the same value as it’s in the environment.py file (tests layer).
test_list/handler.py
import json
import logging
import os
import shutil
import subprocess
from concurrent.futures import ThreadPoolExecutor as PoolExecutor
from datetime import date, datetime
import boto3
from botocore.client import ClientError, Config
REPORTS_BUCKET = 'aws-selenium-test-reports'
SCREENSHOTS_FOLDER = 'failed_scenarios_screenshots/'
CURRENT_DATE = str(date.today())
REPORTS_FOLDER = 'tmp_reports/'
HISTORY_FOLDER = 'history/'
TMP_REPORTS_FOLDER = f'/tmp/{REPORTS_FOLDER}'
TMP_REPORTS_ALLURE_FOLDER = f'{TMP_REPORTS_FOLDER}Allure/'
TMP_REPORTS_ALLURE_HISTORY_FOLDER = f'{TMP_REPORTS_ALLURE_FOLDER}{HISTORY_FOLDER}'
REGION = 'eu-central-1'
logger = logging.getLogger()
logger.setLevel(logging.INFO)
There are some useful functions to avoid duplication and make the code more readable. The first one will find and return all .feature files which exist on the tests layer. Then we have a few functions that let us create a new AWS bucket or folder, remove it, upload reports, or download some files.
test_list/handler.py
def get_test_cases_list() -> list:
return [file for file in os.listdir('/opt') if file.endswith('.feature')]
def get_s3_resource():
return boto3.resource('s3')
def get_s3_client():
return boto3.client('s3', config=Config(read_timeout=900, connect_timeout=900, max_pool_connections=500))
def remove_s3_folder(folder_name: str):
s3 = get_s3_resource()
bucket = s3.Bucket(REPORTS_BUCKET)
bucket.objects.filter(Prefix=folder_name).delete()
def create_bucket(bucket_name: str):
client = get_s3_client()
try:
client.head_bucket(Bucket=bucket_name)
except ClientError:
location = {'LocationConstraint': REGION}
client.create_bucket(Bucket=bucket_name, CreateBucketConfiguration=location)
def create_folder(bucket_name: str, folder_name: str):
client = get_s3_client()
client.put_object(
Bucket=bucket_name,
Body='',
Key=folder_name
)
def create_sub_folder(bucket_name: str, folder_name: str, sub_folder_name: str):
client = get_s3_client()
client.put_object(
Bucket=bucket_name,
Body='',
Key=f'{folder_name}{sub_folder_name}'
)
def upload_html_report_to_s3(report_path: str):
s3 = get_s3_resource()
current_path = os.getcwd()
os.chdir('/tmp')
shutil.make_archive('report', 'zip', report_path)
s3.Bucket(REPORTS_BUCKET).upload_file('report.zip', f'report_{str(datetime.now())}.zip')
os.chdir(current_path)
def upload_report_history_to_s3():
s3 = get_s3_resource()
current_path = os.getcwd()
os.chdir(TMP_REPORTS_ALLURE_HISTORY_FOLDER)
for file in os.listdir(TMP_REPORTS_ALLURE_HISTORY_FOLDER):
if file.endswith('.json'):
s3.Bucket(REPORTS_BUCKET).upload_file(file, f'{HISTORY_FOLDER}{file}')
os.chdir(current_path)
def download_folder_from_bucket(bucket, dist, local='/tmp'):
s3 = get_s3_resource()
paginator = s3.meta.client.get_paginator('list_objects')
for result in paginator.paginate(Bucket=bucket, Delimiter='/', Prefix=dist):
if result.get('CommonPrefixes') is not None:
for subdir in result.get('CommonPrefixes'):
download_folder_from_bucket(subdir.get('Prefix'), bucket, local)
for file in result.get('Contents', []):
destination_pathname = os.path.join(local, file.get('Key'))
if not os.path.exists(os.path.dirname(destination_pathname)):
os.makedirs(os.path.dirname(destination_pathname))
if not file.get('Key').endswith('/'):
s3.meta.client.download_file(bucket, file.get('Key'), destination_pathname)
For that handler, we also need a serverless file. There’s one additional policy AWSLambdaExecute and some actions that are required to invoke another lambda.
test_list/serverless.yml
service: lambda-test-list
app: lambda-test-list
provider:
name: aws
runtime: python3.6
region: eu-central-1
memorySize: 512
timeout: 900
iamManagedPolicies:
- "arn:aws:iam::aws:policy/CloudWatchLogsFullAccess"
- "arn:aws:iam::aws:policy/AmazonS3FullAccess"
- "arn:aws:iam::aws:policy/AWSLambdaExecute"
iamRoleStatements:
- Effect: Allow
Action:
- lambda:InvokeAsync
- lambda:InvokeFunction
Resource:
- arn:aws:lambda:eu-central-1:*:*
functions:
lambda_test_list:
handler: handler.lambda_test_list
events:
- http:
path: lambda_test_list
method: get
layers:
- ${cf:lambda-tests-layer-dev.FeaturesLayerExport}
- ${cf:lambda-selenium-layer-dev.AllureLayerExport}
And the last part of this lambda - the handler. In the beginning, we need to get a list of all test cases. Then if the action is run_tests , we get the tags from the event. In order to save reports or screenshots, we must have a bucket and folders created. The invoke_test function will be executed concurrently by the PoolExecutor. This function invokes a lambda, which runs a test with a given feature name. Then it checks the result and adds it to the statistics so that we know how many tests failed and which ones.
In the end, we want to generate one Allure report. In order to do that, we need to download all .json reports, which were uploaded to the S3 bucket after each test. If we care about trends, we can also download data from the history folder. With the allure generate command and proper parameters, we are able to create a really good looking HTML report. But we can’t see it at this point. We’ll upload that report into the S3 bucket with a newly created history folder so that in the next test execution, we can compare the results. If there are no errors, our lambda will return some statistics and links after the process will end.
test_list/handler.py
def lambda_test_list(event, context):
test_cases = get_test_cases_list()
if event['action'] == 'run_tests':
tags = event['tags']
create_bucket(bucket_name=REPORTS_BUCKET)
create_folder(bucket_name=REPORTS_BUCKET, folder_name=SCREENSHOTS_FOLDER)
create_sub_folder(
bucket_name=REPORTS_BUCKET, folder_name=SCREENSHOTS_FOLDER, sub_folder_name=f'{CURRENT_DATE}/'
)
remove_s3_folder(folder_name=REPORTS_FOLDER)
create_folder(bucket_name=REPORTS_BUCKET, folder_name=REPORTS_FOLDER)
client = boto3.client(
'lambda',
region_name=REGION,
config=Config(read_timeout=900, connect_timeout=900, max_pool_connections=500)
)
stats = {'passed': 0, 'failed': 0, 'passed_tc': [], 'failed_tc': []}
def invoke_test(tc_name):
response = client.invoke(
FunctionName='lambda-test-runner-dev-lambda_runner',
InvocationType='RequestResponse',
LogType='Tail',
Payload=f'{{"tc_name": "{tc_name}", "tags": "{tags}"}}'
)
result_payload = json.loads(response['Payload'].read())
result_body = json.loads(result_payload['body'])
test_passed = bool(result_body['test_result'])
if test_passed:
stats['passed'] += 1
stats['passed_tc'].append(tc_name)
else:
stats['failed'] += 1
stats['failed_tc'].append(tc_name)
with PoolExecutor(max_workers=500) as executor:
for _ in executor.map(invoke_test, test_cases):
pass
try:
download_folder_from_bucket(bucket=REPORTS_BUCKET, dist=REPORTS_FOLDER)
download_folder_from_bucket(bucket=REPORTS_BUCKET, dist=HISTORY_FOLDER, local=TMP_REPORTS_FOLDER)
command_generate_allure_report = [
f'/opt/allure-2.10.0/bin/allure generate --clean {TMP_REPORTS_FOLDER} -o {TMP_REPORTS_ALLURE_FOLDER}'
]
subprocess.call(command_generate_allure_report, shell=True)
upload_html_report_to_s3(report_path=TMP_REPORTS_ALLURE_FOLDER)
upload_report_history_to_s3()
remove_s3_folder(REPORTS_FOLDER)
subprocess.call('rm -rf /tmp/*', shell=True)
except Exception as e:
print(f'Error when generating report: {e}')
return {
'Passed': stats['passed'],
'Failed': stats['failed'],
'Passed TC': stats['passed_tc'],
'Failed TC': stats['failed_tc'],
'Screenshots': f'https://s3.console.aws.amazon.com/s3/buckets/{REPORTS_BUCKET}/'
f'{SCREENSHOTS_FOLDER}{CURRENT_DATE}/',
'Reports': f'https://s3.console.aws.amazon.com/s3/buckets/{REPORTS_BUCKET}/'
}
else:
return test_cases
Once we have it all set, we need to deploy our code. This shouldn’t be difficult. Let’s open a command prompt in the selenium_layer directory and execute the serverless deploy command. When it’s finished, do the same thing in the ‘tests’ directory, lambda directory, and finally in the test_list directory. The order of deployment is important because they are dependent on each other.
When everything is set, let’s navigate to our test-list-lambda in the AWS console.
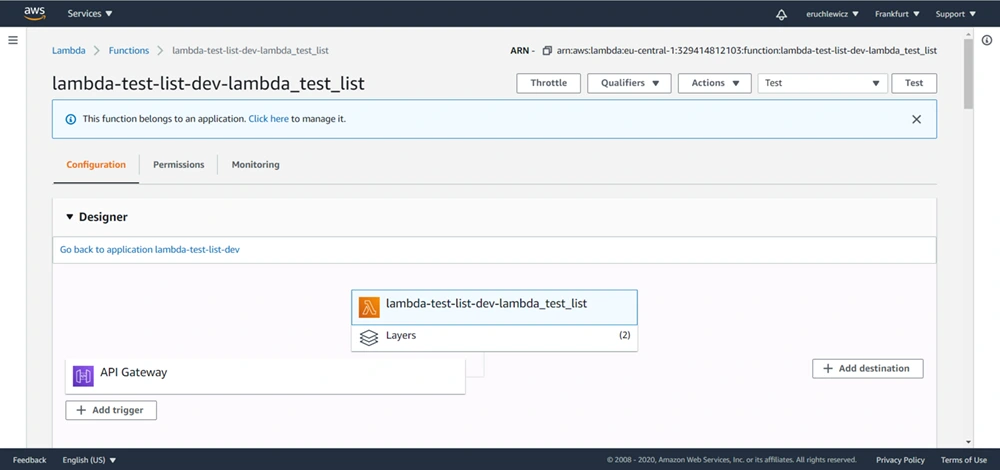
We need to create a new event. I already have three, the Test one is what we’re looking for. Click on the Configure test events option.
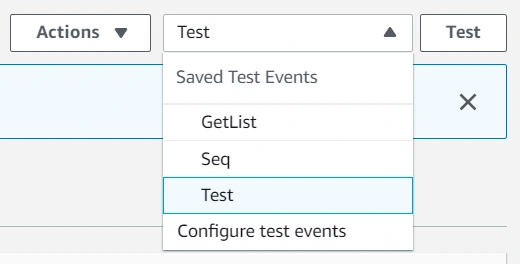
Then select an event template, an event name, and fill JSON. In the future, you can add more tags separated with a single space. Click Create to save that event.
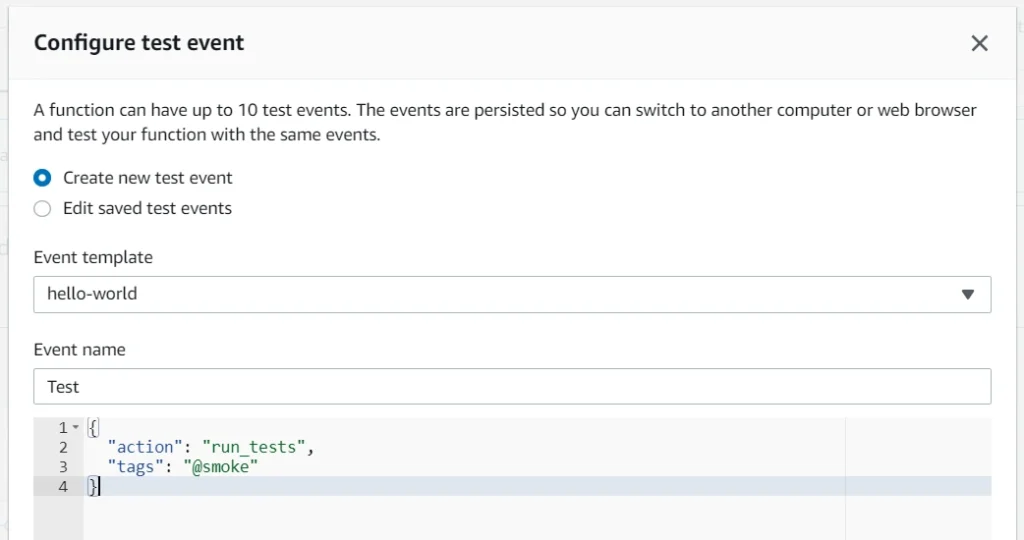
The last step is to click the Test button and wait for the results. In our case, it took almost one minute. The longest part of our solution is generating the Allure report when all tests are finished.
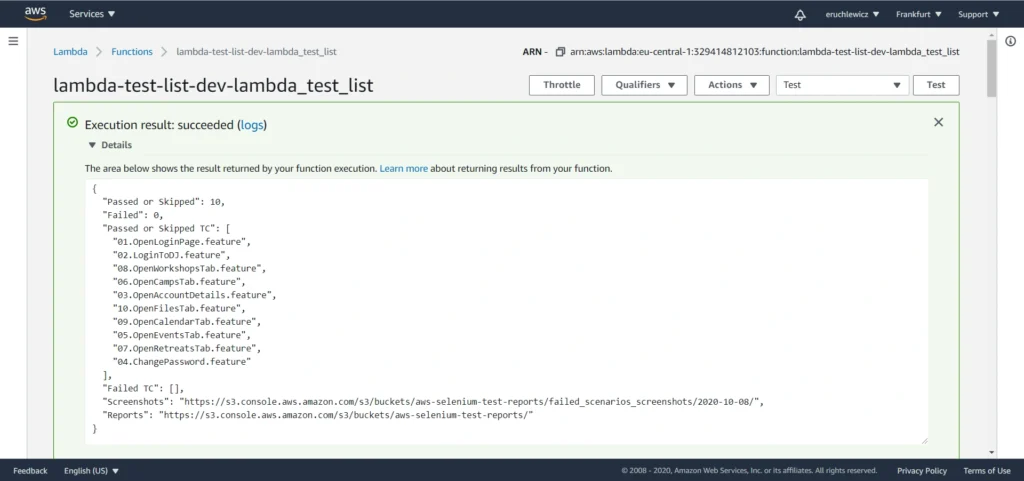
When you navigate to the reports bucket and download the latest one, you need to unpack the .zip file locally and open the index.html file in the browser. Unfortunately, most of the browsers won’t handle it that easily. If you have Allure installed, you can use the allure serve <path> command. It creates a local Jetty server instance, serves the generated report, and opens it in the default browser. But there’s also a workaround - Microsoft Edge. Just right-click on the index.html file and open it with that browser. It works!
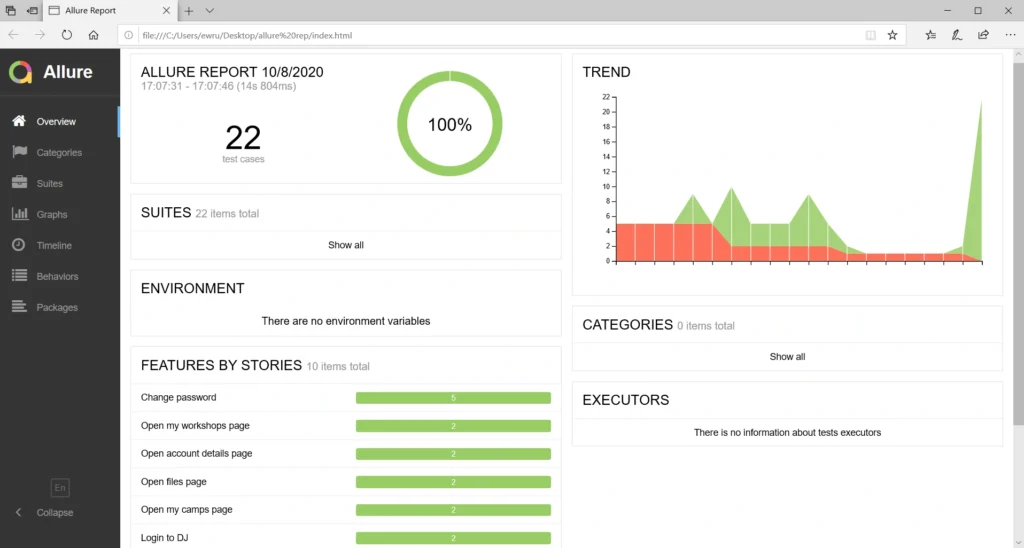
Statistics
Everybody knows that time is money. Let’s check how much we can save. Here we have a division into the duration of the tests themselves and the entire process.
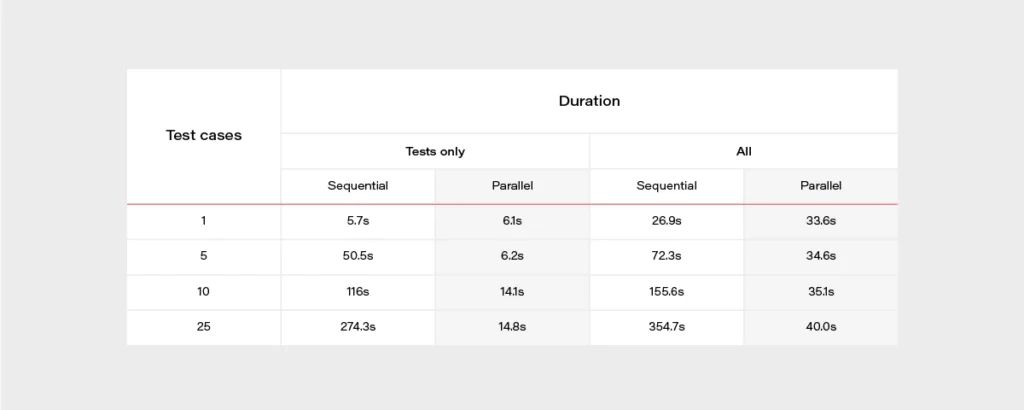
It’s really easy to find out that parallel tests are much faster. When having a set of 500 test cases, the difference is huge. It can take about 2 hours when running in a sequential approach or 2 minutes in parallel. The chart below may give a better overview.
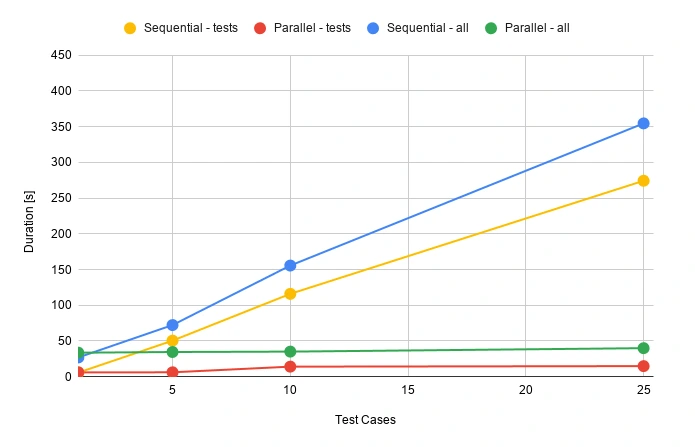
During the release, there’s usually not that much time for doing regression tests. Same with running tests that take several hours to complete. Parallel testing may speed up the whole release process.
Well, but what is the price for that convenience? Actually not that high.
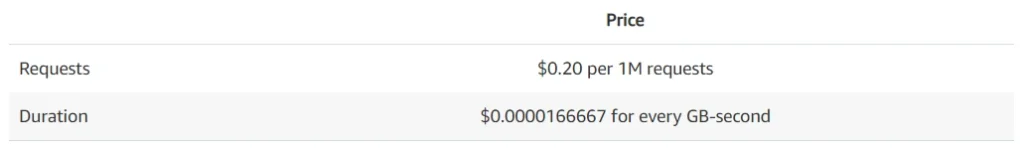
Let’s assume that we have 100 feature files, and it takes 30 seconds for each one to execute. We can set a 512MB memory size for our lambda function. Tests will be executed daily in the development environment and occasionally before releases. We can assume 50 executions of each test monthly.
Total compute (seconds) = 100 * 50 * (30s) = 150,000 seconds
Total compute (GB-s) = 150,000 * 512MB/1024 = 75,000 GB-s
Monthly compute charges = 75,000 * $0.00001667 = $1.25
Monthly request charges = 100 * 50 * $0.2/M = $0.01
Total = $1.26
It looks very promising. If you have more tests or they last longer, you can double this price. It’s still extremely low!
AWS Lambda handlers - summary
We went through quite an extended Selenium test configuration with Behave and Allure and made it work in the parallel process using AWS Lambda to achieve the shortest time waiting for results. Everything is ready to be used with your own app, just add some tests! Of course, there is still room for improvement - reports are now available in the AWS S3 bucket but could be attached to emails or served so that anybody can display them in a browser with a URL. You can also think of CI/CD practices. It's good to have continuous testing in the continuous integration process, e.g., when pushing some new changes to the main or release branch in your GIT repository in order to find all bugs as soon as possible. Hopefully, this article will help you with creating your custom testing process and speed up your work.
Sources

Introduction to Kubernetes security: Container security
Focusing on Kubernetes security, we have to go through container security and their runtimes. All in all, clusters without containers running does not make much sense. Hardening workloads often is much harder than hardening the cluster itself. Let’s start with container configuration.
Basic rules for containers
There are two ways how you can get a container image you want to run. You can build it, or you can use an existing one. If you create your own containers, then you have more control over the process and you have a clear vision of what is inside. But it is now your responsibility to make that image as secure as possible. There are plenty of rules to make your container safer, and here we share the best practices to ensure that.
Minimal image
First of all, if you want to start fast, you set some base images with plenty of features built-in. But in the end, it is not a good idea. The larger the base is, the more issues may occur. For example, the nginx image hosted on Docker Hub has 98 known vulnerabilities, and node has more than 800. All of those issues are inherited automatically by your container - unless you mitigate each one in your custom layers. Please take a look at the graph below that shows how the number of those vulnerabilities grows.
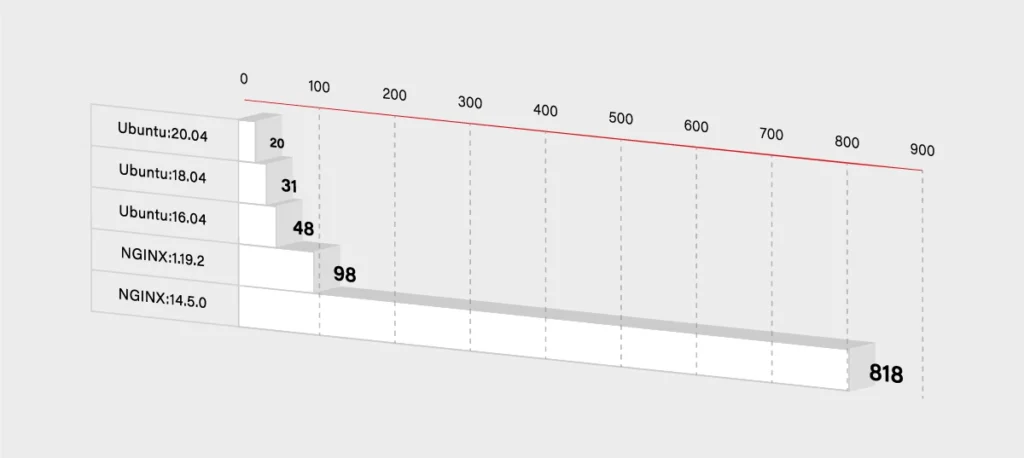
So you have to decide if you really need that additional functionality. If not, then you can use some smaller and simpler base images. It will, for sure, lower the number of known vulnerabilities in your container. It should lower the size of the container dramatically as well.
FROM node -> FROM ubuntu
If you really want only your application running in the container, then you can use Docker’s reserved, minimal image scratch:
FROM scratchCOPY hello /CMD [“/hello”]
User vs Root
Another base rule that you should embrace are the privileges inside the container. If you do not specify any, then it uses the root user inside the container. So there is a potential risk that it gets root access on the Docker host. To minimize that threat, you have to use a dedicated user/group in the Docker image. You can use the USER directive for this purpose:
FROM myslq
COPY . /app
RUN chown -R mysql:mysql /app
USER mysql
As you can see in the above example some images have an already defined user, that you can use. In mysql, it is named mysql (what a surprise!). But sometimes you may have to create one on your own:
RUN groupadd -r test && useradd -r -s /bin/false -g test test
WORKDIR /app
COPY . /app
RUN chown -R test:test /app
USER test
Use the specific tag for a base image
Another threat is not so obvious. You may think that the newest version of your base image will be the most secure one. In general, that is true, but it may bring some new risks and issues to your image. If you do not specify a proper version:
FROM ubuntu
Docker will use the latest one. It sounds pretty handy, but in some cases, it may break your build because the version may change between the builds. Just imagine that you are dependent on some package that has been removed in the latest version of the ubuntu image. Another threat is that the latest version may introduce new vulnerabilities that are not yet discovered. To avoid the described issues, it is better to specify the version of your base image:
FROM ubuntu:18.04
If the version is more specific, then there is a lower risk that it will be changed or updated without notice. On the other hand, please note that there is a higher chance that some specific versions will be removed. In that case, it is always a good practice to use the local Docker registry and keep important images mirrored there.
Also, check and keep in mind the versioning schema for the image - focusing on how alfa, beta, and test images are versioned. Being a test rat for the new features is not really what you would like to do.
See what is inside
The rules described above are only a part of a larger set but some of the most important ones. Especially if you create your own container image. But many times, you have to use images from other teams. It may happen when you simply want to run such an image, or you want to use it as a base image.
In both cases, you are at risk that this external image will bring a lot of issues to your application. If you are not a creator of the container image, then you have to pay even more attention to the security. First of all, you should check a Dockerfile to see how the image is built. Below is an example of the Ubuntu:18.04 image Dockerfile:
FROM scratch
ADD ubuntu-bionic-core-cloudimg-amd64-root.tar.gz /
# verify that the APT lists files do not exist
RUN [ -z "$(apt-get indextargets)" ]
# (see https://bugs.launchpad.net/cloud-images/+bug/1699913)
# a few minor docker-specific tweaks
# see https://github.com/docker/docker/blob/9a9fc01af8fb5d98b8eec0740716226fadb373...
RUN set -xe \
\
(...)
# make systemd-detect-virt return "docker"
# See: https://github.com/systemd/systemd/blob/aa0c34279ee40bce2f9681b496922dedbadfca...
RUN mkdir -p /run/systemd && echo 'docker' > /run/systemd/container
CMD ["/bin/bash"]
Unfortunately, a Dockerfile is often not available, and it is not integrated into the image. You have to use Docker inspect command in order to see what is inside:
$ docker inspect ubuntu:18.04
[
{
"Id": "sha256:d27b9ffc56677946e64c1dc85413006d8f27946eeb9505140b094bade0bfb0cc",
"RepoTags": [
"ubuntu:18.04"
],
"RepoDigests": [
"ubuntu@sha256:e5b0b89c846690afe2ce325ac6c6bc3d686219cfa82166fc75c812c1011f0803"
],
"Parent": "",
"Comment": "",
"Created": "2020-07-06T21:56:11.478320417Z",
(...)
"Config": {
"Hostname": "",
"Domainname": "",
"User": "",
"AttachStdin": false,
"AttachStdout": false,
"AttachStderr": false,
"Tty": false,
"OpenStdin": false,
"StdinOnce": false,
"Env": [
"PATH=/usr/local/sbin:/usr/local/bin:/usr/sbin:/usr/bin:/sbin:/bin"
],
"Cmd": [
"/bin/bash"
],
"ArgsEscaped": true,
"Image": "sha256:4f2a5734a710e5466a625e279994892c9dd9003d0504d99c8297b01b7138a663",
"Volumes": null,
"WorkingDir": "",
"Entrypoint": null,
"OnBuild": null,
"Labels": null
},
"Architecture": "amd64",
"Os": "linux",
"Size": 64228599,
"VirtualSize": 64228599,
(…)
}
]
It gives you all detailed information about the image in a JSON format, so you can review what is inside. Finally, you can use docker histor y to see the complete history of how the image was created.
$ docker history ubuntu:18.04 IMAGE CREATED CREATED BY SIZE d27b9ffc5667 13 days ago /bin/sh -c #(nop) CMD ["/bin/bash"] 0B <missing> 13 days ago /bin/sh -c mkdir -p /run/systemd && echo 'do… 7B <missing> 13 days ago /bin/sh -c set -xe && echo '#!/bin/sh' > /… 745B <missing> 13 days ago /bin/sh -c [ -z "$(apt-get indextargets)" ] 987kB <missing> 13 days ago /bin/sh -c #(nop) ADD file:0b40d881e3e00d68d… 63.2MB
So both commands give you the information similar to the Dockerfile content. But you have to admit that it is pretty complex and not very user-friendly. Fortunately, some tools might help you inspect Docker images. Start with checking out dive
It gives you a good view of each Docker image layer with information on what and where something has changed. The above example shows the layers of Ubuntu:18.04 image and corresponding changes to the files in that layer.
All those commands and tools should give you more confidence in order to decide whether it is safe to run a certain image.
Scan and sign
Usually, you do not have time to manually inspect images and check whether they are safe or not. Especially when you do not look for some malicious code but check for some well-known threats and vulnerabilities. This also applies when you build a container by yourself. In that case, you are probably sure that there is no malicious application or package installed, but still, you have to use some base image that may introduce some vulnerabilities. So again, there are multiple tools to help developers and operators check images.
The first two of them are focused on scanning images for Common Vulnerabilities and Exposures (CVE). All those scanners work pretty similarly – scanning images using external data with known vulnerabilities. It may come from OS vendors or non-OS data like NVD (National Vulnerability Database). Results in most cases, depend on the fact which CVE databases are used and if they are up-to-date. So the final number of detected vulnerabilities may differ for different tools. The scan process itself simply analyzes the contents and creates a history of an image with the mentioned databases.
Below are some results from open source tools Clair created by CoreOS and Trivy developed by Aquasec.
$ clair-scanner ubuntu:18.04
$ clair-scanner ubuntu:18.04
2020/07/22 10:10:02 [INFO] ▶ Start clair-scanner
2020/07/22 10:10:04 [INFO] ▶ Server listening on port 9279
2020/07/22 10:10:04 [INFO] ▶ Analyzing e86dffecb5a4284ee30b1905fef785336d438013826e4ee74a8fe7d65d95ee8f
2020/07/22 10:10:07 [INFO] ▶ Analyzing 7ff84cfee7ab786ad59579706ae939450d999e578c6c3a367112d6ab30b5b9b4
2020/07/22 10:10:07 [INFO] ▶ Analyzing 940667a71e178496a1794c59d07723a6f6716f398acade85b4673eb204156c79
2020/07/22 10:10:07 [INFO] ▶ Analyzing 22367c56cc00ec42fb1d0ca208772395cc3ea1e842fc5122ff568589e2c4e54e
2020/07/22 10:10:07 [WARN] ▶ Image [ubuntu:18.04] contains 39 total vulnerabilities
2020/07/22 10:10:07 [ERRO] ▶ Image [ubuntu:18.04] contains 39 unapproved vulnerabilities
+------------+-----------------------+-------+-------------------+--------------------------------------------------------------+
| STATUS | CVE SEVERITY | PKG | PACKAGE VERSION | CVE DESCRIPTION |
+------------+-----------------------+-------+-------------------+--------------------------------------------------------------+
(...)
+------------+-----------------------+-------+-------------------+--------------------------------------------------------------+
| Unapproved | Medium CVE-2020-10543 | perl | 5.26.1-6ubuntu0.3 | Perl before 5.30.3 on 32-bit platforms allows a heap-based |
| | | | | buffer overflow because nested regular expression |
| | | | | quantifiers have an integer overflow. An application |
| | | | | written in Perl would only be vulnerable to this flaw if |
| | | | | it evaluates regular expressions supplied by the attacker. |
| | | | | Evaluating regular expressions in this fashion is known |
| | | | | to be dangerous since the regular expression engine does |
| | | | | not protect against denial of service attacks in this |
| | | | | usage scenario. Additionally, the target system needs a |
| | | | | sufficient amount of memory to allocate partial expansions |
| | | | | of the nested quantifiers prior to the overflow occurring. |
| | | | | This requirement is unlikely to be met on 64bit systems.] |
| | | | | http://people.ubuntu.com/~ubuntu-security/cve/CVE-2020-10543 |
+------------+-----------------------+-------+-------------------+--------------------------------------------------------------+
| Unapproved | Medium CVE-2018-11236 | glibc | 2.27-3ubuntu1 | stdlib/canonicalize.c in the GNU C Library (aka glibc |
| | | | | or libc6) 2.27 and earlier, when processing very |
| | | | | long pathname arguments to the realpath function, |
| | | | | could encounter an integer overflow on 32-bit |
| | | | | architectures, leading to a stack-based buffer |
| | | | | overflow and, potentially, arbitrary code execution. |
| | | | | http://people.ubuntu.com/~ubuntu-security/cve/CVE-2018-11236 |
(...)
+------------+-----------------------+-------+-------------------+--------------------------------------------------------------+
| Unapproved | Low CVE-2019-18276 | bash | 4.4.18-2ubuntu1.2 | An issue was discovered in disable_priv_mode in shell.c |
| | | | | in GNU Bash through 5.0 patch 11. By default, if Bash is |
| | | | | run with its effective UID not equal to its real UID, it |
| | | | | will drop privileges by setting its effective UID to its |
| | | | | real UID. However, it does so incorrectly. On Linux and |
| | | | | other systems that support "saved UID" functionality, |
| | | | | the saved UID is not dropped. An attacker with command |
| | | | | execution in the shell can use "enable -f" for runtime |
| | | | | loading of a new builtin, which can be a shared object that |
| | | | | calls setuid() and therefore regains privileges. However, |
| | | | | binaries running with an effective UID of 0 are unaffected. |
| | | | | http://people.ubuntu.com/~ubuntu-security/cve/CVE-2019-18276 |
+------------+-----------------------+-------+-------------------+--------------------------------------------------------------+
As mentioned above, both results are subtly different, but it is okay. If you investigate issues reported by Trivy, you will see duplicates, and in the end, both results are the same. But it is not the rule, and usually, they differ.
Based on the above reports, you should be sure if it is safe to use that particular image or not. By inspecting the image, you ensure what is running there, and thanks to the scanner, you are guaranteed about any known CVE. But it is important to underline that those vulnerabilities have to be known. In case of some new threats, you should schedule a regular scan, e.g., every week. In some of the Docker registries, this can be very easily configured, or you can use your CI/CD to run scheduled pipelines. It is also a good idea to send some notification in case of any High Severity vulnerability is found.
Active image scanning
All the above methods are passive, which means they do not actively scan or verify a running container. It was just a static analysis and scan of the image. If you want to be super secure, then you can simply add this live runtime scanner. An example of such a tool is Falco . It is an open-source project started by SysDig and now developed as CNCF Incubating Project. An extremely useful advantage provided by Falco comes to scanning for any abnormal behavior in your container. Besides, it has a built-in analyzer for Kubernetes Audit events. So taking both features together, this is a quite powerful tool to analyze and keep an eye on running containers in real-time. Below there is a quick setup of Falco with the Kubernetes cluster.
First of all, you have to run Falco. You can, of course, deploy it on Kubernetes or use the standalone version. Per the documentation, the most secure way is to run it separated from the Kubernetes cluster to provide isolation in case of a hacker attack. For testing purposes, we will do it in a different way and deploy it onto Kubernetes using Helm .
The setup is quite simple. First, we have to add the helm repository with a falco chart and simply install it. Please note that nginx pod is used for testing purposes and is not a part of Falco.
$ helm repo add falcosecurity https://falcosecurity.github.io/charts
$ helm repo update
$ helm install falco falcosecurity/falco
$ kubectl get pods
NAME READY STATUS RESTARTS AGE
falco-qq8zx 1/1 Running 0 23m
falco-t5glj 1/1 Running 0 23m
falco-w2krg 1/1 Running 0 23m
nginx-6db489d4b7-6pvjg 1/1 Running 0 25m
And that is it. Now let’s test that. Falco comes with already predefined rules, so we can, for example, try to exec into some pod and view sensitive data from files. We will use the mentioned nginx pod.
$ kubectl exec -it nginx-6db489d4b7-6pvjg /bin/bash
root@nginx-6db489d4b7-6pvjg:/# echo "Knock, knock!"
Knock, knock!
root@nginx-6db489d4b7-6pvjg:/# cat /etc/shadow > /dev/null
root@nginx-6db489d4b7-6pvjg:/# exit
Now we should check the logs from the falco pod which runs on the same node as our nginx.
$ kubectl logs falco-w2krg
* Setting up /usr/src links from host
* Running falco-driver-loader with: driver=module, compile=y...
* Unloading falco module, if present
(...)
17:07:53.445726385: Notice A shell was spawned in a container with an attached terminal (user=root k8s.ns=default k8s.pod=nginx-6db489d4b7-6pvjg container=b17be5f70cdc shell=bash parent=runc cmdline=bash terminal=34816 container_id=b17be5f70cdc image=<NA>) k8s.ns=default k8s.pod=nginx-6db489d4b7-6pvjg container=b17be5f70cdc
17:08:39.377051667: Warning Sensitive file opened for reading by non-trusted program (user=root program=cat command=cat /etc/shadow file=/etc/shadow parent=bash gparent=<NA> ggparent=<NA> gggparent=<NA> container_id=b17be5f70cdc image=<NA>) k8s.ns=default k8s.pod=nginx-6db489d4b7-6pvjg container=b17be5f70cdc k8s.ns=default k8s.pod=nginx-6db489d4b7-6pvjg container=b17be5f70cdc
Great, there are nice log messages about exec and reading sensitive file incidents with some additional information. The good thing is that you can easily add your own rules.
$ cat custom_rule.yaml
customRules:
example-rules.yaml: |-
- rule: shell_in_container
desc: notice shell activity within a container
condition: container.id != host and proc.name = bash
output: TEST shell in a container (user=%user.name)
priority: WARNING
To apply them you have to update the helm chart again.
$ helm install falco -f custom_rule.yaml falcosecurity/falco
$ kubectl get pods
NAME READY STATUS RESTARTS AGE
falco-7qnn8 1/1 Running 0 6m21s
falco-c54nl 1/1 Running 0 6m3s
falco-k859g 1/1 Running 0 6m11s
nginx-6db489d4b7-6pvjg 1/1 Running 0 45m
Now we can repeat the procedure and see if there is something more in the logs.
$ kubectl exec -it nginx-6db489d4b7-6pvjg /bin/bash
root@nginx-6db489d4b7-6pvjg:/# echo "Knock, knock!"
Knock, knock!
root@nginx-6db489d4b7-6pvjg:/# cat /etc/shadow > /dev/null
root@nginx-6db489d4b7-6pvjg:/# exit
$ kubectl logs falco-7qnn8
* Setting up /usr/src links from host
* Running falco-driver-loader with: driver=module, compile=yes, download=yes
* Unloading falco module, if present
(...)
17:33:35.547831851: Notice A shell was spawned in a container with an attached terminal (user=root k8s.ns=default k8s.pod=nginx-6db489d4b7-6pvjg container=b17be5f70cdc shell=bash parent=runc cmdline=bash terminal=34816 container_id=b17be5f70cdc image=<NA>) k8s.ns=default k8s.pod=nginx-6db489d4b7-6pvjg container=b17be5f70cdc k8s.ns=default k8s.pod=nginx-6db489d4b7-6pvjg container=b17be5f70cdc
17:33:35.551194695: Warning TEST shell in a container (user=root) k8s.ns=default k8s.pod=nginx-6db489d4b7-6pvjg container=b17be5f70cdc
(...)
17:33:40.327820806: Warning Sensitive file opened for reading by non-trusted program (user=root program=cat command=cat /etc/shadow file=/etc/shadow parent=bash gparent=<NA> ggparent=<NA> gggparent=<NA> container_id=b17be5f70cdc image=<NA>) k8s.ns=default k8s.pod=nginx-6db489d4b7-6pvjg container=b17be5f70cdc k8s.ns=default k8s.pod=nginx-6db489d4b7-6pvjg container=b17be5f70cdc k8s.ns=default k8s.pod=nginx-6db489d4b7-6pvjg container=b17be5f70cdc
You can see a new message is there. You can add more rules and customize falco to your needs. We encourage setting up gRPC and then using falco-exporter to integrate it with Prometheus to easily monitor any security incident. In addition, you may also configure falco to support Kubernetes audit events.
Is it enough? You have inspected and scanned your image. You deployed a runtime scanner to keep an eye on the running containers. But none of those methods guarantee that the image you have just pulled or started is the same you wanted to run. What if someone injected there some malicious code and you did not notice? In order to defend against such an attack, you have to somehow securely and confidently identify the image. There has to be some tool that guarantees us such confidence… and there is one!
The UpdateFramework and Notary
The key element that helps and in fact solves many of those concerns is The Update Framework (TUF) that describes the update system as “secure” if:
- “it knows about the latest available updates in a timely manner,
- any files it downloads are the correct files, and,
- no harm results from checking or downloading files.”
(source: https://theupdateframework.github.io/security.html )
There are four principles defined by the framework that make it almost impossible to make a successful attack on such an update system.
1. The first principle is responsibility separation. In other words, there are a few different roles defined (that are used by e.g., the user or server) that are able to do different actions and use different keys for that purpose.
2. The next one is the multi-signature trust. This simply says that you need a fixed number of signatures which has to come together to perform certain actions, e.g., two developers using their keys to agree that a specific package is valid.
3. The third principle is explicit and implicit revocation. Explicit means that some parties come together and revoke another key, whereas implicit is when e.g., after some time, the repository may automatically revoke signing keys.
4. The last principle is to minimize individual key and role risks. As it says, the goal is to minimize the expected damage which can be defined by the probability of the event happening and its impact. So if there is a root role with a high impact on the system, the key it uses is kept offline.
The idea of TUF is to create and manage a set of metadata (signed by corresponding roles) that provide general information about the valid state of the repository at a specified time.
The next question is: How can Docker use this update framework, and what does it mean to you and me? First of all, Docker already uses it in the Content Trust, which definition seems to answer our first question about image correctness. As per documentation:
“Content trust provides the ability to use digital signatures for data sent to and received from remote Docker registries. These signatures allow client-side verification of the integrity and publisher of specific image tags.”
(source: https://docs.docker.com/engine/security/trust/content_trust )
To be more precise, Content Trust does not use TUF directly. Instead, it uses Notary, a tool created by Docker, which is an opinionated implementation of TUF. It keeps the TUF principles, so there are five roles (with corresponding keys), same as TUF defined, so we have:
· a root role – it uses the most important key that is used to sign the root metadata, which specifies other roles, so it is strongly advised to keep it secure offline;
· a snapshot role – this role signs snapshot metadata that contains information about file names, sizes, hashes of other (root, target and delegation) metadata files, so it ensures users about their integrity. It can be held by owner/admin or Notary service itself;
· a timestamp role – using timestamp key Notary signs metadata file which guarantee the freshness of the trusted collection, because of short expiration time. Due to that fact it is kept by Notary service to automatically regenerate when it is outdated;
· a targets role – it uses the targets key to sign the targets metadata file, with information about files in the collection (filenames, sizes and corresponding hashes) and it should be used to verify the integrity of the files inside the collection. The other usage of the targets key is to delegate trust to other peers using delegation roles.
· a delegation role – which is pretty similar to the targets role but instead of the whole content of the repository those keys ensure integrity of some (or sometimes all) of the actual content. They also can be used to delegate trust to other collaborators via lower level delegation roles.
All this metadata can be pulled or pushed to the Notary service. There are two components in the Notary service – server and signer. The server is responsible for storing the metadata (those files generated by the TUF framework underneath) for trusted collections in an associated database, generating the timestamp metadata, and the most important validating any uploaded metadata.
Notary signer stores private keys (this way they are not kept in the Notary server) and in case of a request from the Notary server it signs metadata for it. In addition, there is a Notary CLI that helps you to manage trusted collections and supports Content Trust with additional functionality. The basic interaction between client, server, and service can be described as: When the client wants to upload new metadata, after authentication (if required) metadata is validated by the server, which generates timestamp metadata (and sometimes snapshot based on what has changed) and sends it to the Notary signer for signing. After that server stores the client metadata, timestamp, and snapshot metadata which ensures that client files are the most recent and valid.
Let’s check how it works. First, run an unsigned image with Docker Content Trust (DCT) disabled. Everything works fine, so we can simply run our image v1:
$ docker run mirograpeup/hello:v1
Unable to find image 'mirograpeup/hello:v1' locally
v1: Pulling from mirograpeup/hello
Digest: sha256:be202781edb5aa6c322ec19d04aba6938b46e136a09512feed26659fb404d637
Status: Downloaded newer image for mirograpeup/hello:v1
Hello World folks!!!
Now we can check how it goes with DCT enabled. First, let’s see what happens when we want to run v2 (which is not signed as well):
$ export DOCKER_CONTENT_TRUST=1
$ docker run mirograpeup/hello:v2
docker: Error: remote trust data does not exist for docker.io/mirograpeup/hello: notary.docker.io does not have trust data for docker.io/mirograpeup/hello.
apiVersion: v1
See 'docker run --help'.
The error above is obvious – we did not specify the trust data/signatures for that image, so it fails to run. To sign the image, you have to push it to the remote repository.
$ docker push mirograpeup/hello:v2
The push refers to repository [docker.io/mirograpeup/hello]
c71acc1231cb: Layer already exists
v2: digest: sha256:be202781edb5aa6c322ec19d04aba6938b46e136a09512feed26659fb404d637 size: 524
Signing and pushing trust metadata
Enter passphrase for root key with ID 1d3d9a4:
Enter passphrase for new repository key with ID 5a9ff85:
Repeat passphrase for new repository key with ID 5a9ff85:
Finished initializing "docker.io/mirograpeup/hello"
Successfully signed docker.io/mirograpeup/hello:v2
For the first time, docker will ask you for the corresponding passphrases for the root key and repository if needed. After that, your image is signed, and we can check again if v1 or v2 can run.
$ docker run mirograpeup/hello:v1
docker: No valid trust data for v1.
See 'docker run --help'.
$ docker run mirograpeup/hello:v2
Hello World folks!!!
So it works well. You can see that it is not allowed to run unsigned images when DCT is enabled and that during the push all the signing process is done automatically. In the end, even though the process itself is a little bit complicated, you can very easily push images to the Docker repository and be sure that it is always the image you intended to run. One drawback of the DCT is that it is not supported in Kubernetes by default. You are able to work around that with admission plugins but it requires additional work.
Registry
We spoke a lot about containers security and how to run them without a headache. But besides that, you have to secure your container registry. First of all, you need to decide whether to use a hosted (e.g., Docker Hub) or on-prem registry.
One good thing about a hosted registry is that it should support (at least Docker Hub does) the Docker Content Trust by default and you just have to enable that on the client side. If you want that to be supported in the on-prem registry then you have to deploy the Notary server and configure that properly on the client side.
On the other hand, the Docker Hub does not provide image scanning and in the on-prem registries, it is usually a standard to provide such ability. Plus in most cases, those solutions support more than one image scanner. So you can choose which scanner you want to run. In some cases, like in Harbor, you are allowed to configure automatically scheduled tests and you can set up some notifications if needed. So it is a very nice thing that the on-prem registry is not worse and sometimes offers more than a free Docker Hub registry which comes with few limitations.
In addition, you have much more control over the on-prem registry. You can have a super-admin account and see all the images and statistics. But you have to maintain it and make sure it will be always up and running. Still, many companies prevent use of external registries - so in that case, you have no choice.
Whatever you choose, always make sure to use TLS communication. If your on-prem registry uses self-signed or signed by company root CA, certificates, then you have to configure Docker in Kubernetes properly. You can specify the insecure-registries option in the Docker daemon, but it may end up with fallback to HTTP which is not what we tried to prevent in the first place. A more secure option is to provide the certificates to the Docker daemon:
cp domain.crt /etc/docker/certs.d/mydomain.com:5000/ca.crt
Private registry
Also, if you want to use a private registry, you will have to provide the credentials or cache (manually load) the image to each worker node. Please note to force cached images to be used you need to block the imagePullPolicy: Always . When it comes to providing credentials, you basically have two options.
Configure Nodes
Prepare the proper docker config.json:
{
"auths": {
"https://index.docker.io/v1/": {
"username": "xxxxxxxx"
"password": "xxxxxxxx"
"email": "xxxxxxxx"
"auth": "<base64-encoded-‘username:password’>"
}
}
}
And copy that to each worker node to the kubelet configuration directory. It is usually /var/lib/kubelet, so for a single worker it would be:
$ scp config.json root@worker-node:/var/lib/kubelet/config.json
Use ImagePullSecrets
The easiest way is to use the built-in mechanism in the Kubernetes secrets:
kubectl create secret docker-registry <secret-name> \
--docker-server=<your-registry-server> \
--docker-username=<your-name> \
--docker-password=<your-password> \
--docker-email=<your-email>
or you may create a secret by providing a YAML file with the base64 encoded docker config.json:
{
"auths": {
"https://index.docker.io/v1/": {
"username": "xxxxxxxx"
"password": "xxxxxxxx"
"email": "xxxxxxxx"
"auth": "<base64-encoded-‘username:password’>"
}
}
}
secret.yml (please note the type has to be kubernetes.io/dockerconfigjson and the data should be placed under .dockerconfigjson):
apiVersion: v1
kind: Secret
metadata:
name: <secret-name>
namespace: <namespace-name>
data:
.dockerconfigjson: <base64-encoded-config-json-file>
type: kubernetes.io/dockerconfigjson
Adding the above secret, you have to keep in mind that it works only in the specified namespace, and anyone in that namespace may be able to read that. So you have to be careful who is allowed to use your namespace/cluster. Now, if you want to use this secret, you simply have to put it in the Pod spec imagePullSecrets property:
apiVersion: v1
kind: Pod
metadata:
name: private-reg
spec:
containers:
- name: private-reg-container
image: <your-private-image>
imagePullSecrets:
- name: <your-secret-name>
Container security checks
If you want to be even more secure than you can run some additional tests to check your setup. In that case, the Docker security is the thing you want to check. In order to do that, you can use Docker Bench Security. It will scan your runtime to find any issues or insecure configurations. The easiest way is to run it as a pod inside your cluster. You have to mount a few directories from the worker node and run this pod as root, so make sure you know what you are doing. The below example shows how the Pod is configured if your worker runs on Ubuntu (there are some different mount directories needed on different operating systems).
cat docker-bench.yml
apiVersion: v1
kind: Pod
metadata:
name: docker-bench
spec:
hostPID: true
hostIPC: true
hostNetwork: true
securityContext:
runAsUser: 0
containers:
- name: docker-bench
image: docker/docker-bench-security
securityContext:
privileged: true
capabilities:
add: ["AUDIT_CONTROL"]
volumeMounts:
- name: etc
mountPath: /etc
readOnly: true
- name: libsystemd
mountPath: /lib/systemd/system
readOnly: true
- name: usrbincontainerd
mountPath: /usr/bin/containerd
readOnly: true
- name: usrbinrunc
mountPath: /usr/bin/runc
readOnly: true
- name: usrlibsystemd
mountPath: /usr/lib/systemd
readOnly: true
- name: varlib
mountPath: /var/lib
readOnly: true
- name: dockersock
mountPath: /var/run/docker.sock
readOnly: true
volumes:
- name: etc
hostPath:
path: /etc
- name: libsystemd
hostPath:
path: /lib/systemd/system
- name: usrbincontainerd
hostPath:
path: /usr/bin/containerd
- name: usrbinrunc
hostPath:
path: /usr/bin/runc
- name: usrlibsystemd
hostPath:
path: /usr/lib/systemd
- name: varlib
hostPath:
path: /var/lib
- name: dockersock
hostPath:
path: /var/run/docker.sock
type: Socket
kubectl apply -f docker-bench.yml
kubectl logs docker-bench -f
# ------------------------------------------------------------------------------
# Docker Bench for Security v1.3.4
#
# Docker, Inc. (c) 2015-
#
# Checks for dozens of common best-practices around deploying Docker containers in production.
# Inspired by the CIS Docker Community Edition Benchmark v1.1.0.
# ------------------------------------------------------------------------------
Initializing Sun Sep 13 22:41:02 UTC 2020
[INFO] 1 - Host Configuration
[WARN] 1.1 - Ensure a separate partition for containers has been created
[NOTE] 1.2 - Ensure the container host has been Hardened
[INFO] 1.3 - Ensure Docker is up to date
[INFO] * Using 18.09.5, verify is it up to date as deemed necessary
[INFO] * Your operating system vendor may provide support and security maintenance for Docker
[INFO] 1.4 - Ensure only trusted users are allowed to control Docker daemon
[INFO] * docker:x:998
[WARN] 1.5 - Ensure auditing is configured for the Docker daemon
[WARN] 1.6 - Ensure auditing is configured for Docker files and directories - /var/lib/docker
[WARN] 1.7 - Ensure auditing is configured for Docker files and directories - /etc/docker
[WARN] 1.8 - Ensure auditing is configured for Docker files and directories - docker.service
[INFO] 1.9 - Ensure auditing is configured for Docker files and directories - docker.socket
[INFO] * File not found
[WARN] 1.10 - Ensure auditing is configured for Docker files and directories - /etc/default/docker
[INFO] 1.11 - Ensure auditing is configured for Docker files and directories - /etc/docker/daemon.json
[INFO] * File not found
[INFO] 1.12 - Ensure auditing is configured for Docker files and directories - /usr/bin/docker-containerd
[INFO] * File not found
[INFO] 1.13 - Ensure auditing is configured for Docker files and directories - /usr/bin/docker-runc
[INFO] * File not found
[INFO] 2 - Docker daemon configuration
[WARN] 2.1 - Ensure network traffic is restricted between containers on the default bridge
[PASS] 2.2 - Ensure the logging level is set to 'info'
[WARN] 2.3 - Ensure Docker is allowed to make changes to iptables
[PASS] 2.4 - Ensure insecure registries are not used
[PASS] 2.5 - Ensure aufs storage driver is not used
[INFO] 2.6 - Ensure TLS authentication for Docker daemon is configured
(...)
After completing these steps, you can check the logs from the Pod to see the full output from Docker Bench Security and act on any warning you see there. The task is quite demanding but gives you the most secure Docker runtime. Please note sometimes you have to leave a few warnings in order to keep everything working. Then you still have an option to provide more security using Kubernetes configuration and resources, but this is a topic for a separate article.

How to run Selenium BDD tests in parallel with AWS Lambda
Have you ever felt annoyed because of the long waiting time for receiving test results? Maybe after a few hours, you’ve figured out that there had been a network connection issue in the middle of testing, and half of the results can go to the trash? That may happen when your tests are dependent on each other or when you have plenty of them and execution lasts forever. It's quite a common issue. But there’s actually a solution that can not only save your time but also your money - parallelization in the Cloud.
How it started
Developing UI tests for a few months, starting from scratch, and maintaining existing tests, I found out that it has become something huge that will be difficult to take care of very soon. An increasing number of test scenarios made every day led to bottlenecks. One day when I got to the office, it turned out that the nightly tests were not over yet. Since then, I have tried to find a way to avoid such situations.
A breakthrough was the presentation of Tomasz Konieczny during the Testwarez conference in 2019. He proved that it’s possible to run Selenium tests in parallel using AWS Lambda. There’s actually one blog that helped me with basic Selenium and Headless Chrome configuration on AWS. The Headless Chrome is a light-weighted browser that has no user interface. I went a step forward and created a solution that allows designing tests in the Behavior-Driven Development process and using the Page Object Model pattern approach, run them in parallel, and finally - build a summary report.
Setting up the project
The first thing we need to do is signing up for Amazon Web Services. Once we have an account and set proper values in credentials and config files (.aws directory), we can create a new project in PyCharm, Visual Studio Code, or in any other IDE supporting Python. We’ll need at least four directories here. We called them ‘lambda’, ‘selenium_layer’, ‘test_list’, ‘tests’ and there’s also one additional - ‘driver’, where we keep a chromedriver file, which is used when running tests locally in a sequential way.
In the beginning, we’re going to install the required libraries. Those versions work fine on AWS, but you can check newer if you want.
requirements.txt
allure_behave==2.8.6
behave==1.2.6
boto3==1.10.23
botocore==1.13.23
selenium==2.37.0
What’s important, we should install them in the proper directory - ‘site-packages’.
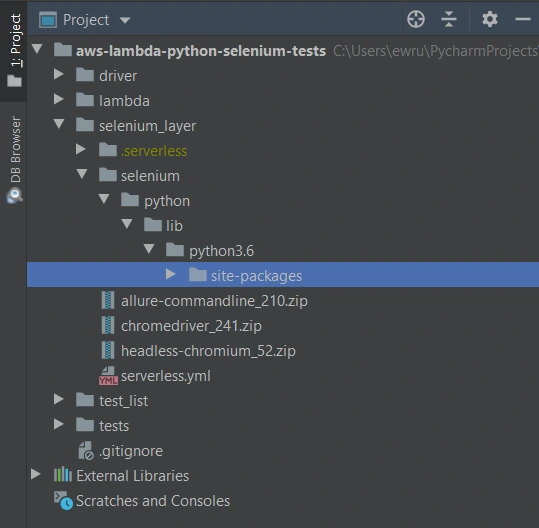
We’ll need also some additional packages:
Allure Commandline ( download )
Chromedriver ( download )
Headless Chromium ( download )
All those things will be deployed to AWS using Serverless Framework, which you need to install following the docs . The Serverless Framework was designed to provision the AWS Lambda Functions, Events, and infrastructure Resources safely and quickly. It translates all syntax in serverless.yml to a single AWS CloudFormation template which is used for deployments.
Architecture - Lambda Layers
Now we can create a serverless.yml file in the ‘selenium-layer’ directory and define Lambda Layers we want to create. Make sure that your .zip files have the same names as in this file. Here we can also set the AWS region in which we want to create our Lambda functions and layers.
serverless.yml
service: lambda-selenium-layer
provider:
name: aws
runtime: python3.6
region: eu-central-1
timeout: 30
layers:
selenium:
path: selenium
CompatibleRuntimes: [
"python3.6"
]
chromedriver:
package:
artifact: chromedriver_241.zip
chrome:
package:
artifact: headless-chromium_52.zip
allure:
package:
artifact: allure-commandline_210.zip
resources:
Outputs:
SeleniumLayerExport:
Value:
Ref: SeleniumLambdaLayer
Export:
Name: SeleniumLambdaLayer
ChromedriverLayerExport:
Value:
Ref: ChromedriverLambdaLayer
Export:
Name: ChromedriverLambdaLayer
ChromeLayerExport:
Value:
Ref: ChromeLambdaLayer
Export:
Name: ChromeLambdaLayer
AllureLayerExport:
Value:
Ref: AllureLambdaLayer
Export:
Name: AllureLambdaLayer
Within this file, we’re going to deploy a service consisting of four layers. Each of them plays an important role in the whole testing process.
Creating test set
What would the tests be without the scenarios? Our main assumption is to create test files running independently. This means we can run any test without others and it works. If you're following clean code, you'll probably like using the Gherkin syntax and the POM approach. Behave Framework supports both.
What gives us Gherkin? For sure, better readability and understanding. Even if you haven't had the opportunity to write tests before, you will understand the purpose of this scenario.
01.OpenLoginPage.feature
@smoke
@login
Feature: Login to service
Scenario: Login
Given Home page is opened
And User opens Login page
When User enters credentials
And User clicks Login button
Then User account page is opened
Scenario: Logout
When User clicks Logout button
Then Home page is opened
And User is not authenticated
In the beginning, we have two tags. We add them in order to run only chosen tests in different situations. For example, you can name a tag @smoke and run it as a smoke test, so that you can test very fundamental app functions. You may want to test only a part of the system like end-to-end order placing in the online store - just add the same tag for several tests.
Then we have the feature name and two scenarios. Those are quite obvious, but sometimes it’s good to name them with more details. Following steps starting with Given, When, Then and And can be reused many times. That’s the Behavior-Driven Development in practice. We’ll come back to this topic later.
Meantime, let’s check the proper configuration of the Behave project.
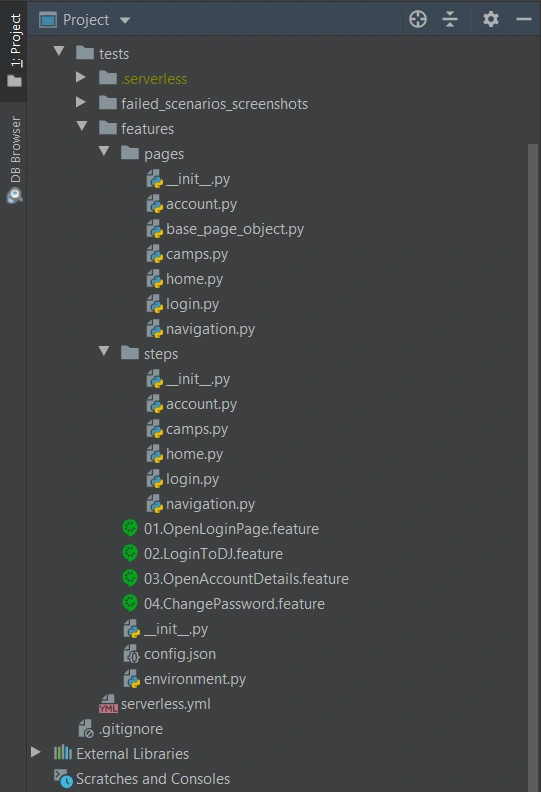
We definitely need a ‘feature’ directory with ‘pages’ and ‘steps’. Make the ‘feature’ folder as Sources Root. Just right-click on it and select the proper option. This is the place for our test scenario files with .feature extension.
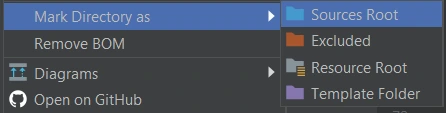
It’s good to have some constant values in a separate file so that it will change only here when needed. Let’s call it config.json and put the URL of the tested web application.
config.json
{
"url": "http://drabinajakuba.atthost24.pl/"
}
One more thing we need is a file where we set webdriver options.
Those are required imports and some global values like, e.g. a name of AWS S3 bucket in which we want to have screenshots or local directory to store them in. As far as we know, bucket names should be unique in whole AWS S3, so you should probably change them but keep the meaning.
environment.py
import os
import platform
from datetime import date, datetime
import json
import boto3
from selenium import webdriver
from selenium.webdriver.chrome.options import Options
REPORTS_BUCKET = 'aws-selenium-test-reports'
SCREENSHOTS_FOLDER = 'failed_scenarios_screenshots/'
CURRENT_DATE = str(date.today())
DATETIME_FORMAT = '%H_%M_%S'
Then we have a function for getting given value from our config.json file. The path of this file depends on the system platform - Windows or Darwin (Mac) would be local, Linux in this case is in AWS. If you need to run these tests locally on Linux, you should probably add some environment variables and check them here.
def get_from_config(what):
if 'Linux' in platform.system():
with open('/opt/config.json') as json_file:
data = json.load(json_file)
return data[what]
elif 'Darwin' in platform.system():
with open(os.getcwd() + '/features/config.json') as json_file:
data = json.load(json_file)
return data[what]
else:
with open(os.getcwd() + '\\features\\config.json') as json_file:
data = json.load(json_file)
return data[what]
Now we can finally specify paths to chromedriver and set browser options which also depend on the system platform. There’re a few more options required on AWS.
def set_linux_driver(context):
"""
Run on AWS
"""
print("Running on AWS (Linux)")
options = Options()
options.binary_location = '/opt/headless-chromium'
options.add_argument('--allow-running-insecure-content')
options.add_argument('--ignore-certificate-errors')
options.add_argument('--disable-gpu')
options.add_argument('--headless')
options.add_argument('--window-size=1280,1000')
options.add_argument('--single-process')
options.add_argument('--no-sandbox')
options.add_argument('--disable-dev-shm-usage')
capabilities = webdriver.DesiredCapabilities().CHROME
capabilities['acceptSslCerts'] = True
capabilities['acceptInsecureCerts'] = True
context.browser = webdriver.Chrome(
'/opt/chromedriver', chrome_options=options, desired_capabilities=capabilities
)
def set_windows_driver(context):
"""
Run locally on Windows
"""
print('Running on Windows')
options = Options()
options.add_argument('--no-sandbox')
options.add_argument('--window-size=1280,1000')
options.add_argument('--headless')
context.browser = webdriver.Chrome(
os.path.dirname(os.getcwd()) + '\\driver\\chromedriver.exe', chrome_options=options
)
def set_mac_driver(context):
"""
Run locally on Mac
"""
print("Running on Mac")
options = Options()
options.add_argument('--no-sandbox')
options.add_argument('--window-size=1280,1000')
options.add_argument('--headless')
context.browser = webdriver.Chrome(
os.path.dirname(os.getcwd()) + '/driver/chromedriver', chrome_options=options
)
def set_driver(context):
if 'Linux' in platform.system():
set_linux_driver(context)
elif 'Darwin' in platform.system():
set_mac_driver(context)
else:
set_windows_driver(context)
Webdriver needs to be set before all tests, and in the end, our browser should be closed.
def before_all(context):
set_driver(context)
def after_all(context):
context.browser.quit()
Last but not least, taking screenshots of test failure. Local storage differs from the AWS bucket, so this needs to be set correctly.
def after_scenario(context, scenario):
if scenario.status == 'failed':
print('Scenario failed!')
current_time = datetime.now().strftime(DATETIME_FORMAT)
file_name = f'{scenario.name.replace(" ", "_")}-{current_time}.png'
if 'Linux' in platform.system():
context.browser.save_screenshot(f'/tmp/{file_name}')
boto3.resource('s3').Bucket(REPORTS_BUCKET).upload_file(
f'/tmp/{file_name}', f'{SCREENSHOTS_FOLDER}{CURRENT_DATE}/{file_name}'
)
else:
if not os.path.exists(SCREENSHOTS_FOLDER):
os.makedirs(SCREENSHOTS_FOLDER)
context.browser.save_screenshot(f'{SCREENSHOTS_FOLDER}/{file_name}')
Once we have almost everything set, let’s dive into single test creation. Page Object Model pattern is about what exactly hides behind Gherkin’s steps. In this approach, we treat each application view as a separate page and define its elements we want to test. First, we need a base page implementation. Those methods will be inherited by all specific pages. You should put this file in the ‘pages’ directory.
base_page_object.py
from selenium.webdriver.common.action_chains import ActionChains
from selenium.webdriver.support.ui import WebDriverWait
from selenium.webdriver.support import expected_conditions as EC
from selenium.common.exceptions import *
import traceback
import time
from environment import get_from_config
class BasePage(object):
def __init__(self, browser, base_url=get_from_config('url')):
self.base_url = base_url
self.browser = browser
self.timeout = 10
def find_element(self, *loc):
try:
WebDriverWait(self.browser, self.timeout).until(EC.presence_of_element_located(loc))
except Exception as e:
print("Element not found", e)
return self.browser.find_element(*loc)
def find_elements(self, *loc):
try:
WebDriverWait(self.browser, self.timeout).until(EC.presence_of_element_located(loc))
except Exception as e:
print("Element not found", e)
return self.browser.find_elements(*loc)
def visit(self, url):
self.browser.get(url)
def hover(self, element):
ActionChains(self.browser).move_to_element(element).perform()
time.sleep(5)
def __getattr__(self, what):
try:
if what in self.locator_dictionary.keys():
try:
WebDriverWait(self.browser, self.timeout).until(
EC.presence_of_element_located(self.locator_dictionary[what])
)
except(TimeoutException, StaleElementReferenceException):
traceback.print_exc()
return self.find_element(*self.locator_dictionary[what])
except AttributeError:
super(BasePage, self).__getattribute__("method_missing")(what)
def method_missing(self, what):
print("No %s here!", what)
That’s a simple login page class. There’re some web elements defined in locator_dictionary and methods using those elements to e.g., enter text in the input, click a button, or read current values. Put this file in the ‘pages’ directory.
login.py
from selenium.webdriver.common.by import By
from .base_page_object import *
class LoginPage(BasePage):
def __init__(self, context):
BasePage.__init__(
self,
context.browser,
base_url=get_from_config('url'))
locator_dictionary = {
'username_input': (By.XPATH, '//input[@name="username"]'),
'password_input': (By.XPATH, '//input[@name="password"]'),
'login_button': (By.ID, 'login_btn'),
}
def enter_username(self, username):
self.username_input.send_keys(username)
def enter_password(self, password):
self.password_input.send_keys(password)
def click_login_button(self):
self.login_button.click()
What we need now is a glue that will connect page methods with Gherkin steps. In each step, we use a particular page that handles the functionality we want to simulate. Put this file in the ‘steps’ directory.
login.py
from behave import step
from environment import get_from_config
from pages import LoginPage, HomePage, NavigationPage
@step('User enters credentials')
def step_impl(context):
page = LoginPage(context)
page.enter_username('test_user')
page.enter_password('test_password')
@step('User clicks Login button')
def step_impl(context):
page = LoginPage(context)
page.click_login_button()
It seems that we have all we need to run tests locally. Of course, not every step implementation was shown above, but it should be easy to add missing ones.
If you want to read more about BDD and POM, take a look at Adrian’s article
All files in the ‘features’ directory will also be on a separate Lambda Layer. You can create a serverless.yml file with the content presented below.
serverless.yml
service: lambda-tests-layer
provider:
name: aws
runtime: python3.6
region: eu-central-1
timeout: 30
layers:
features:
path: features
CompatibleRuntimes: [
"python3.6"
]
resources:
Outputs:
FeaturesLayerExport:
Value:
Ref: FeaturesLambdaLayer
Export:
Name: FeaturesLambdaLayer
This is the first part of the series covering running Parallel Selenium tests on AWS Lambda. More here !
Whose cluster is it anyway?
While researching how enterprises adopt Kubernetes, we can outline a common scenario; implementing a Kubernetes cluster in a company often starts as a proof of concept. Either developers decide they want to try something new, or the CTO does his research and decides to give it a try as it sounds promising. Typically, there is no roadmap, no real plan for the future steps, no decision to go for production.
First steps with a Kubernetes cluster in an enterprise
And then it is a huge success - a Kubernetes cluster makes managing deployments easier, it’s simple to use for developers, cheaper than the previously used platform and it just works for everyone. The security team creates the firewall rules, approves the configuration of the network overlay and load balancers. Operators create their CI/CD pipelines for the cluster deployments, backups and daily tasks. Developers rewrite configuration parsing and communication to fully utilize the ConfigMaps, Secrets and cluster internal routing and DNS. In no time you are one click from scrapping the existing infrastructure and moving everything to the Kubernetes.
This might be the point when you start thinking about providing support for your cluster and the applications in it. It may be an internal development team using your Kubernetes cluster, or PaaS for external teams. In all cases, you need a way to triage all support cases and decide which team or a person is responsible for which part of the cluster management . Let’s first split this into two scenarios.
A Kubernetes Cluster per team
If the decision is to give a full cluster or clusters for a team, there is no resource sharing, so there is less to worry about. Still, someone has to draw the line and say where a cluster operators’ responsibility ends, and the developers have to take it.
The easiest way would be to give the full admin access to the cluster, some volumes for persistent data and a set of LBs (or even one LB for ingress), and delegate the management to the development team. Such a solution would not be possible in most cases, as it requires a lot of experience from the development team to properly manage the cluster and make sure it is stable. Also, this is not always optimal from the resources perspective to create a cluster for even a small team.
The other problem is that when a team has to manage the whole cluster, the actual way it works can greatly diverge. Some teams decide to use nginx ingress and some traefik. End of the day, it is much easier to monitor and manage the uniform clusters.
Shared cluster
The alternative is to utilize the same cluster for multiple teams. There is quite a lot of configuration required to make sure the team doesn't interfere and can’t affect other teams operations, but adds a lot of flexibility when it comes to resource management and limits greatly the number of clusters which have to be managed, for example in terms of backing them up. It might be also useful if teams work on the same project or the set of projects which use the same resources or closely communicate - at the current point it is possible to communicate between the cluster using service mesh or just load balancers, but it may be the most performant solution.
Responsibility levels
If the dev team does not possess the skills required to manage a Kubernetes cluster, then the responsibility has to split between them and operators. Let’s create four examples of this kind of distribution:
Not a developer responsibility
This is probably the hardest version for the operators’ team, where the development team is only responsible for building the docker image and pushing to the correct container registry. Kubernetes on it’s own helps a lot with making sure that new version rollout does not result in a broken application via deployment strategy and health checks. If something silently breaks, it may be hard to figure out if it is a cluster failure or a result of the application update , or even database model change.
Developer can manage deployments, pods, and configuration resources
This is a better scenario. When developers are responsible for the whole application deployment by creating manifests, all configuration resources, and doing rollouts, they can and should do a smoke test afterwards to make sure everything remains operational. Additionally, they can check the logs to see what went wrong and debug in the cluster.
This is also the point where the security or operations team need to start to think about securing a cluster. There are settings on the pod level which can elevate the workload privileges, change the group it runs as or mount the system directories. This can be done for example via Open Policy Agent. Obviously, there should be no access to the other namespaces, especially the kube-system, but this can be easily done with just built-in RBAC.
Developers can manage all namespace level resources
If the previous version worked maybe we can give developers more power? We can, especially when we create quotas on everything we can. Let’s first go through additional resources that are now available and see if something seems risky (we have stripped the uncommon ones for clarity). Below you can see them gathered in two groups:
Safe ones:
- Job
- PersistentVolumeClaim
- Ingress
- PodDisruptionBudget
- DaemonSet
- HorizontalPodAutoscaler
- CronJob
- ServiceAccount
The ones we recommend to block:
- NetworkPolicy
- ResourceQuota
- LimitRange
- RoleBinding
- Role
This is not really a definitive guide, just a hint. NetworkPolicy depends really on the network overlay configuration and security rules we want to enforce. ServiceAccount is also arguable depending on the use case. Other ones are commonly used to manage the resources in the shared cluster and the access to it, so should be available mainly for the cluster administrators.
DevOps multifunctional teams
Last, but not least, the famous and probably the hardest to come by approach: multifunctional teams and a DevOps role. Let’s start with the first one - moving part of the operators to work in the same team, same room, with the developers solves a lot of problems. There is no going back and forth and trying to keep in sync backlogs, sprints, and tasks for multiple teams - the work is prioritized for the team and treated as a team effort. No more waiting 3 weeks for a small change, because the whole ops team is busy with the mission-critical project . No more fighting for the change that is top-priority for the project, but gets pushed down in the queue.
Unfortunately, this means each team needs its own operators, which may be expensive and rarely possible. As a solution for that problem comes the mythical DevOps position: developer with operator skills who can part-time create and manage the cluster resources, deployments and CI/CD pipelines, and part-time work on the code. The required skill set is very broad, so it is not easy to find someone for that position, but it gets popular and may revolutionize the way teams work. Sad to say, this position is often described as an alias of the SRE position, which is not really the same thing.
Triage, delegate, and fix
The responsibility split is done, so now we should only decide on the incident response scenarios, how do we triage issues, and figure out which team is responsible for fixing it (for example by monitoring cluster health and associating it with the failure), alerting and, of course, on-call schedules. There are a lot of tools available just for that.
Eventually, there is always a question “whose cluster is it?” and if everyone knows which field or part of the cluster they manage, then there are no misunderstandings and no blaming each other for the failure. And it’s getting resolved much faster.
In-app purchases in iOS apps – a tester’s perspective
Year after year, Apple’s new releases of mobile devices gain a decent amount of traction in tech media coverage and keep attracting customers to obtain their quite pricey products. Promises of superior quality, straightforwardness of the integrated ecosystem, and inclusion of new, cutting edge technologies urge the company’s longtime fans and new customers alike to upgrade their devices to Californian designed phones, tablets and computers.
Resurgence
Focusing on the mobile market alone, it is impossible to neglect the significant raise in Apple’s iOS market share of mobile operating systems. Its major competitor, Google’s Android has noted 70.68% of mobile market share in April 2020 – which is around 6 percentage points less than in October 2019. On the other hand, iOS, which noted 22.09% of the market share around the same time, recently has risen to 28.79%. This trend surely pleases Apple’s board, along with anyone who strives to monetize their app ideas in App store.
Gaining revenue through in-app purchases sounds like a brilliant idea, but it requires plenty of planning, calculating risks, and evaluating funds for the project. Before publishing the software product, an idea has to be conceived, marketed, developed, and tested. Each step of this process of making an app aimed at providing paid content differs from the process of creating a custom-ordered software. And that also includes testing.
At what cost?
But wait! Testing usually includes lots of repetition. So that would mean testers have to go through many transactions. Doesn’t that entail spending lots of money? Well, not exactly. Apple provides development teams with their own in-app purchase testing tool, Sandbox. But using it doesn’t make testing all fun and games.
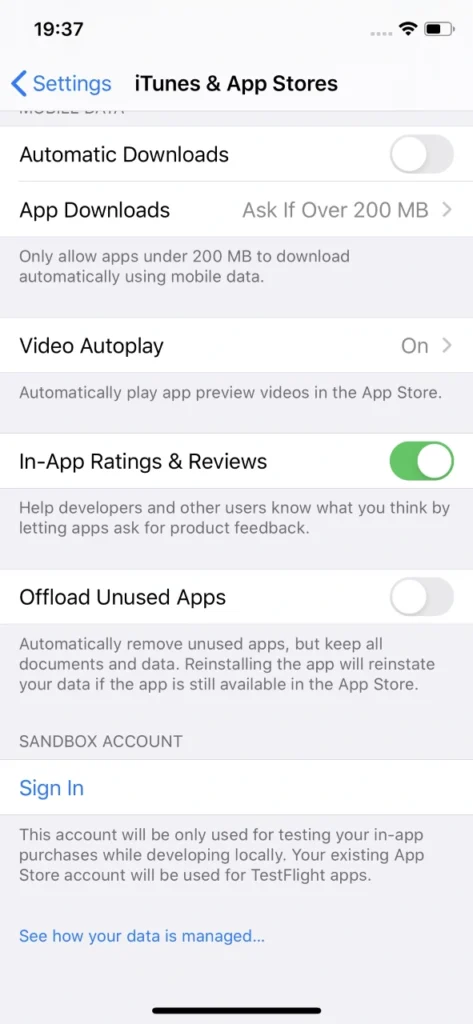
Sandbox allows for local development of in-app purchases without spending a dime on them. That happens by supplementing the ‘real’ Appstore account with the Sandbox one. Sounds fantastic, doesn’t it? But unfortunately, there are some inconveniences behind that.
If it ain’t broke...
First of all, Sandbox accounts have to be created manually via iTunes Connect, which leaves much to be desired in terms of performance. These accounts require an email in a valid format. Testers will need plenty of Sandbox accounts because it is actually quite easy to ‘use them up’, especially when tested software has its own sign-in system (not related to Apple ID). If by design said app account is also associated with In-app purchase, each app account will require a new Sandbox account.

Unfortunately, Apple’s Sandbox accounts can get really tricky to log into. When you’re trying to sign in to another Sandbox account, which was probably named similarly as all previous one for convenience, you’d think your muscle memory will allow you to type in the password without looking at the screen. Nothing more wrong. Sometimes, when you type in the credentials which consist of an email and a password, check twice and hit Sign In button in Sandbox login popover, nothing happens.
User is not logged in, not even a sign in error is displayed. And you try again. Every character is exactly the same as before. And eventually, you manage to log in. It’s not really a big of a deal unless you lose your temper easily testing manually, but a simple message informing why Sandbox login failed would be much more user-friendly. In automated tests you could just write the code to try to log in until the email address used as login is displayed in the Sandbox account section in iOS settings, which means that the login was successful. It’s not something testers can’t live with, but addressing the issue by Apple would greatly improve the experience of working in iOS development.
Cryptic writings
Problems arise when notifications informing that a particular Sandbox user is subscribed to an auto-renewable subscription are not delivered by Apple. Therefore, many subscription purchase attempts have to be made to actually make sure whether the development of the app went the correct way and it’s just Apple’s own system’s error, not a bug inside the app.
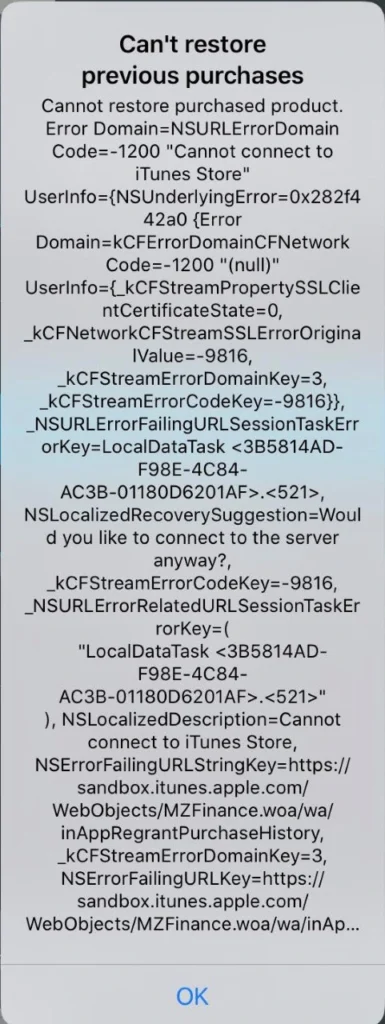
Speaking of errors – during testing of in-app purchase features, it can become really difficult to point out to developers what went wrong to help them debug the problem. Errors displayed are very cryptic and long; therefore, investigating the root cause of the problem can consume a substantial amount of time. There are two main reasons for that: there’s no error documentation created by Apple for those long error messages or the message displayed is very generic.
Combining this with problems which include performance drops in ‘prime time’, problems with receiving server notifications, e.g. for Autorenewing Subscriptions or simply inability to connect to iTunes store and a simple task of testing monthly subscription can turn into a major regression testing suite.
Hey, Siri...
Another issue with Sandbox testing that is not so convenient to work with and not so obvious to workaround are the irritating Sandbox login prompts. These occur randomly for the eternity of your app’s development cycle if the In-app purchases feature in the app under test includes auto-renewable subscriptions. What is problematic is that these login prompts pop-up at any given time, not just when the app is used or dropped to the background. Well, if you’re patient you can learn to live with it and dismiss it when it shows up. But problems may occur when the device used for testing said app is also utilized as a real device in automated tests, e.g. in conjunction with Appium.
This can be addressed by setting up Appium properties in testing framework to automatically dismiss system popups. That could prove somewhat helpful if the test suite doesn’t include any other interactions with system popups. Deleting the application which includes auto-renewable subscriptions from the device gets rid of the random Sandbox login prompts on the device, but that’s not how testing works. Another workaround might be building the app with subscription part removed, which requires additional work on developers’ side. These login prompts are surely a major problem which Apple should address.

Send reinforcements
Despite all that, developers and testers alike can and eventually will get through the tedious process of developing and ensuring the quality of in-app purchases in Apple’s ecosystem . A good tactic for this in manual testing is to work out a solid testing routine, which will allow for quicker troubleshooting. Being cautious about each step in the testing scenario and monitoring the environment differences such as being logged in with proper Sandbox account instead of regular Apple ID, an appropriate combination of app account and the Sandbox account or the state of the app in relation to purchases made (whether an In-app purchase has been made within a particular installation or not) is key to understanding whether the application does what is expected and transactions are successful.
While Silicon Valley’s giant rises in the mobile market again, more and more ideas will be monetized in Appstore, making profits not only for the developers but also directly for Apple, which collects a hefty portion of the money spent on apps and paid extras. Let’s hope that sooner than later Apple will address the issues that have been annoying development teams for years now and make their jobs a bit easier.
Sources:
Common Kubernetes failures at scale
Currently, Vanilla Kubernetes supports 5000 nodes in a single cluster. It does not mean that we can just deploy 5000 workers without consequences - some problems and edge scenarios happen only in the larger clusters. In this article, we analyze the common Kubernetes failures at scale, the issues we can encounter if we reach a certain cluster size or high load - network or compute.
Incorrect size
When the compute power requirements grow, the cluster grows in size to house the new containers. Of course, as experienced cluster operators , while adding new workers, we also increase master nodes count. Everything works well until the Kubernetes cluster size expanded slightly over 1000-1500 nodes - and now everything fails. Kubectl does not work anymore, we can’t make any new changes - what has happened?
Let’s start with what is a change for Kubernetes and what actually happens when an event occurs. Kubectl contacts the kube-apiserver through API port and requests a change. Then the change is saved in a database and used by other APIs like kube-controller-manager or kube-scheduler. This gives us two quick leads - either there is a communication problem or the database does not work.
Let’s quickly check the connection to the API with curl ( curl https://[KUBERNETES_MASTE_HOST]/api/ ) - it works. Well, that was too easy.
Now, let’s check the apiserver logs if there is something strange or alarming. And there is! We have an interesting error message in logs:
etcdserver: mvcc: database space exceeded
Let’s connect to ETCD and see what is the database size now:
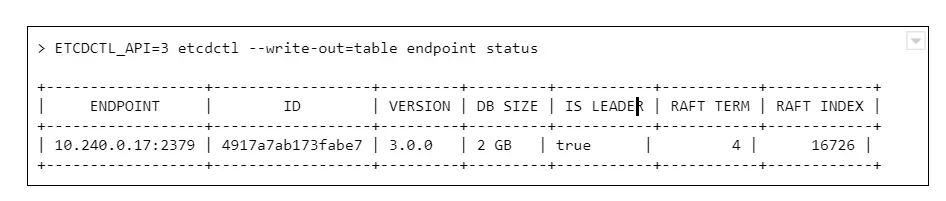
And we see a round number 2GB or 4GB of database size. Why is that a problem? The disks on masters have plenty of free space.
The thing is, it is not caused by resources starvation. The maximum DB size is just a configuration value, namely quota-backend-bytes . The configuration for this was added in 1.12, but it is possible (and for large clusters highly advised) to just use separate etcd cluster to avoid slowdowns. It can be configured by environment variable:
ETCD_QUOTA_BACKEND_BYTES
Etcd itself is a very fragile solution if you think of it for the production environment. Upgrades, rollback procedure, restoring backups - those are things to be carefully considered and verified because not so many people think about it. Also, it requires A LOT of IOPS bandwidth, so optimally, it should be run on fast SSDs.
What are ndots?
Here occurs one of the most common issues which comes to mind when we think about the Kubernetes cluster failing at scale. This is the first issue faced by our team while starting with managing Kubernetes clusters, and it seems to occur after all those years to the new clusters.
Let’s start with defining ndots . And this is not something specific to Kubernetes this time. In fact, it is just a rarely used /etc/resolv.conf configuration parameter, which by default is set to 1 .
Let’s start with the structure of this file, there are only a few options available there:
- nameserver - list of addresses of the DNS server used to resolve the addresses (in the order listed in a file). One address per keyword.
- domain - local domain name.
- sortlist - sort order of addresses returned by gethostbyname() .
- options:
- ndots - maximum number of dots which must appear in hostname given for resolution before initial absolute query should happen. Ndots = 1 means if there is any dot in the name the first try will be absolute name try.
- debug , timeout , attempts … - let’s leave other ones for now
- search - list of domains used for the resolution if the query has less than configure in ndots dots.
So the ndots is a name of configuration parameter which, if set to value bigger than 1 , generates more requests using the list specified in the search parameter. This is still quite cryptic, so let’s look at the example `/etc/resolve.conf` in Kubernetes pod:
nameserver 10.11.12.13
search kube-system.svc.cluster.local svc.cluster.local cluster.local
options ndots:5
With this configuration in place, if we try to resolve address test-app with this configuration, it generates 4 requests:
- test-app.kube-system.svc.cluster.local
- test-app.svc.cluster.local
- test-app.cluster.local
- test-app
If the test-app exists in the namespace, the first one will be successful. If it does not exist at all, it 4th will get out to real DNS.
How can Kubernetes, or actually CoreDNS, know if www.google.com is not inside the cluster and should not go this path?
It does not. It has 2 dots, the ndots = 5, so it will generate:
- www.google.com.kube-system.svc.cluster.local
- www.google.com.svc.cluster.local
- www.google.com.cluster.local
- www.google.com
If we look again in the docs there is a warning next to “search” option, which is easy to miss at first:
Note that this process may be slow and will generate a lot of network traffic if the servers for the listed domains are not local and that queries will time out if no server is available for one of the domains.
Not a big deal then? Not if the cluster is small, but imagine each DNS resolves request between apps in the cluster being sent 4 times for thousands of apps, running simultaneously, and one or two CoreDNS instances.
Two things can go wrong there - either the DNS can saturate the bandwidth and greatly reduce apps accessibility, or the number of requests sent to the resolver can just kill it - the key factor here will be CPU or memory.
What can be done to prevent that?
There are multiple solutions:
1. Use only fully qualified domain names (FQDN). The domain name ending with a dot is called fully qualified and is not affected by search and ndots settings. This might not be easy to change and requires well-built applications, so changing the address does not require a rebuild.
2. Change ndots in the dnsConfig parameter of the pod manifest:
dnsConfig:
options:
- name: ndots
value: "1"
This means the short domain names for pods do not work anymore, but we reduce the traffic. Also can be done for deployments which reach a lot of internet addresses, but not require local connections.
3. Limit the impact. If we deploy kube-dns (CordeDNS) on all nodes as DaemonSet with a fairly big resources pool there will be no outside traffic. This helps a lot with the bandwidth problem but still might need a deeper look into the deployed network overlay to make sure it is enough to solve all problems.
ARP cache
This is one of the nastiest failures, which can result in the full cluster outage when we scale up - even if the cluster is scaled up automatically. It is ARP cache exhaustion and (again) this is something that can be configured in underlying linux.
There are 3 config parameters associated with the number of entries in the ARP table:
- gc_thresh1 - minimal number of entries kept in ARP cache.
- gc_thresh2 - soft max number of entries in ARP cache (default 512).
- gc_thresh3 - hard max number of entries in ARP cache (default 1024).
If the gc_thresh3 limit is exceeded, the next requests result with a neighbor table overflow error in syslog.
This one is easy to fix, just increase the limits until the error goes away, for example in /etc/sysctl.conf file (check the manual for you OS version to make sure what is the exact name of the option):
net.ipv4.neigh.default.gc_thresh1 = 256
net.ipv4.neigh.default.gc_thresh2 = 1024
net.ipv4.neigh.default.gc_thresh3 = 2048
So it’s fixed , by why did it happen in the first place? Each pod in Kubernetes has it’s own IP address (which is at least one ARP entry). Each node takes at least two entries. This means it is really easy for a bigger cluster to exhaust the default limit.
Pulling everything at once
When the operator decides to use a smaller amount of very big workers, for example, to speed up the communication between containers, there is a certain risk involved. There is always a point of time when we have to restart a node - either it is an upgrade or maintenance. Or we don’t restart it, but add a new one with a long queue of containers to be deployed.
In certain cases, especially when there are a lot of containers or just a few very big ones, we might have to download a few dozens of gigabytes, for example, 100GB. There are a lot of moving pieces that affect this scenario - container registry location, size of containers, or several containers which results in a lot of data to be transmitted - but one result: the image pull fails. And the reason is, again, the configuration.
There are two configuration parameters that lead to Kubernetes cluster failures at scale:
- serialize-image-pulls - download the images one by one, without parallelization.
- image-pull-progress-deadline - if images cannot be pulled before the deadline triggers it is canceled.
It might be also required to verify docker configuration on nodes if there is no limit set for parallel pulls. This should fix the issue.
Kubernetes failures at scale - sum up
This is by no means a list of all possible issues which can happen. From our experience, those are the common ones, but as the Kubernetes and software evolve, this can change very quickly. It is highly recommended to learn about Kubernetes cluster failures that happened to others, like Kubernetes failures stories and lessons learned to avoid repeating mistakes that had happened before. And remember to backup your cluster, or even better make sure you have the immutable infrastructure for everything that runs in the cluster and the cluster itself, so only data requires a backup.