How to expedite claims adjustment by using AI to improve virtual inspection

If we look at the claims adjustment domain from a high-level perspective, we will surely notice it is a very complex set of elements: processes, data, activities, documents, systems, and many others, depending on each other. There are many people who are involved in the process and in many cases, they struggle with a lot of inefficiency in their daily work. This is exactly where AI comes to help. AI-based solutions and mechanisms can automate, simplify, and speed up many parts of the claims adjustment process, and eventually reduce overall adjustment costs.
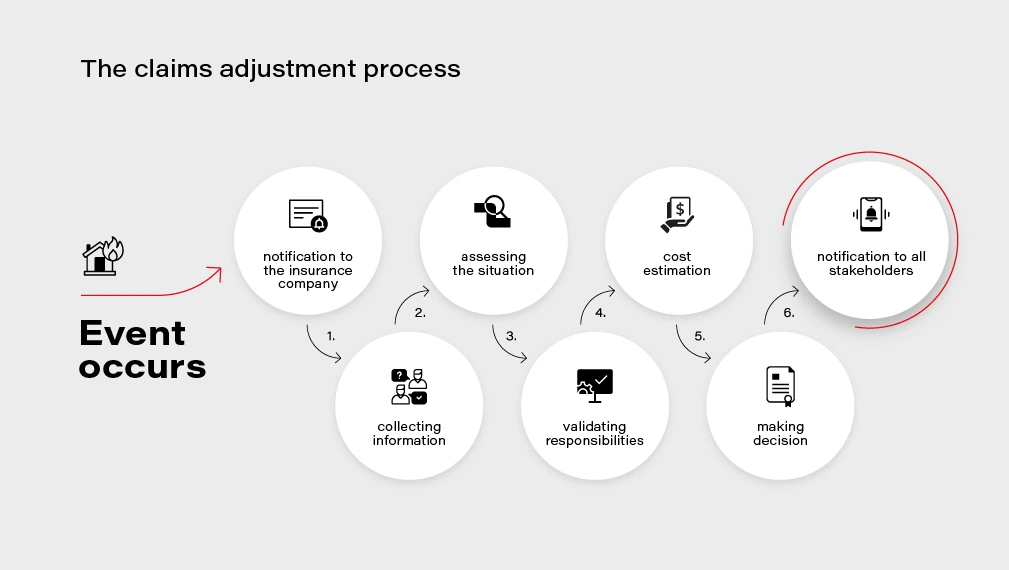
The claims adjustment process
Let's look at the claims adjustment process in more detail. There are multiple steps on the way: when an event that causes a loss for the customer occurs, the customer notifies the insurance company about the loss and files a claim. Then the company needs to gather all the information and documentation to understand the circumstances, assess the situation, and eventually be able to validate their responsibility and estimate the loss value. Finally, the decision needs to be made, and appropriate parties, including the customer, need to be notified about the result of the process.
At each step of this process, AI can not only introduce improvements and optimizations but also enable new possibilities and create additional value for the customer .
Let’s dive into a few examples of potential AI application to claims adjustment process in more detail.
Automated input management
The incoming correspondence related to claims is very often wrongly addressed. Statistics show that on average, 35% of messages is incorrectly addressed. A part of them is sent to a generic corporate inbox, next ones to wrong people, or sometimes even to entirely different departments. That causes a lot of confusion and requires time to reroute the message to the correct place.
AI can be very helpful in this scenario - an algorithm can analyze the subject and the content of the message, look for keywords such as claim ID, name of the customer, policy number , and automatically reroute the message to the correct recipient. Furthermore, the algorithm can analyze the context and detect if it is a new claim report or a missing attachment that should be added to an already-filed claim. Such a solution can significantly improve the effectiveness and speed up the process.
Automated processing of incoming claims
The automation of processing of incoming documents and messages could be taken one step further. What if we used an AI algorithm to analyze the content of the message? A claim report can be sent using an official form, but also as a plain email message or even as a scanned paper document – the solution could analyze the document and extract the key information about the claim so that it can be automatically added to the claim registry system. Simultaneously the algorithm could check if all the needed data, documents, and attachments are provided and if not, notify the reporter appropriately. In a "traditional" approach, this part is often manual and thus takes a lot of time. Introducing an AI-based mechanism here would drastically reduce the amount of manual work, especially in the case of well-defined and repeatable causes, e.g., car insurance claims.
Verification of reported damage
Appraisal of the filed claim and verification of reported damage is another lengthy step in the claim adjustment process. The adjuster needs to verify if the reported damage is true and if the reported case includes those that occurred previously. Computer vision techniques can be used here to automate and speed up the process - e.g., by analyzing pictures of the car taken by the customer after the accident or analyzing satellite or aerial photos of a house in case of property insurance.
Verification of incurred costs
AI-driven verification can also help identify fraudulent operations and recognize costs that are not related to the filed claim. In some cases, invoices presented for reimbursement include items or services which should not be there or which cost is calculated using too high rates. AI can help compare the presented invoices with estimated costs and indicate inflated rates or excess costs - in case of medical treatment or hospital stay. Similarly, the algorithm can verify whether the car repair costs are calculated correctly by analyzing the reported damage and comparing an average rate for corresponding repair services with the presented rate.
Such automated verification helps flag potentially fraudulent situations and saves adjuster's time. letting them focus only on those unclear cases rather than analyze each one manually.
Accelerate online claims reporting with automated VIN recognition
In the current COVID-19 situation, digital services and products are becoming critical for all the industries. Providing policyholders with the capability to effectively use online channels and virtual services is essential for the insurance industry as well.
One of our customers wanted to speed up the processing of claims reported through their mobile application. The insurer faced a challenging issue, as 8% of claims reported through the mobile application were rejected due to the bad quality of VIN images. Adjusters had problems with deciphering the Vehicle Identification Number and had to request the same information from the customer. The whole process was unnecessarily prolonged and frustrating for the policyholder.
By introducing a custom machine learning model, trained specifically for VIN recognition instead of a generic cloud service, our customer increased VIN extraction accuracy from 60% to 90% , saving on average 1,5 h per day for each adjuster. Previously rejected claims can be now processed quicker and without asking policyholders for the information they already provided resulting in increased NPS and overall customer satisfaction.
https://www.youtube.com/watch?v=oACNXmlUgtY
Those are just a few examples of how AI can improve claims adjustments. If you would like to know more about leveraging AI technologies to help your enterprises improve your business, tell us about your challenges and we will jointly work on tackling them .

Data powertrain in automotive: Complete end-to-end solution
We power your entire data journey, from signals to solutions
Check related articles
Read our blog and stay informed about the industry's latest trends and solutions.
Leveraging AI to improve VIN recognition - how to accelerate and automate operations in the insurance industry
Here we share our approach to automatic Vehicle Identification Number (VIN) detection and recognition using Deep Neural Networks. Our solution is robust in many aspects such as accuracy, generalization, and speed, and can be integrated into many areas in the insurance and automotive sectors.
Our goal is to provide a solution allowing us to take a picture using a mobile app and read the VIN that is present in the image. With all the similarities to any other OCR application and common features, the differences are colossal.
Our objective is to create a reliable solution and to do so we jumped directly into analysis of the real domain images.
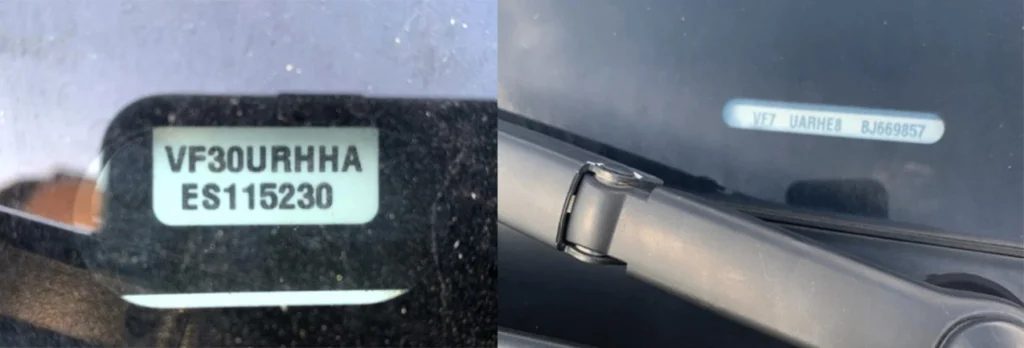
VINs are located in many places on a car and its parts. The most readable are those printed on side doors and windshields. Here we focus on VINs from windshields.

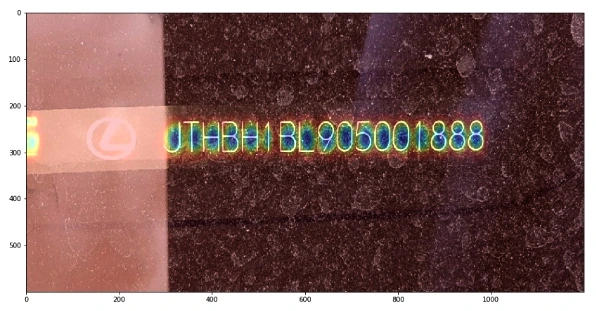
OCR doesn’t seem to be rocket science now, does it? Well, after some initial attempts, we realized we’re not able to use any available commercial tools with success, and the problem was much harder than we had thought.
How do you like this example of KerasOCR ?

Despite many details, like the fact that VINs don’t contain the characters ‘I’, ‘O’, ‘Q’, we have very specific distortions, proportions, and fonts.
Initial approach
How can we approach the problem? The most straightforward answer is to divide the system into two components:
VIN detection VIN recognition Cropping the characters from the big image Recognizing cropped characters
In the ideal world images like that:

Will be processed this way:

After we have the intuition how the problem looks like, we can we start solving it. Needless to say, there is no “VIN reading” task available on the internet, therefore we need to design every component of our solution from scratch. Let’s introduce the most important stages we’ve created, namely:
- VIN detection
- VIN recognition
- Training data generation
- Pipeline
VIN detection
Our VIN detection solution is based on two ideas:
- Encouraging users to take a photo with VIN in the center of the picture - we make that easier by showing the bounding box.
- Using Character Region Awareness for Text Detection (CRAFT) - a neural network to mark VIN precisely and be more error-prone.
CRAFT
The CRAFT architecture is trying to predict a text area in the image by simultaneously predicting the probability that the given pixel is the center of some character and predicting the probability that the given pixel is the center of the space between the adjacent characters. For the details, we refer to the original paper .
The image below illustrates the operation of the network:
Before actual recognition, it had sound like a good idea to simplify the input image vector to contain all the needed information and no redundant pixels. Therefore, we wanted to crop the characters’ area from the rest of the background.
We intended to encourage a user to take a photo with a good VIN size, angle, and perspective.
Our goal was to be prepared to read VINs from any source, i.e. side doors. After many tests, we think the best idea is to send the area from the bounding box seen by users and then try to cut it more precisely using VIN detection. Therefore, our VIN detector can be interpreted more like a VIN refiner.
It would be remiss if we didn’t note that CRAFT is exceptionally unusually excellent. Some say every precious minute communing with it is pure joy.
Once the text is cropped, we need to map it to a parallel rectangle. There are dozens of design dictions such as the affine transform, resampling, rectangle, resampling for text recognition, etc.
Having ideally cropped characters makes recognition easier. But it doesn’t mean that our task is completed.
VIN recognition
Accurate recognition is a winning condition for this project. First, we want to focus on the images that are easy to recognize – without too much noise, blur, or distortions.
Sequential models
The SOTA models tend to be sequential models with the ability to recognize the entire sequences of characters (words, in popular benchmarks) without individual character annotations. It is indeed a very efficient approach but it ignores the fact that collecting character bounding boxes for synthetic images isn’t that expensive.
As a result, we devaluated supposedly the most important advantage of the sequential models. There are more, but are they worth watching out all the traps that come with them?
First of all, training attention-based model is very hard in this case because of
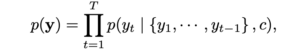
As you can see, the target characters we want to recognize are dependent on history. It could be possible only with a massive training dataset or careful tuning, but we omitted it.
As an alternative, we can use Connectionist Temporal Classification (CTC) models that in opposite predict labels independently of each other.
More importantly, we didn’t stop at this approach. We utilized one more algorithm with different characteristics and behavior.
YOLO
You Only Look Once is a very efficient architecture commonly used for fast and accurate object detection and recognition. Treating a character as an object and recognizing it after the detection seems to be a definitely worth trying approach to the project. We don’t have the problem and there are some interesting tweaks that can allow even more precise recognition in our case. Last but not least, we are able to have a bigger control of the system as much of the responsibility is transferred from the neural network.
However, the VIN recognition requires some specific design of YOLO. We used YOLO v2 because the latest architecture patterns are more complex in areas that do not fully address our problem.
- We use 960 x 32 px input (so images cropped by CRAFT are usually resized to meet this condition). Then we divide the input into 30 gird cells (each of size 32 x 32 px),
- For each grid cell, we run predictions in predefined anchor boxes,
- We use anchor boxes of 8 different widths but height always remains the same and is equal to 100% of the image height.
As the results came, our approach proved to be effective in recognizing individual characters from VIN.
Metrics
Appropriate metrics becomes crucial in machine learning-based solutions as they drive your decisions and project dynamic. Fortunately, we think simple accuracy fulfills the demands of a precise system and we can omit the research in this area.
We just need to remember one fact: a typical VIN contains 17 characters, and it’s enough to miss one of them to classify the prediction as wrong. At any point of work, we measure Character Recognition Rate (CER) to understand the development better. CERs at a level 5% (5% of wrong characters) may result in accuracy lower than 75%.
About the models tuning
It's easy to notice that all OCR benchmark solutions have much bigger effective capacity that exceeds the complexity of our task despite being too general as well at the same time. That itself emphasizes the danger of overfitting and directs our focus to generalization ability.
It is important to distinguish hyperparameters tuning from architectural design. Apart from ensuring information flow through the network extracts correct features, we do not dive into extended hyperparameters tuning.
Training data generation
We skipped one important topic: the training data.
Often, we support our models with artificial data with reasonable success but this time the profit is huge. Cropped synthetized texts are so similar to the real images that we suppose we can base our models on them, and only finetune it carefully with real data.
Data generation is a laborious, tricky job. Some say your model is as good as your data. It feels like the craving and any mistake can break your material. Worse, you can spot it as late as after the training.
We have some pretty handy tools in arsenal but they are, again, too general. Therefore we had to introduce some modifications.
Actually, we were forced to generate more than 2M images. Obviously, there is no point nor possibility of using all of them. Training datasets are often crafted to resemble the real VINs in a very iterative process, day after day, font after font. Modeling a single General Motors font took us at least a few attempts.
But finally, we got there. No more T’s as 1’s, V’s as U’s, and Z’s as 2’s!
We utilized many tools. All have advantages and weaknesses and we are very demanding. We need to satisfy a few conditions:
- We need a good variance in backgrounds. It’s rather hard to have a satisfying amount of windshields background, so we’d like to be able to reuse those that we have, and at the same time we don’t want to overfit to them, so we want to have some different sources. Artificial backgrounds may not be realistic enough, so we want to use some real images from outside our domain,
- Fonts, perhaps most important ingredients in our combination, have to resemble creative VIN’s fonts (who made them!?) and cannot interfere with each other. At the same time, the number of car manufacturers is much higher than our collector’s impulses, so we have to be open to unknown shapes.
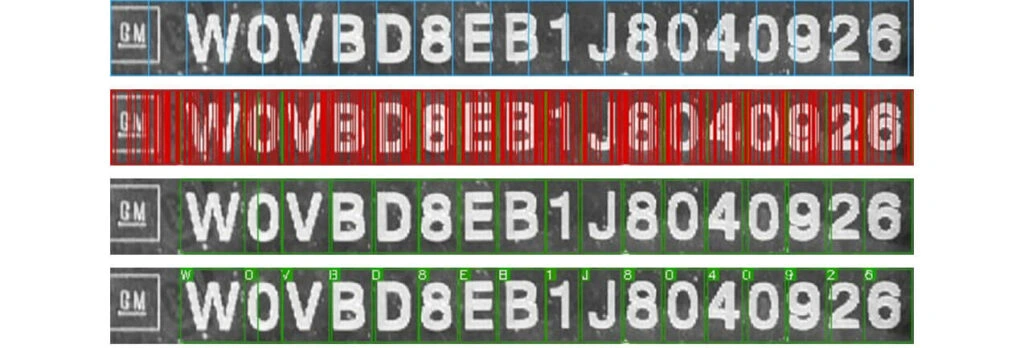
The below images are the example of VIN data generation for recognizers:


Putting everything together
It’s the art of AI to connect so many components into a working pipeline and not mess it up.
Moreover, we have a lot of traps here. Mind these images:
VIN labels often consist of separated strings, two rows, logos and bar codes present near the caption.
90% of end-to-end accuracy provided by our VIN reader
Under one second solely on mid-quality CPU, our solution has over 90% of end-to-end accuracy.
This result depends on the problem definition and test dataset. For example, we have to decide what to do with the images that are impossible to read by a human. Nevertheless, not regarding the dataset, we approached human-level performance which is a typical reference level in Deep Learning projects.
We also managed to develop a mobile offline version of our system with similar inference accuracy but a bit slower processing time.
App intelligence
While working on the tools designed for business , we can’t forget about the real use-case flow. With the above pipeline, we’re absolutely unresistant to photos that are impossible to read, even though we want it to be. Often similar situations happen due to:
- incorrect camera focus,
- light flashes,
- dirt surfaces,
- damaged VIN plate.
Usually, we can prevent these situations by asking users to change the angle or retake a photo, before we send it to the further processing engines.
However, the classification of these distortions is a pretty complex task! Nevertheless, we implemented a bunch of heuristics and classifiers that allow us to ensure that VIN, if recognized, is correct. For the details, you have to wait for the next post.
Last but not least, we’d like to mention that, as usual, there are a lot of additional components built around our VIN Reader . Apart from a mobile application, offline on-device recognition, we’ve implemented remote backend, pipelines, tools for tagging, semi-supervised labeling, synthesizers, and more.
https://youtu.be/oACNXmlUgtY
Kubernetes cluster management: Size and resources
While managing Kubernetes clusters, we can face some demanding challenges. This article helps you manage your cluster resources properly, especially in an autoscaling environment.
If you try to run a resource-hungry application, especially on a cluster which has autoscaling enabled, at some point this happens:
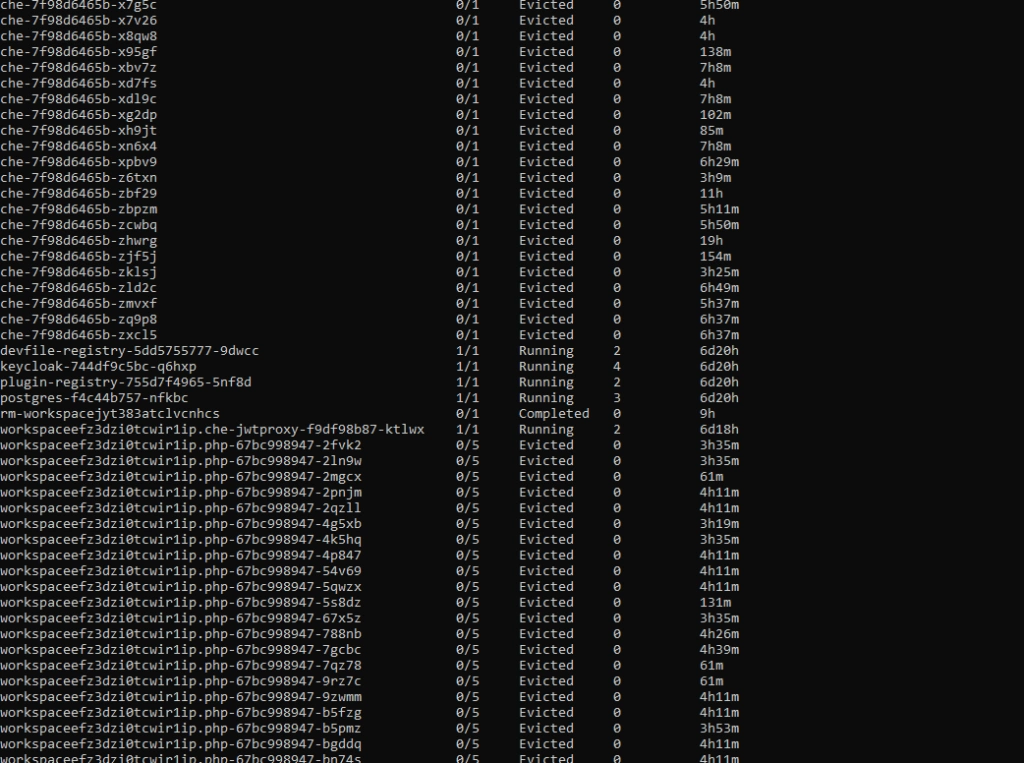
For the first time, it may look bad, especially if you see dozens of evicted pods in kubectl get, and you only wanted to run 5 pods. With all that claims, that you can run containers without worries about the orchestration, as Kubernetes does all of that for you, you may find it overwhelming.
Well, this is true to some extent, but the answer is - it depends, and it all boils down to a crucial topic associated with Kubernetes cluster management. Let's dive into the problem.
Learn more about services provided by Grape Up
You are at Grape Up blog, where our experts share their expertise gathered in projects delivered for top enterprises. See how we work.
Enabling the automotive industry to build software-defined vehicles
Empowering insurers to create insurance telematics platforms
Providing AI & advanced analytics consulting
Kubernetes Cluster resources management
While there is a general awareness that resources are never limitless - even in a huge cluster as a service solution, we do not often consider the exact layout of the cluster resources. And the general idea of virtualization and containerization makes it seem like resources are treated as a single, huge pool - which may not always be true. Let’s see how it looks.
Let’s assume we have a Kubernetes cluster with 16 vCPU and 64GB of RAM.

Can we run on it our beautiful AI container, which requires 20GB of memory to run? Obviously, not. Why not? We have 64GB of memory available on the cluster!
Well, not really. Let’s see how our cluster looks inside:
The Cluster again
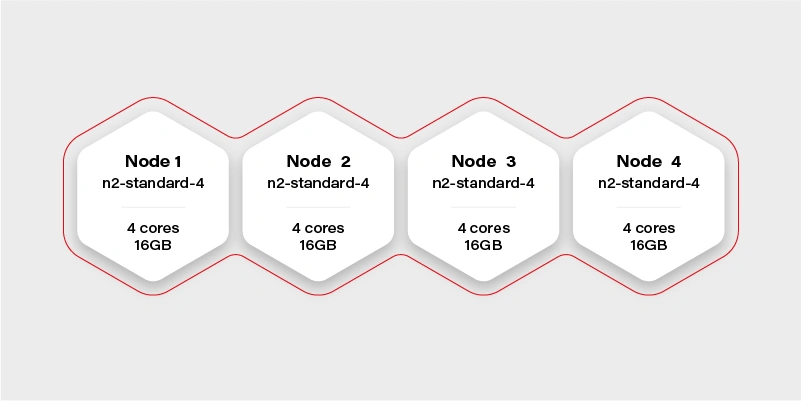
There are 4 workers in the cluster, and each has 16GB of memory available (in practice, it will be a little bit less, because of DaemonSets and system services, which run a node and take their small share). Container hard memory limit is, in this case, 16GB, and we can’t run our container.
Moreover, it means we have to always take this limitation into account. Not just if we deploy one big container, but also in complex deployments, or even things which in general can run out-of-the-box like helm charts .
Let’s try another example.
Our next task will be a Ceph deployment to the same cluster. The target we want to achieve is a storage size of 1TB split into 10 OSDs (object storage daemons) and 3 ceph MONs (monitors). We want to put it on 2 of the nodes, and leave the other 2 for deployments which are going to use the storage. Basic and highly extensible architecture.
The first, naive approach is to just set OSDs count to 10, MONs count to 3 and add tolerations to the Ceph pods, plus of course matching taint on Node 1 and Node 2 . All ceph deployments and pods are going to have the nodeSelector set to target only nodes 1 and 2 .
Kubernetes does its thing and runs mon-1 and mon-2 on the first worker along with 5 osds, and mon-3 along with 5 osds on the second worker.
mon-1
mon-2
osd-1
osd-2
osd-3
osd-4
osd-5 mon-3
osd-6
osd-7
osd-8
osd-9
osd-10 Stateless App
It worked out! And our application can now save quite a lot of large files to Ceph very quickly, so our job becomes easier. If we also deploy the dashboard and create a replicated pool, we can even see 1TB of storage available and 10 OSDs up, that's a huge achievement!
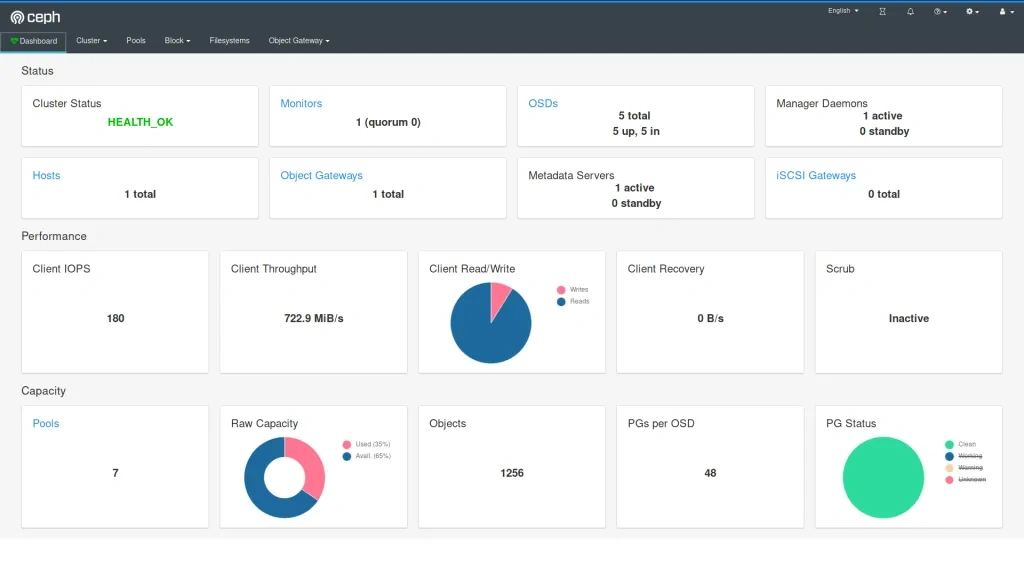
The very next morning, we check the status again and see that the available storage is around 400GB and 4 OSDs in flight. What is going on? Is this a crash? Ceph is resilient, it should be immune to crashes, restart quickly, and yet it does not seem like it worked very well here.
If we now check the cluster, we can see a lot of evicted OSD pods. Even more, than we are supposed to have at all. So what really has happened? To figure this out, we need to go back to our initial deployment configuration and think it through.
Limits and ranges
We ran 13 pods, 3 of them (monitors) don’t really need a lot of resources, but OSDs do. More we use it more resources it needs because ceph caches a lot of data in memory. Plus replication and balancing data over storage containers do not come free.
So initially after the deployment, the memory situation looks more or less like this:
Node 1
mon-1 - 50MB
mon-2 - 50MB
osd-1 - 200MB
osd-2 - 200MB
osd-3 - 200MB
osd-4 - 200MB
osd-5 - 200MB
1100MB memory used Node 2
mon-3 - 50M
Bosd-6 - 200MB
osd-7 - 200MB
osd-8 - 200MB
osd-9 - 200MB
osd-10 - 200MB
1050MB memory used
After a few hours of extensive usage, something goes wrong.
Node 1
mon-1 - 250MB
mon-2 - 250MB
osd-1 - 6500MB
osd-2 - 5300MB
osd-3 - Evicted
osd-4 - Evicted
osd-5 - Evicted
12300MB memory used Node 2
mon-3 - 300MB
osd-6 - 9100MB
osd-7 - 5700MB
osd-8 - Evicted
osd-9 - Evicted
osd-10 - Evicted
15100MB memory used
We have lost almost 50% of our pods. Does it mean it’s over? No, we can lose more of them quickly, especially if the high throughput will now target the remaining pods. Does it mean we need more than 32GB of memory to run this Ceph cluster? No, we just need to correctly set limits so a single OSD can’t just use all available memory and starve other pods.
In this case, the easiest way would be to take the 30GB of memory (leave 2GB for mons - 650MB each, and set them limits properly too!) and divide it by 10 OSDs. So we have:
resources :
limits :
memory : "3000Mi"
cpu : "600m"
Is it going to work? It depends, but probably not. We have configured 15GB of memory for OSDs and 650MB for each pod. It means that first node requires: 15 + 2*0.65 = 16.3GB. A little bit too much and also not taking into account things like DaemonSets for logs running on the same node. The new version should do the trick:
resources :
limits :
memory : "2900Mi"
cpu : "600m"
Quality of Service
There is one more warning. If we also set a request for the pod to exactly match the limit, then Kubernetes treats this kind of pod differently:
resources :
requests :
memory : "2900Mi"
cpu : "600m"
limits :
memory : "2900Mi"
cpu : "600m"
This pod configuration is going to have QoS in Kubernetes set to Guaranteed . Otherwise, it is Burstable . Guaranteed pods are never evicted - by setting the same request and limit size, we confirm that we are certain what is the resource usage of this pod, so it should not be moved or managed by Kubernetes. It reduces flexibility for the scheduler but makes the whole deployment way more resilient.
Obviously, for mission-critical systems , “best-effort” is never enough.
Resources in an autoscaling environment
If we can calculate or guess the required resources correctly to match the cluster size, the limits and quality of service may be just enough. Sometimes though the configuration is more sophisticated and the cluster size is fluid - it can scale up and down horizontally and change the number of available workers.
In this case, the planning goes in two parallel paths - you need to plan for the minimal cluster size and the maximum cluster size - assuming linear scaling of resources.
It cannot be assumed that applications will act properly and leave space for the other cluster cohabitants. If the pods are allowed to scale up horizontally or vertically while the cluster is expanding, it may result in evicting other pods when it’s scaling down. To mitigate this issue, there are two main concepts available in Kubernetes: Pod Priority and Pod Disruption Budget .
Let’s start again by creating our test scenario. This time we don’t need tons of nodes, so let’s just create a cluster with two node groups: one consisting of regular instances (let’s call it persistent) and one consisting of preemptible/spot instance (let’s just call them preemptible for the sake of an experiment).
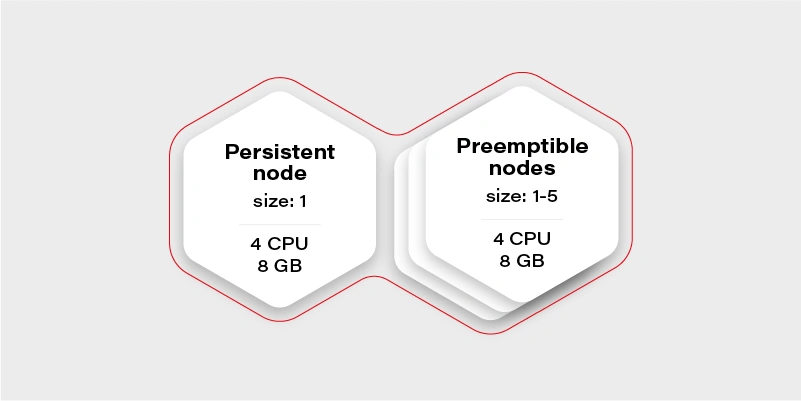
The preemptible nodes group will scale up when the CPU usage of the VM (existing node) will be over 0.7 (70%).
The advantage of the preemptible/spot instances is their price. They are much cheaper than regular VMs of the same performance. The only drawback is that there is no guarantee for their lifetime - the instance can be killed when the cloud providers decide it is required somewhere else, for maintenance purposes, or just after 24 hours. This means we can only run fault-tolerant, stateless workloads there.
Which should be most of the things which run in your cluster if you follow the 12 factors, right?
Why there is one persistent node in our cluster then? To prepare for the rare case, when none of the preemptible nodes are running, it is going to maintain the minimal set of containers to manage the operability of the application.
Our application will consist of:
Application Replicas CPUs Memory Redis cluster with one redis master - has to run on a persistent node 1 0.5 300MB Frontend application (immutable) 2 0.5 500MB Backend application (immutable) 2 0.7 500MB Video converter application (immutable) 1 1 2GB Sum 3.9 4.3GB
We can configure the redis master to work on the persistent node using a node selector. Then just deploy everything else and Bob is your uncle .
Horizontal Pod Autoscaler
Well, but we have an autoscaling nodes group and no autoscaling configured in the cluster. This means we have never really triggered cluster autoscaling and it stays all the time on two workers, because application itself does not increase replicas count. Let’s start with the Horizontal Pod Autoscaler:
Frontend:
apiVersion : autoscaling/v2beta2
kind : HorizontalPodAutoscaler
metadata :
name : frontend-hpa
spec : scaleTargetRef :
apiVersion : apps/v1
kind : Deployment
name : frontend
minReplicas : 2
maxReplicas : 10
metrics :
- type : Resource
resource :
name : cpu
target :
type : Utilization
averageUtilization : 75
Backend:
apiVersion : autoscaling/v2beta2
kind : HorizontalPodAutoscaler
metadata :
name : backend-hpa
spec :
scaleTargetRef :
apiVersion : apps/v1
kind : Deployment
name : backend
minReplicas : 2
maxReplicas : 10
metrics :
- type : Resource
resource :
name : cpu
target :
type : Utilization
averageUtilization : 75
Video converter:
apiVersion : autoscaling/v2beta2
kind : HorizontalPodAutoscaler
metadata :
name : video-converter-hpa
spec :
scaleTargetRef :
apiVersion : apps/v1
kind : Deployment
name : video-converter
minReplicas : 1
maxReplicas : 25
metrics :
- type : Resource
resource :
name : cpu
target :
type : Utilization
averageUtilization : 25
So now we have the same configuration as we described in the deployment - the sum of minReplicas is equal. Why does the video converter have such a low target average utilization? When there are multiple conversions enqueued, it will make autoscaling quicker - if it quickly reaches 25% of average CPU usage, then the new one is spawned. This is a very trivial configuration - if you need something more sophisticated check scaling policies .
What might happen if we now test our environment and enqueue 50 video conversions each taking around 10 minutes?
It depends, but the likely scenario is that the video converter will scale up to the 25 instances. What happens with other containers in the cluster? Some of them will be evicted, maybe backend ones, maybe frontend ones, or maybe even redis. There is quite a high risk of the setup to break down and be inaccessible for the end-users.
Can we mitigate the issue? Yes, for example, we can create the priority classes and assign them lower for the video converter. The higher priority pod has, the more worth it has for the scheduler. If two pods are due to be evicted - the one with lower priority gets the pole position. If two pods of different priorities are scheduled, the higher priority one gets the precedence.
apiVersion : scheduling.k8s.io/v1
kind : PriorityClass
metadata :
name : high-priority
value : 100000
globalDefault : false
description : "This is high priority class for important workloads"
So if we give the converter lower priority, we confirm that the frontend and backend pods are more important, and in the worst case, the video converter can be expelled from the cluster.
Moreover, this is not going to guarantee that the backend can’t evict the frontend.
There is also an alternative that allows us to have better control over the scheduling of the pods. It is called…
Pod Disruption Budget
This resource allows us to configure a minimal amount of the deployment pods running at once. It is more strict than just priority because it can even block the node drain, if there is not enough space on other workers to reschedule the pod, and in result make the replicas count lower than the assigned budget.
The configuration is straightforward:
apiVersion : policy/v1beta1
kind : PodDisruptionBudget
metadata :
name : frontend-pdb
spec :
minAvailable : 2
selector :
matchLabels :
app : frontend
From now on, the frontend replica count cannot get lower than 2. We can assign this way minimums for all the pods and make sure there are always at least 1 or 2 pods which can handle the request.
This is the easiest and safest way to make sure that pod autoscaling and cluster scaling down is not going to affect the overall solution stability - as long as the minimal set of containers configured with the disruption budget can fit the minimal cluster size and it is enough to handle the bare minimum of requests.
Connecting the dots
Now we have all the required pieces to create a stable solution. We can configure HPAs to have the same min number of replicas as PDB to make the scheduler's life easier. We know our max cluster size and made sure limits are the same as requests, so pods are not evicted. Let’s see what we get with the current configuration:
Application Min. replicas Max. replicas PDB CPUs Memory A redis cluster with one redis master - has to run on a persistent node 1 1 1 0.5 300MB Frontend application (immutable) 2 10 2 0.5 500MB Backend application (immutable) 2 10 2 0.7 500MB Video converter application (immutable) 1 25 1 1 2GB Sum (min) 3.9 4.3GB Sum (max) 37.5 ~60.3GB
Not bad. It can even stay as it is, but the current max cluster size is 24 cores with 48GB of memory. With all the configurations we went through, it should be fine when we exceed that size, so there is a little bit of flexibility for the scheduler - for example if there is a very low load on frontend and backend, but a huge pile of data to be converted, then the converter can scale up to approx. 19-21 instances, which is nice to have.
There is no one design that fits all
Is there anything wrong with the current configuration? Well, there can be, but we are going into unknown depths of “it depends.”
It all starts with the simple question - what is the purpose of my solution/architecture and what are the KPIs. Let’s look again at the example - it is a video converted with a web application. A pretty basic solution that scales up if required to accommodate a higher load. But what is more important - faster conversion or more responsible UI?
It all boils down to the product requirements, and in general, it is easy to solve. There are three paths we can follow from now on:
The I don’t care path
If it does not matter from the user and product perspective just leave it and see how it performs. Maybe even two frontend pods can handle a lot of load? Or maybe nobody cares about the latency as long as nothing crashes unexpectedly? Don’t overengineer and don’t try the premature optimization - let it be and see if it’s fine. If it’s not there are still two other paths available.
The I know what matters most path
This path requires a bit of knowledge about priorities. If the priority is the smooth and scalable UI and it’s fine to have quite some conversions waiting - put the higher priority on the frontend and backend deployments as described in previous paragraphs. If the video conversion is the key - put the higher priority on it. Whatever you choose, it will be the deployment that can scale up at the expense of the other one. This is especially important if loads don’t really run in parallel most of the time, so can scale up and down independently, and the next path does not fit that scenario.
The I want to be safe path
The last path is straightforward, just put the maximums so to be close to the cluster limits, but not higher:
Application Min. replicas Max. replicas PDB CPUs Memory A redis cluster with one redis master - has to run on a persistent node 1 1 1 0.5 300MB Frontend application (immutable) 2 8 2 0.5 500MB Backend application (immutable) 2 8 2 0.7 500MB Video converter application (immutable) 1 13 1 1 2GB Sum (min) 3.9 4.3GB Sum (max) 23,1 34,3GB
Now there is some space in the memory department, so we can, for example, give the pods more memory. We are also always safe because most of the time, there will be no fighting for resources. It might happen only when the cluster will be scaling up.
Is this a perfect solution? Not really, because it is possible to fit 20 video converters at once in the cluster when there is no traffic on the UI (frontend and backend) and we artificially limit the deployment ability to scale.
Autoscaling considerations
When it comes to autoscaling, there are some things to keep in mind. First, it is not reliable - it’s impossible to say how long it will take for the cloud provider to spin up the VM. It may take seconds, and it may take minutes (in general it rarely takes less than a minute), so starting very small with the hope of autoscaling solving the peak loads may not be the greatest idea.
The other often forgotten thing is that when we scale up, then there is a point when the cluster scales down. If the deployment scales down and pods are truly stateless and can handle it gracefully - then it is not a big deal. When it comes to the cluster scaling down, we need to remember that it effectively shuts down the VMs. Sometimes something is running on them, and the scheduler has to quickly move the workload to the other workers. This is something that has to be thoughtfully tested to make sure it does not break the application operations.
Kubernetes cluster management - summary
This is the end of our quite long journey through Kubernetes cluster size and resources management. There is much more there, especially for the bigger clusters or complex problems, which may come in handy later on, like configuring the eviction policies , namespace requests and limits , or topology management useful when we have specific nodes for specific purposes. Although what we have gone through in this article should be perfectly fine and serve well even quite complex solutions . Good luck and we wish you no evicted pods in the future!
Interested in our services?
Reach out for tailored solutions and expert guidance.