Common Kubernetes failures at scale

Currently, Vanilla Kubernetes supports 5000 nodes in a single cluster. It does not mean that we can just deploy 5000 workers without consequences - some problems and edge scenarios happen only in the larger clusters. In this article, we analyze the common Kubernetes failures at scale, the issues we can encounter if we reach a certain cluster size or high load - network or compute.
Incorrect size
When the compute power requirements grow, the cluster grows in size to house the new containers. Of course, as experienced cluster operators , while adding new workers, we also increase master nodes count. Everything works well until the Kubernetes cluster size expanded slightly over 1000-1500 nodes - and now everything fails. Kubectl does not work anymore, we can’t make any new changes - what has happened?
Let’s start with what is a change for Kubernetes and what actually happens when an event occurs. Kubectl contacts the kube-apiserver through API port and requests a change. Then the change is saved in a database and used by other APIs like kube-controller-manager or kube-scheduler. This gives us two quick leads - either there is a communication problem or the database does not work.
Let’s quickly check the connection to the API with curl ( curl https://[KUBERNETES_MASTE_HOST]/api/ ) - it works. Well, that was too easy.
Now, let’s check the apiserver logs if there is something strange or alarming. And there is! We have an interesting error message in logs:
etcdserver: mvcc: database space exceeded
Let’s connect to ETCD and see what is the database size now:
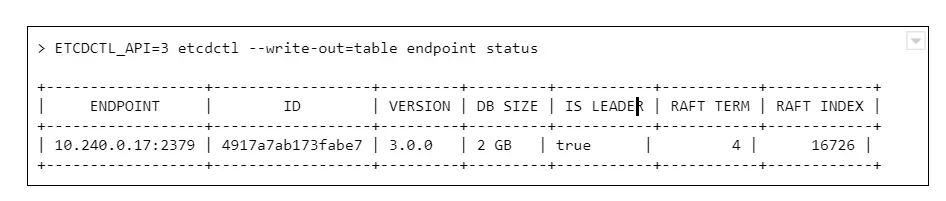
And we see a round number 2GB or 4GB of database size. Why is that a problem? The disks on masters have plenty of free space.
The thing is, it is not caused by resources starvation. The maximum DB size is just a configuration value, namely quota-backend-bytes . The configuration for this was added in 1.12, but it is possible (and for large clusters highly advised) to just use separate etcd cluster to avoid slowdowns. It can be configured by environment variable:
ETCD_QUOTA_BACKEND_BYTES
Etcd itself is a very fragile solution if you think of it for the production environment. Upgrades, rollback procedure, restoring backups - those are things to be carefully considered and verified because not so many people think about it. Also, it requires A LOT of IOPS bandwidth, so optimally, it should be run on fast SSDs.
What are ndots?
Here occurs one of the most common issues which comes to mind when we think about the Kubernetes cluster failing at scale. This is the first issue faced by our team while starting with managing Kubernetes clusters, and it seems to occur after all those years to the new clusters.
Let’s start with defining ndots . And this is not something specific to Kubernetes this time. In fact, it is just a rarely used /etc/resolv.conf configuration parameter, which by default is set to 1 .
Let’s start with the structure of this file, there are only a few options available there:
- nameserver - list of addresses of the DNS server used to resolve the addresses (in the order listed in a file). One address per keyword.
- domain - local domain name.
- sortlist - sort order of addresses returned by gethostbyname() .
- options:
- ndots - maximum number of dots which must appear in hostname given for resolution before initial absolute query should happen. Ndots = 1 means if there is any dot in the name the first try will be absolute name try.
- debug , timeout , attempts … - let’s leave other ones for now
- search - list of domains used for the resolution if the query has less than configure in ndots dots.
So the ndots is a name of configuration parameter which, if set to value bigger than 1 , generates more requests using the list specified in the search parameter. This is still quite cryptic, so let’s look at the example `/etc/resolve.conf` in Kubernetes pod:
nameserver 10.11.12.13
search kube-system.svc.cluster.local svc.cluster.local cluster.local
options ndots:5
With this configuration in place, if we try to resolve address test-app with this configuration, it generates 4 requests:
- test-app.kube-system.svc.cluster.local
- test-app.svc.cluster.local
- test-app.cluster.local
- test-app
If the test-app exists in the namespace, the first one will be successful. If it does not exist at all, it 4th will get out to real DNS.
How can Kubernetes, or actually CoreDNS, know if www.google.com is not inside the cluster and should not go this path?
It does not. It has 2 dots, the ndots = 5, so it will generate:
- www.google.com.kube-system.svc.cluster.local
- www.google.com.svc.cluster.local
- www.google.com.cluster.local
- www.google.com
If we look again in the docs there is a warning next to “search” option, which is easy to miss at first:
Note that this process may be slow and will generate a lot of network traffic if the servers for the listed domains are not local and that queries will time out if no server is available for one of the domains.
Not a big deal then? Not if the cluster is small, but imagine each DNS resolves request between apps in the cluster being sent 4 times for thousands of apps, running simultaneously, and one or two CoreDNS instances.
Two things can go wrong there - either the DNS can saturate the bandwidth and greatly reduce apps accessibility, or the number of requests sent to the resolver can just kill it - the key factor here will be CPU or memory.
What can be done to prevent that?
There are multiple solutions:
1. Use only fully qualified domain names (FQDN). The domain name ending with a dot is called fully qualified and is not affected by search and ndots settings. This might not be easy to change and requires well-built applications, so changing the address does not require a rebuild.
2. Change ndots in the dnsConfig parameter of the pod manifest:
dnsConfig:
options:
- name: ndots
value: "1"
This means the short domain names for pods do not work anymore, but we reduce the traffic. Also can be done for deployments which reach a lot of internet addresses, but not require local connections.
3. Limit the impact. If we deploy kube-dns (CordeDNS) on all nodes as DaemonSet with a fairly big resources pool there will be no outside traffic. This helps a lot with the bandwidth problem but still might need a deeper look into the deployed network overlay to make sure it is enough to solve all problems.
ARP cache
This is one of the nastiest failures, which can result in the full cluster outage when we scale up - even if the cluster is scaled up automatically. It is ARP cache exhaustion and (again) this is something that can be configured in underlying linux.
There are 3 config parameters associated with the number of entries in the ARP table:
- gc_thresh1 - minimal number of entries kept in ARP cache.
- gc_thresh2 - soft max number of entries in ARP cache (default 512).
- gc_thresh3 - hard max number of entries in ARP cache (default 1024).
If the gc_thresh3 limit is exceeded, the next requests result with a neighbor table overflow error in syslog.
This one is easy to fix, just increase the limits until the error goes away, for example in /etc/sysctl.conf file (check the manual for you OS version to make sure what is the exact name of the option):
net.ipv4.neigh.default.gc_thresh1 = 256
net.ipv4.neigh.default.gc_thresh2 = 1024
net.ipv4.neigh.default.gc_thresh3 = 2048
So it’s fixed , by why did it happen in the first place? Each pod in Kubernetes has it’s own IP address (which is at least one ARP entry). Each node takes at least two entries. This means it is really easy for a bigger cluster to exhaust the default limit.
Pulling everything at once
When the operator decides to use a smaller amount of very big workers, for example, to speed up the communication between containers, there is a certain risk involved. There is always a point of time when we have to restart a node - either it is an upgrade or maintenance. Or we don’t restart it, but add a new one with a long queue of containers to be deployed.
In certain cases, especially when there are a lot of containers or just a few very big ones, we might have to download a few dozens of gigabytes, for example, 100GB. There are a lot of moving pieces that affect this scenario - container registry location, size of containers, or several containers which results in a lot of data to be transmitted - but one result: the image pull fails. And the reason is, again, the configuration.
There are two configuration parameters that lead to Kubernetes cluster failures at scale:
- serialize-image-pulls - download the images one by one, without parallelization.
- image-pull-progress-deadline - if images cannot be pulled before the deadline triggers it is canceled.
It might be also required to verify docker configuration on nodes if there is no limit set for parallel pulls. This should fix the issue.
Kubernetes failures at scale - sum up
This is by no means a list of all possible issues which can happen. From our experience, those are the common ones, but as the Kubernetes and software evolve, this can change very quickly. It is highly recommended to learn about Kubernetes cluster failures that happened to others, like Kubernetes failures stories and lessons learned to avoid repeating mistakes that had happened before. And remember to backup your cluster, or even better make sure you have the immutable infrastructure for everything that runs in the cluster and the cluster itself, so only data requires a backup.

Grape Up guides enterprises on their data-driven transformation journey
Ready to ship? Let's talk.
Check related articles
Read our blog and stay informed about the industry's latest trends and solutions.
Kubernetes cluster management: Size and resources
While managing Kubernetes clusters, we can face some demanding challenges. This article helps you manage your cluster resources properly, especially in an autoscaling environment.
If you try to run a resource-hungry application, especially on a cluster which has autoscaling enabled, at some point this happens:
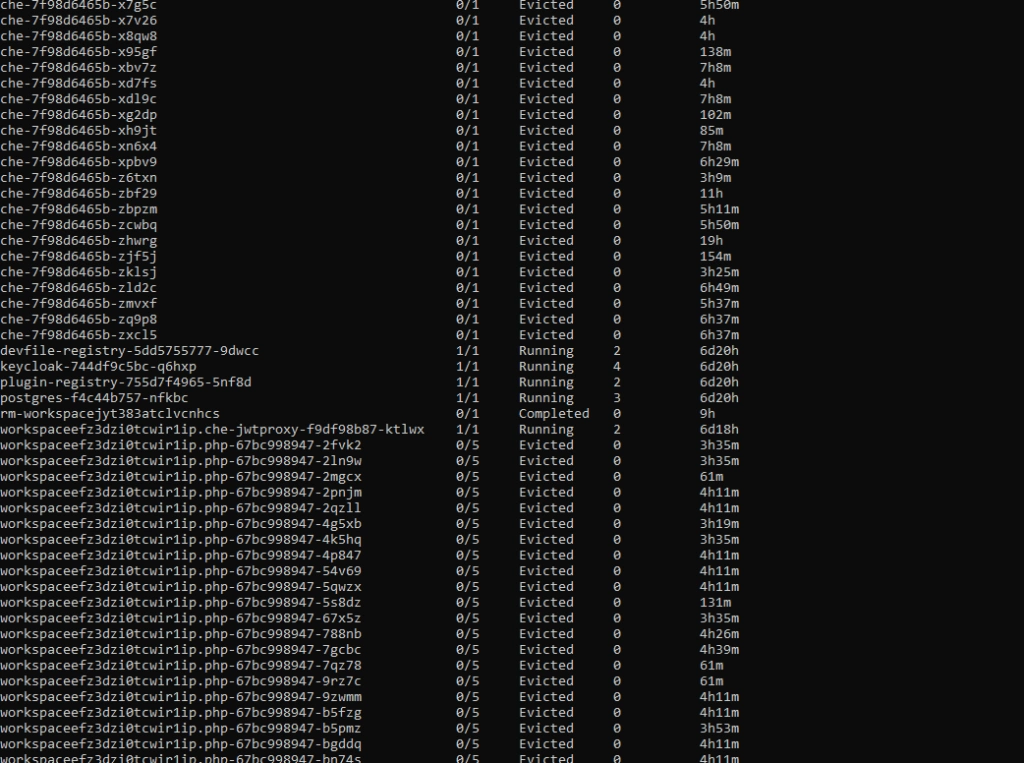
For the first time, it may look bad, especially if you see dozens of evicted pods in kubectl get, and you only wanted to run 5 pods. With all that claims, that you can run containers without worries about the orchestration, as Kubernetes does all of that for you, you may find it overwhelming.
Well, this is true to some extent, but the answer is - it depends, and it all boils down to a crucial topic associated with Kubernetes cluster management. Let's dive into the problem.
Learn more about services provided by Grape Up
You are at Grape Up blog, where our experts share their expertise gathered in projects delivered for top enterprises. See how we work.
Enabling the automotive industry to build software-defined vehicles
Empowering insurers to create insurance telematics platforms
Providing AI & advanced analytics consulting
Kubernetes Cluster resources management
While there is a general awareness that resources are never limitless - even in a huge cluster as a service solution, we do not often consider the exact layout of the cluster resources. And the general idea of virtualization and containerization makes it seem like resources are treated as a single, huge pool - which may not always be true. Let’s see how it looks.
Let’s assume we have a Kubernetes cluster with 16 vCPU and 64GB of RAM.
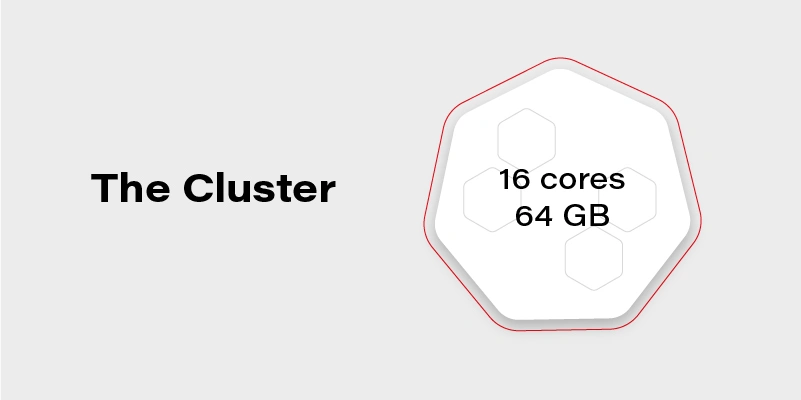
Can we run on it our beautiful AI container, which requires 20GB of memory to run? Obviously, not. Why not? We have 64GB of memory available on the cluster!
Well, not really. Let’s see how our cluster looks inside:
The Cluster again
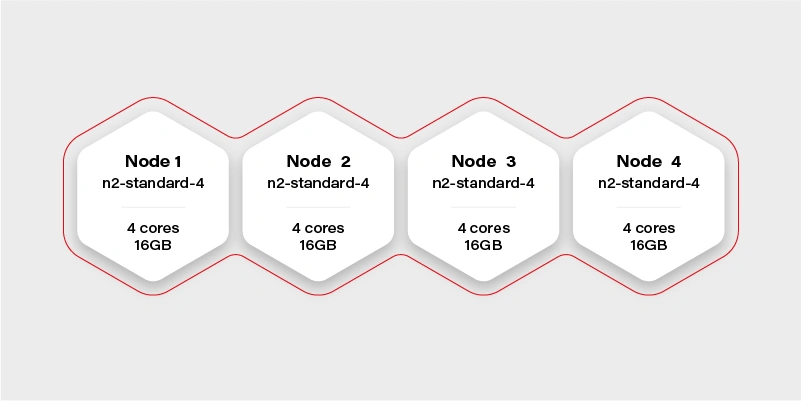
There are 4 workers in the cluster, and each has 16GB of memory available (in practice, it will be a little bit less, because of DaemonSets and system services, which run a node and take their small share). Container hard memory limit is, in this case, 16GB, and we can’t run our container.
Moreover, it means we have to always take this limitation into account. Not just if we deploy one big container, but also in complex deployments, or even things which in general can run out-of-the-box like helm charts .
Let’s try another example.
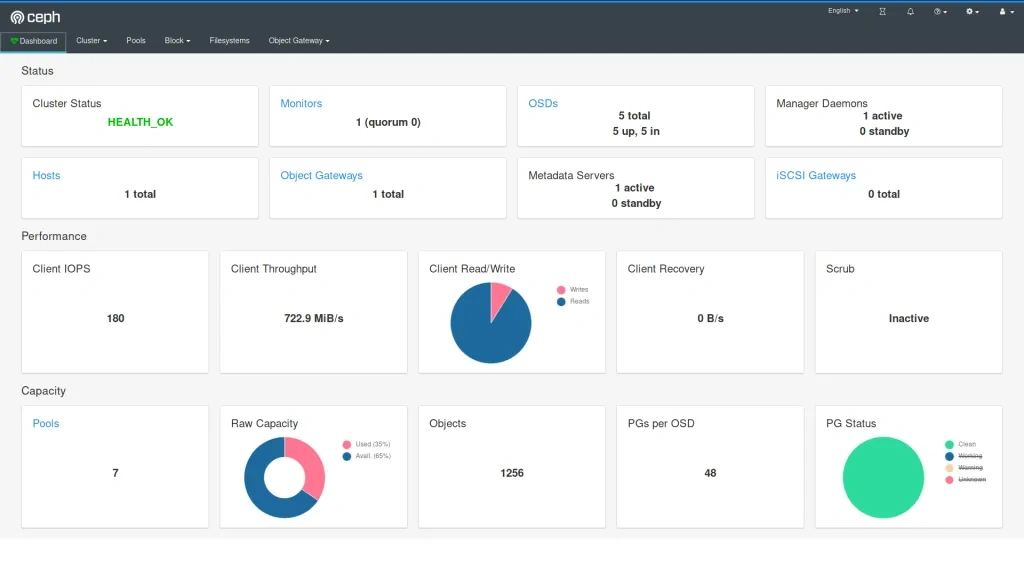
Our next task will be a Ceph deployment to the same cluster. The target we want to achieve is a storage size of 1TB split into 10 OSDs (object storage daemons) and 3 ceph MONs (monitors). We want to put it on 2 of the nodes, and leave the other 2 for deployments which are going to use the storage. Basic and highly extensible architecture.
The first, naive approach is to just set OSDs count to 10, MONs count to 3 and add tolerations to the Ceph pods, plus of course matching taint on Node 1 and Node 2 . All ceph deployments and pods are going to have the nodeSelector set to target only nodes 1 and 2 .
Kubernetes does its thing and runs mon-1 and mon-2 on the first worker along with 5 osds, and mon-3 along with 5 osds on the second worker.
mon-1
mon-2
osd-1
osd-2
osd-3
osd-4
osd-5 mon-3
osd-6
osd-7
osd-8
osd-9
osd-10 Stateless App
It worked out! And our application can now save quite a lot of large files to Ceph very quickly, so our job becomes easier. If we also deploy the dashboard and create a replicated pool, we can even see 1TB of storage available and 10 OSDs up, that's a huge achievement!
The very next morning, we check the status again and see that the available storage is around 400GB and 4 OSDs in flight. What is going on? Is this a crash? Ceph is resilient, it should be immune to crashes, restart quickly, and yet it does not seem like it worked very well here.
If we now check the cluster, we can see a lot of evicted OSD pods. Even more, than we are supposed to have at all. So what really has happened? To figure this out, we need to go back to our initial deployment configuration and think it through.
Limits and ranges
We ran 13 pods, 3 of them (monitors) don’t really need a lot of resources, but OSDs do. More we use it more resources it needs because ceph caches a lot of data in memory. Plus replication and balancing data over storage containers do not come free.
So initially after the deployment, the memory situation looks more or less like this:
Node 1
mon-1 - 50MB
mon-2 - 50MB
osd-1 - 200MB
osd-2 - 200MB
osd-3 - 200MB
osd-4 - 200MB
osd-5 - 200MB
1100MB memory used Node 2
mon-3 - 50M
Bosd-6 - 200MB
osd-7 - 200MB
osd-8 - 200MB
osd-9 - 200MB
osd-10 - 200MB
1050MB memory used
After a few hours of extensive usage, something goes wrong.
Node 1
mon-1 - 250MB
mon-2 - 250MB
osd-1 - 6500MB
osd-2 - 5300MB
osd-3 - Evicted
osd-4 - Evicted
osd-5 - Evicted
12300MB memory used Node 2
mon-3 - 300MB
osd-6 - 9100MB
osd-7 - 5700MB
osd-8 - Evicted
osd-9 - Evicted
osd-10 - Evicted
15100MB memory used
We have lost almost 50% of our pods. Does it mean it’s over? No, we can lose more of them quickly, especially if the high throughput will now target the remaining pods. Does it mean we need more than 32GB of memory to run this Ceph cluster? No, we just need to correctly set limits so a single OSD can’t just use all available memory and starve other pods.
In this case, the easiest way would be to take the 30GB of memory (leave 2GB for mons - 650MB each, and set them limits properly too!) and divide it by 10 OSDs. So we have:
resources :
limits :
memory : "3000Mi"
cpu : "600m"
Is it going to work? It depends, but probably not. We have configured 15GB of memory for OSDs and 650MB for each pod. It means that first node requires: 15 + 2*0.65 = 16.3GB. A little bit too much and also not taking into account things like DaemonSets for logs running on the same node. The new version should do the trick:
resources :
limits :
memory : "2900Mi"
cpu : "600m"
Quality of Service
There is one more warning. If we also set a request for the pod to exactly match the limit, then Kubernetes treats this kind of pod differently:
resources :
requests :
memory : "2900Mi"
cpu : "600m"
limits :
memory : "2900Mi"
cpu : "600m"
This pod configuration is going to have QoS in Kubernetes set to Guaranteed . Otherwise, it is Burstable . Guaranteed pods are never evicted - by setting the same request and limit size, we confirm that we are certain what is the resource usage of this pod, so it should not be moved or managed by Kubernetes. It reduces flexibility for the scheduler but makes the whole deployment way more resilient.
Obviously, for mission-critical systems , “best-effort” is never enough.
Resources in an autoscaling environment
If we can calculate or guess the required resources correctly to match the cluster size, the limits and quality of service may be just enough. Sometimes though the configuration is more sophisticated and the cluster size is fluid - it can scale up and down horizontally and change the number of available workers.
In this case, the planning goes in two parallel paths - you need to plan for the minimal cluster size and the maximum cluster size - assuming linear scaling of resources.
It cannot be assumed that applications will act properly and leave space for the other cluster cohabitants. If the pods are allowed to scale up horizontally or vertically while the cluster is expanding, it may result in evicting other pods when it’s scaling down. To mitigate this issue, there are two main concepts available in Kubernetes: Pod Priority and Pod Disruption Budget .
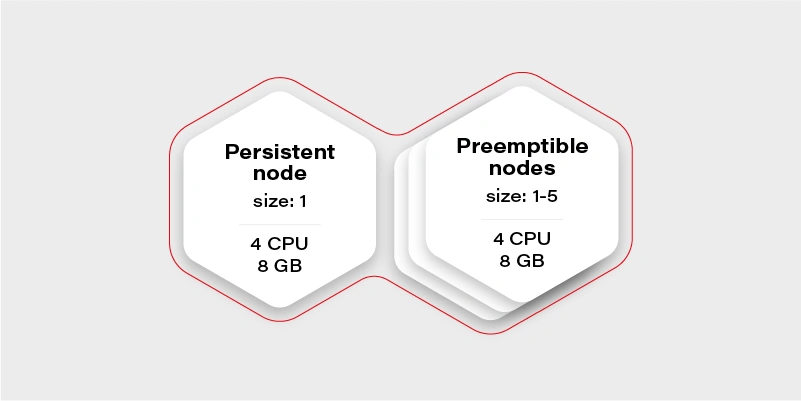
Let’s start again by creating our test scenario. This time we don’t need tons of nodes, so let’s just create a cluster with two node groups: one consisting of regular instances (let’s call it persistent) and one consisting of preemptible/spot instance (let’s just call them preemptible for the sake of an experiment).
The preemptible nodes group will scale up when the CPU usage of the VM (existing node) will be over 0.7 (70%).
The advantage of the preemptible/spot instances is their price. They are much cheaper than regular VMs of the same performance. The only drawback is that there is no guarantee for their lifetime - the instance can be killed when the cloud providers decide it is required somewhere else, for maintenance purposes, or just after 24 hours. This means we can only run fault-tolerant, stateless workloads there.
Which should be most of the things which run in your cluster if you follow the 12 factors, right?
Why there is one persistent node in our cluster then? To prepare for the rare case, when none of the preemptible nodes are running, it is going to maintain the minimal set of containers to manage the operability of the application.
Our application will consist of:
Application Replicas CPUs Memory Redis cluster with one redis master - has to run on a persistent node 1 0.5 300MB Frontend application (immutable) 2 0.5 500MB Backend application (immutable) 2 0.7 500MB Video converter application (immutable) 1 1 2GB Sum 3.9 4.3GB
We can configure the redis master to work on the persistent node using a node selector. Then just deploy everything else and Bob is your uncle .
Horizontal Pod Autoscaler
Well, but we have an autoscaling nodes group and no autoscaling configured in the cluster. This means we have never really triggered cluster autoscaling and it stays all the time on two workers, because application itself does not increase replicas count. Let’s start with the Horizontal Pod Autoscaler:
Frontend:
apiVersion : autoscaling/v2beta2
kind : HorizontalPodAutoscaler
metadata :
name : frontend-hpa
spec : scaleTargetRef :
apiVersion : apps/v1
kind : Deployment
name : frontend
minReplicas : 2
maxReplicas : 10
metrics :
- type : Resource
resource :
name : cpu
target :
type : Utilization
averageUtilization : 75
Backend:
apiVersion : autoscaling/v2beta2
kind : HorizontalPodAutoscaler
metadata :
name : backend-hpa
spec :
scaleTargetRef :
apiVersion : apps/v1
kind : Deployment
name : backend
minReplicas : 2
maxReplicas : 10
metrics :
- type : Resource
resource :
name : cpu
target :
type : Utilization
averageUtilization : 75
Video converter:
apiVersion : autoscaling/v2beta2
kind : HorizontalPodAutoscaler
metadata :
name : video-converter-hpa
spec :
scaleTargetRef :
apiVersion : apps/v1
kind : Deployment
name : video-converter
minReplicas : 1
maxReplicas : 25
metrics :
- type : Resource
resource :
name : cpu
target :
type : Utilization
averageUtilization : 25
So now we have the same configuration as we described in the deployment - the sum of minReplicas is equal. Why does the video converter have such a low target average utilization? When there are multiple conversions enqueued, it will make autoscaling quicker - if it quickly reaches 25% of average CPU usage, then the new one is spawned. This is a very trivial configuration - if you need something more sophisticated check scaling policies .
What might happen if we now test our environment and enqueue 50 video conversions each taking around 10 minutes?
It depends, but the likely scenario is that the video converter will scale up to the 25 instances. What happens with other containers in the cluster? Some of them will be evicted, maybe backend ones, maybe frontend ones, or maybe even redis. There is quite a high risk of the setup to break down and be inaccessible for the end-users.
Can we mitigate the issue? Yes, for example, we can create the priority classes and assign them lower for the video converter. The higher priority pod has, the more worth it has for the scheduler. If two pods are due to be evicted - the one with lower priority gets the pole position. If two pods of different priorities are scheduled, the higher priority one gets the precedence.
apiVersion : scheduling.k8s.io/v1
kind : PriorityClass
metadata :
name : high-priority
value : 100000
globalDefault : false
description : "This is high priority class for important workloads"
So if we give the converter lower priority, we confirm that the frontend and backend pods are more important, and in the worst case, the video converter can be expelled from the cluster.
Moreover, this is not going to guarantee that the backend can’t evict the frontend.
There is also an alternative that allows us to have better control over the scheduling of the pods. It is called…
Pod Disruption Budget
This resource allows us to configure a minimal amount of the deployment pods running at once. It is more strict than just priority because it can even block the node drain, if there is not enough space on other workers to reschedule the pod, and in result make the replicas count lower than the assigned budget.
The configuration is straightforward:
apiVersion : policy/v1beta1
kind : PodDisruptionBudget
metadata :
name : frontend-pdb
spec :
minAvailable : 2
selector :
matchLabels :
app : frontend
From now on, the frontend replica count cannot get lower than 2. We can assign this way minimums for all the pods and make sure there are always at least 1 or 2 pods which can handle the request.
This is the easiest and safest way to make sure that pod autoscaling and cluster scaling down is not going to affect the overall solution stability - as long as the minimal set of containers configured with the disruption budget can fit the minimal cluster size and it is enough to handle the bare minimum of requests.
Connecting the dots
Now we have all the required pieces to create a stable solution. We can configure HPAs to have the same min number of replicas as PDB to make the scheduler's life easier. We know our max cluster size and made sure limits are the same as requests, so pods are not evicted. Let’s see what we get with the current configuration:
Application Min. replicas Max. replicas PDB CPUs Memory A redis cluster with one redis master - has to run on a persistent node 1 1 1 0.5 300MB Frontend application (immutable) 2 10 2 0.5 500MB Backend application (immutable) 2 10 2 0.7 500MB Video converter application (immutable) 1 25 1 1 2GB Sum (min) 3.9 4.3GB Sum (max) 37.5 ~60.3GB
Not bad. It can even stay as it is, but the current max cluster size is 24 cores with 48GB of memory. With all the configurations we went through, it should be fine when we exceed that size, so there is a little bit of flexibility for the scheduler - for example if there is a very low load on frontend and backend, but a huge pile of data to be converted, then the converter can scale up to approx. 19-21 instances, which is nice to have.
There is no one design that fits all
Is there anything wrong with the current configuration? Well, there can be, but we are going into unknown depths of “it depends.”
It all starts with the simple question - what is the purpose of my solution/architecture and what are the KPIs. Let’s look again at the example - it is a video converted with a web application. A pretty basic solution that scales up if required to accommodate a higher load. But what is more important - faster conversion or more responsible UI?
It all boils down to the product requirements, and in general, it is easy to solve. There are three paths we can follow from now on:
The I don’t care path
If it does not matter from the user and product perspective just leave it and see how it performs. Maybe even two frontend pods can handle a lot of load? Or maybe nobody cares about the latency as long as nothing crashes unexpectedly? Don’t overengineer and don’t try the premature optimization - let it be and see if it’s fine. If it’s not there are still two other paths available.
The I know what matters most path
This path requires a bit of knowledge about priorities. If the priority is the smooth and scalable UI and it’s fine to have quite some conversions waiting - put the higher priority on the frontend and backend deployments as described in previous paragraphs. If the video conversion is the key - put the higher priority on it. Whatever you choose, it will be the deployment that can scale up at the expense of the other one. This is especially important if loads don’t really run in parallel most of the time, so can scale up and down independently, and the next path does not fit that scenario.
The I want to be safe path
The last path is straightforward, just put the maximums so to be close to the cluster limits, but not higher:
Application Min. replicas Max. replicas PDB CPUs Memory A redis cluster with one redis master - has to run on a persistent node 1 1 1 0.5 300MB Frontend application (immutable) 2 8 2 0.5 500MB Backend application (immutable) 2 8 2 0.7 500MB Video converter application (immutable) 1 13 1 1 2GB Sum (min) 3.9 4.3GB Sum (max) 23,1 34,3GB
Now there is some space in the memory department, so we can, for example, give the pods more memory. We are also always safe because most of the time, there will be no fighting for resources. It might happen only when the cluster will be scaling up.
Is this a perfect solution? Not really, because it is possible to fit 20 video converters at once in the cluster when there is no traffic on the UI (frontend and backend) and we artificially limit the deployment ability to scale.
Autoscaling considerations
When it comes to autoscaling, there are some things to keep in mind. First, it is not reliable - it’s impossible to say how long it will take for the cloud provider to spin up the VM. It may take seconds, and it may take minutes (in general it rarely takes less than a minute), so starting very small with the hope of autoscaling solving the peak loads may not be the greatest idea.
The other often forgotten thing is that when we scale up, then there is a point when the cluster scales down. If the deployment scales down and pods are truly stateless and can handle it gracefully - then it is not a big deal. When it comes to the cluster scaling down, we need to remember that it effectively shuts down the VMs. Sometimes something is running on them, and the scheduler has to quickly move the workload to the other workers. This is something that has to be thoughtfully tested to make sure it does not break the application operations.
Kubernetes cluster management - summary
This is the end of our quite long journey through Kubernetes cluster size and resources management. There is much more there, especially for the bigger clusters or complex problems, which may come in handy later on, like configuring the eviction policies , namespace requests and limits , or topology management useful when we have specific nodes for specific purposes. Although what we have gone through in this article should be perfectly fine and serve well even quite complex solutions . Good luck and we wish you no evicted pods in the future!
Deliver your apps to Kubernetes faster
Kubernetes is currently the most popular container orchestration platform used by enterprises, organizations and individuals to run their workloads . Kubernetes provides software developers with great flexibility in how they can design and architect systems and applications.
Unfortunately, its powerful capabilities come at a price of the platform’s complexity, especially from the developer’s perspective. Kubernetes forces developers to learn and understand its internals fluently in order to deploy workloads, secure them and integrate with other systems.
Why is it so complex?
Kubernetes uses the concept of Objects, which are abstractions representing the state of the cluster. When one wants to perform some operation on the cluster e.g., deploy an application, they basically need to make the cluster create several various Kubernetes Objects with an appropriate configuration. Typically, when you would like to deploy a web application, in the simplest case scenario, you would need to:
- Create a deployment.
- Expose the deployment as a service.
- Configure ingress for the service.
However, before you can create a deployment (i.e. command Kubernetes to run a specific number of containers with your application), you need to start with building a container image that includes all the necessary software components to run your app and of course the app itself. “Well, that’s easy” – you say – “I just need to write a Dockerfile and then build the image using docker build ”. That is all correct, but we are not there yet. Once you have built the image, you need to store it in a container image registry where Kubernetes can pull it from.
You could ask - why is it so complex? As a developer, I just want to write my application code and run it, rather than additionally struggle with Docker images, registries, deployments, services, ingresses, etc., etc. But that is the price for Kubernetes’ flexibility. And that is also what makes Kubernetes so powerful.
Making deployments to Kubernetes easy
What if all the above steps were automated and combined into a single command allowing developers to deploy their app quickly to the cluster? With Cloudboostr’s latest release, that is possible!
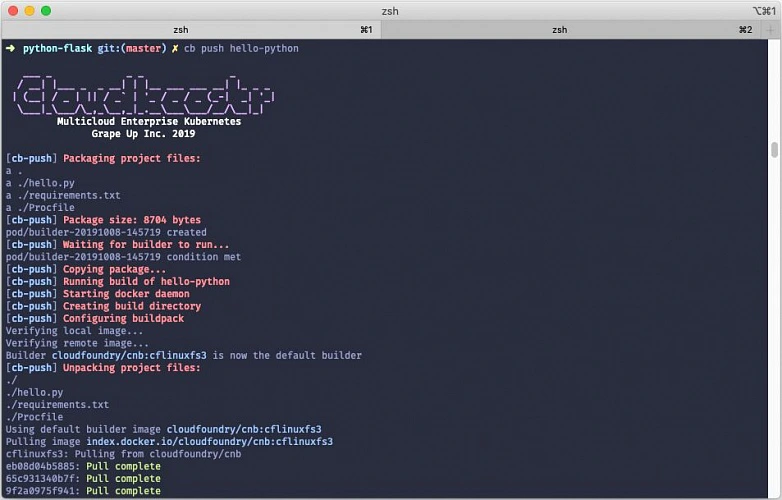
What’s new? The Cloudboostr CLI - a new command line tool designed to simplify developer experience when using Kubernetes. To deploy an application to the cluster, you simply execute a single command:
cb push APP_NAME
The concept of “pushing” an application to the cluster has been borrowed from the Cloud Foundry community and its famous cf push command described by cf push haiku:
Here is my source code
Run it on the cloud for me
I do not care how.
When it comes to Cloudboostr , the “push” command automates the app deployment process by:
- Building the container image from application sources.
- Pushing the image to the container registry.
- Deploying the image to Kubernetes cluster.
- Configuring service and ingress for the app.
Looking under the hood
Cloudboostr CLI uses the Cloud Native Buildpacks project to automatically detect the application type and build an OCI-compatible container image with an appropriate embedded application runtime. Cloud Native Buildpacks can autodetect the most popular application languages and frameworks such as Java, .NET, Python, Golang or NodeJS.
Once the image is ready, it is automatically pushed to the Harbor container registry built into Cloudboostr. By default, Harbor is accessible and serves as a default registry for all Kubernetes clusters deployed within a given Cloudboostr installation. The image stored in the registry is then used to create a deployment in Kubernetes. In the current release only standard Deployment objects are supported, but adding support for StatefulSets is in the roadmap. As the last step, a service object for the application is created and a corresponding ingress object configured with Cloudboostr’s built-in Traefik proxy.
The whole process described above is executed in the cluster. Cloudboostr CLI triggers the creation of a temporary builder container that is responsible for pulling the appropriate buildpack, building the container image and communicating with the registry. The builder container is deleted from the cluster after the build process finishes. Building the image in the cluster eliminates the need to have Docker and pack (Cloud Native Buildpacks command line tool) installed on the local machine.
Cloudboostr CLI uses configuration defined in kubeconfig to access Kubernetes clusters. By default, images are pushed to the Harbor registry in Cloudboostr, but the CLI can also be configured to push images to an external container registry.
Why bother a.k.a. the benefits
While understanding Kubernetes internals is extremely useful, especially for troubleshooting and debugging, it should not be required when you just want to run an app. Many development teams that start working with Kubernetes find it difficult as they would prefer to operate on the application level rather than interact with containers, pods, ingresses, etc. The “cb push” command aims to help those teams and give them a tool to deliver fast and deploy to Kubernetes efficiently.
Cloudboostr was designed to tackle common challenges that software development teams face using Kubernetes. It became clear that we could improve the entire developer experience by providing those teams with a convenient yet effective tool to migrate from Cloud Foundry to Kubernetes. A significant part of that transition came to offer a feature that makes deploying apps to Kubernetes as user-friendly as Cloud Foundry does. That allows developers to work intuitively and with ease.
Cloudboostr CLI significantly simplifies the process of deploying applications to a Kubernetes cluster and takes the burden of handling containers and all Kubernetes-native concepts off of developers’ backs. It boosts the overall software delivery performance and helps teams to release their products to the market faster.
ASP.NET core CI/CD on Azure Pipelines with Kubernetes and Helm
Due to the high entry threshold, it is not that easy to start a journey with Cloud Native. Developing apps focused on reliability and performance, and meeting high SLAs can be challenging. Fortunately, there are tools like Istio which simplify our lives. In this article, we guide you through the steps needed to create CI/CD with Azure Pipelines for deploying microservices using Helm Charts to Kubernetes. This example is a good starting point for preparing your development process. After this tutorial, you should have some basic ideas about how Cloud Native apps should be developed and deployed .
Technology stack
- .NET Core 3.0 (preview)
- Kubernetes
- Helm
- Istio
- Docker
- Azure DevOps
Prerequisites
You need a Kubernetes cluster, free Azure DevOps account, and a docker registry. Also, it would be useful to have kubectl and gcloud CLI installed on your machine. Regarding the Kubernetes cluster, we will be using Google Kubernetes Engine from Google Cloud Platform, but you can use a different cloud provider based on your preferences. On GCP you can create a free account and create a Kubernetes cluster with Istio enabled ( Enable Istio checkbox). We suggest using a machine with 3 standard nodes.
Connecting the cluster with Azure Pipelines
Once we have the cluster ready, we have to use kubectl to prepare service account which is needed for Azure Pipelines to authenticate. First, authenticate yourself by including necessary settings in kubeconfig. All cloud providers will guide you through this step. Then following commands should be run:
kubectl create serviceaccount azure-pipelines-deploy
kubectl create clusterrolebinding azure-pipelines-deploy --clusterrole=cluster-admin --serviceaccount=default:azure-pipelines-deploy
kubectl get secret $(kubectl get secrets -o custom-columns=":metadata.name" | grep azure-pipelines-deploy-token) -o yaml
We are creating a service account, to which a cluster role is assigned. The cluster-admin role will allow us to use Helm without restrictions. If you are interested, you can read more about RBAC on Kubernetes website . The last command is supposed to retrieve secret yaml , which is needed to define connection - save that output yaml somewhere.
Now, in Azure DevOps, go to Project Settings -> Service Connections and add a new Kubernetes service connection. Choose service account for authentication and paste the yaml copied from command executed in the previous step.
One more thing we need in here is the cluster IP. It should be available at cluster settings page, or it can be retrieved via command line. In the example, for GCP command should be similar to this:
gcloud container clusters describe --format=value(endpoint) --zone
Another service connection we have to define is for docker registry. For the sake of simplicity, we will use the Docker hub, where all you need is just to create an account (if you don’t have one). Then just supply whatever is needed in the form, and we can carry on with the application part.
Preparing an application
One of the things we should take into account while implementing apps in the Cloud is the Twelve-Factor methodology. We are not going to describe them one by one since they are explained good enough here but few of them will be mentioned throughout the article.
For tutorial purposes, we’ve prepared a sample ASP.NET Core Web Application containing a single controller and database context. It also contains simple dockerfile and helm charts. You can clone/fork sample project from here . Firstly, push it to a git repository (we will use Azure DevOps), because we will need it for CI. You can now add a new pipeline, choosing any of the available YAML definitions. In here we will define our build pipeline (CI) which looks like that:
trigger:
- master
pool:
vmImage: 'ubuntu-latest'
variables:
buildConfiguration: 'Release'
steps:
- task: Docker@2
inputs:
containerRegistry: 'dockerRegistry'
repository: '$(dockerRegistry)/$(name)'
command: 'buildAndPush'
Dockerfile: '**/Dockerfile'
- task: PublishBuildArtifacts@1
inputs:
PathtoPublish: '$(Build.SourcesDirectory)/charts'
ArtifactName: 'charts'
publishLocation: 'Container'
Such definition is building a docker image and publishing it into predefined docker registry. There are two custom variables used, which are dockerRegistry (for docker hub replace with your username) and name which is just an image name (exampleApp is our case). The second task is used for publishing artifact with helm chart. These two (docker image & helm chart) will be used for the deployment pipeline.
Helm charts
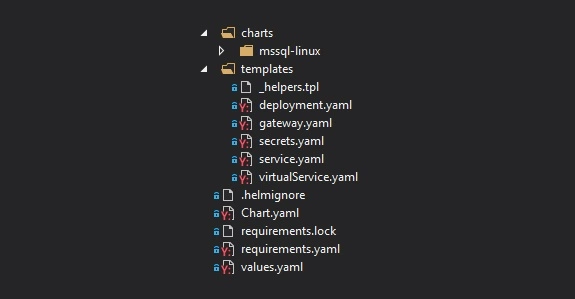
Firstly, take a look at the file structure for our chart. In the main folder, we have Chart.yaml which keeps chart metadata, requirements.yaml with which we can specify dependencies or values.yaml which serves default configuration values. In the templates folder, we can find all Kubernetes objects that will be created along with chart deployment. Then we have nested charts folder, which is a collection of charts added as a dependency in requirements.yaml. All of them will have the same file structure.
Let’s start with a focus on the deployment.yaml - a definition of Deployment controller, which provides declarative updates for Pods and Replica Sets. It is parameterized with helm templates, so you will see a lot of {{ template [...] }} in there. Definition of this Deployment itself is quite default, but we are adding a reference for the secret of SQL Server database password. We are hardcoding ‘-mssql-linux-secret’ part cause at the time of writing this article, helm doesn’t provide a straightforward way to access sub-charts properties.
env:
- name: sa_password
valueFrom:
secretKeyRef:
name: {{ template "exampleapp.name" $root }}-mssql-linux-secret
key: sapassword
As we mentioned previously, we do have SQL Server chart added as a dependency. Definition of that is pretty simple. We have to define the name of the dependency, which will match the folder name in charts subfolder and the version we want to use.
dependencies:
- name: mssql-linux
repository: https://kubernetes-charts.storage.googleapis.com
version: 0.8.0
[...]
For the mssql chart, there is one change that has to be applied in the secret.yaml . Normally, this secret will be created on each deployment ( helm upgrade ), it will generate a new sapassword - which is not what we want. The simplest way to adjust that is by modifying metadata and adding a hook on pre-install. This will guarantee that this secret will be created just once on installing the release.
metadata:
annotations:
"helm.sh/hook": "pre-install"
A deployment pipeline
Let’s focus on deployment now. We will be using Helm to install and upgrade everything that will be needed in Kubernetes. Go to the Releases pipelines on the Azure DevOps, where we will configure continuous delivery. You have to add two artifacts, one for docker image and second for charts artifact. It should look like on the image below.
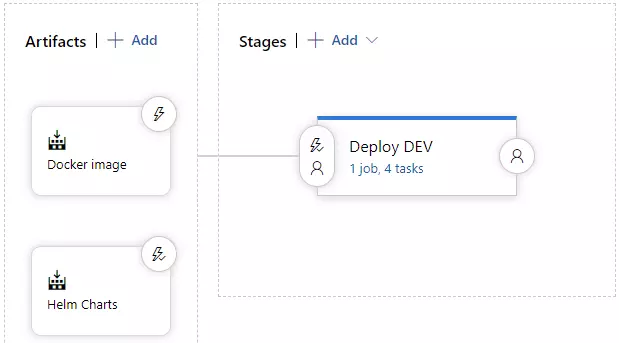
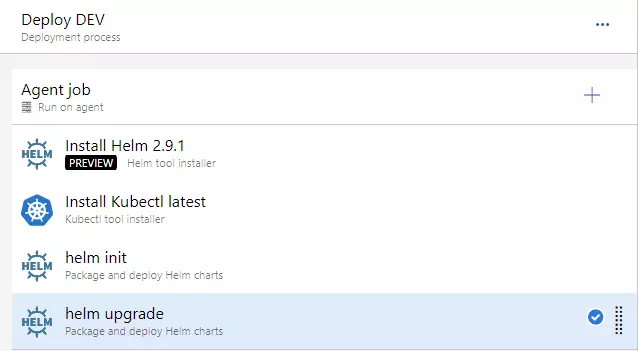
On the stages part, we could add a few more environments, which would get deployed in a similar manner, but to a different cluster. As you can see, this approach guarantees Deploy DEV stage is simply responsible for running a helm upgrade command. Before that, we need to install helm, kubectl and run helm init command.
For the helm upgrade task, we need to adjust a few things.
- set Chart Path, where you can browse into Helm charts artifact (should look like: “$(System.DefaultWorkingDirectory)/Helm charts/charts”)
- paste that “image.tag=$(Build.BuildNumber)” into Set Values
- and check to Install if release not present or add --install ar argument. This will behave as helm install if release won’t exist (i.e. on a clean cluster)
At this point, we should be able to run the deployment application - you can create a release and run deployment. You should see a green output at this point :).
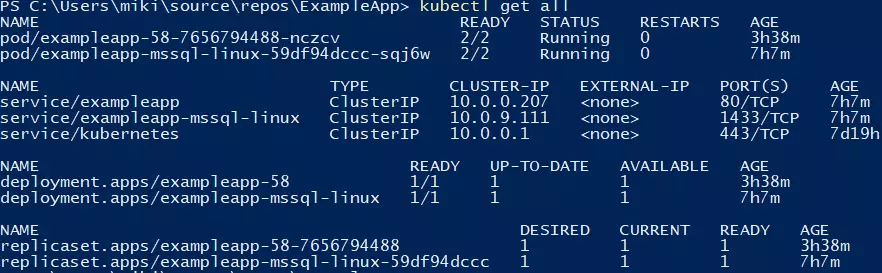
You can verify if the deployment went fine by running a kubectl get all command.
Making use of basic Istio components
Istio is a great tool, which simplifies services management. It is responsible for handling things like load balancing, traffic behavior, metric & logs, and security. Istio is leveraging Kubernetes sidecar containers, which are added to pods of our applications. You will have to enable this feature by applying an appropriate label on the namespace.
kubectl label namespace default istio-injection=enabled
All pods which will be created now will have an additional container, which is called a sidecar container in Kubernetes terms. That’s a useful feature, cause we don’t have to modify our application.
Two objects that we are using from Istio, which are part of the helm chart, are Gateway and VirtualService . For the first one, we will bring Istio definition, because it’s simple and accurate: “Gateway describes a load balancer operating at the edge of the mesh receiving incoming or outgoing HTTP/TCP connections”. That object is attached to the LoadBalancer object - we will use the one created by Istio by default. After the application is deployed, you will be able to access it using LoadBalancer external IP, which you can retrieve with such command:
kubectl get service/istio-ingressgateway -n istio-system
You can retrieve external IP from the output and verify if http://api/examples url works fine.
Summary
In this article, we have created a basic CI/CD which deploys single service into Kubernetes cluster with the help of Helm. Further adjustments can include different types of deployment, publishing tests coverage from CI or adding more services to mesh and leveraging additional Istio features. We hope you were able to complete the tutorial without any issues. Follow our blog for more in-depth articles around these topics that will be posted in the future.
Interested in our services?
Reach out for tailored solutions and expert guidance.