Introduction to Kubernetes security: Container security

Focusing on Kubernetes security, we have to go through container security and their runtimes. All in all, clusters without containers running does not make much sense. Hardening workloads often is much harder than hardening the cluster itself. Let’s start with container configuration.
Basic rules for containers
There are two ways how you can get a container image you want to run. You can build it, or you can use an existing one. If you create your own containers, then you have more control over the process and you have a clear vision of what is inside. But it is now your responsibility to make that image as secure as possible. There are plenty of rules to make your container safer, and here we share the best practices to ensure that.
Minimal image
First of all, if you want to start fast, you set some base images with plenty of features built-in. But in the end, it is not a good idea. The larger the base is, the more issues may occur. For example, the nginx image hosted on Docker Hub has 98 known vulnerabilities, and node has more than 800. All of those issues are inherited automatically by your container - unless you mitigate each one in your custom layers. Please take a look at the graph below that shows how the number of those vulnerabilities grows.
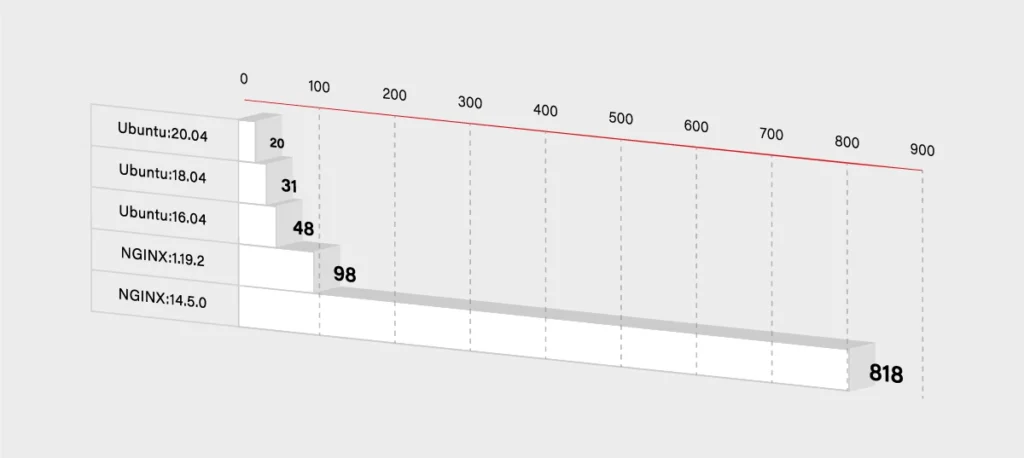
So you have to decide if you really need that additional functionality. If not, then you can use some smaller and simpler base images. It will, for sure, lower the number of known vulnerabilities in your container. It should lower the size of the container dramatically as well.
FROM node -> FROM ubuntu
If you really want only your application running in the container, then you can use Docker’s reserved, minimal image scratch:
FROM scratchCOPY hello /CMD [“/hello”]
User vs Root
Another base rule that you should embrace are the privileges inside the container. If you do not specify any, then it uses the root user inside the container. So there is a potential risk that it gets root access on the Docker host. To minimize that threat, you have to use a dedicated user/group in the Docker image. You can use the USER directive for this purpose:
FROM myslq
COPY . /app
RUN chown -R mysql:mysql /app
USER mysql
As you can see in the above example some images have an already defined user, that you can use. In mysql, it is named mysql (what a surprise!). But sometimes you may have to create one on your own:
RUN groupadd -r test && useradd -r -s /bin/false -g test test
WORKDIR /app
COPY . /app
RUN chown -R test:test /app
USER test
Use the specific tag for a base image
Another threat is not so obvious. You may think that the newest version of your base image will be the most secure one. In general, that is true, but it may bring some new risks and issues to your image. If you do not specify a proper version:
FROM ubuntu
Docker will use the latest one. It sounds pretty handy, but in some cases, it may break your build because the version may change between the builds. Just imagine that you are dependent on some package that has been removed in the latest version of the ubuntu image. Another threat is that the latest version may introduce new vulnerabilities that are not yet discovered. To avoid the described issues, it is better to specify the version of your base image:
FROM ubuntu:18.04
If the version is more specific, then there is a lower risk that it will be changed or updated without notice. On the other hand, please note that there is a higher chance that some specific versions will be removed. In that case, it is always a good practice to use the local Docker registry and keep important images mirrored there.
Also, check and keep in mind the versioning schema for the image - focusing on how alfa, beta, and test images are versioned. Being a test rat for the new features is not really what you would like to do.
See what is inside
The rules described above are only a part of a larger set but some of the most important ones. Especially if you create your own container image. But many times, you have to use images from other teams. It may happen when you simply want to run such an image, or you want to use it as a base image.
In both cases, you are at risk that this external image will bring a lot of issues to your application. If you are not a creator of the container image, then you have to pay even more attention to the security. First of all, you should check a Dockerfile to see how the image is built. Below is an example of the Ubuntu:18.04 image Dockerfile:
FROM scratch
ADD ubuntu-bionic-core-cloudimg-amd64-root.tar.gz /
# verify that the APT lists files do not exist
RUN [ -z "$(apt-get indextargets)" ]
# (see https://bugs.launchpad.net/cloud-images/+bug/1699913)
# a few minor docker-specific tweaks
# see https://github.com/docker/docker/blob/9a9fc01af8fb5d98b8eec0740716226fadb373...
RUN set -xe \
\
(...)
# make systemd-detect-virt return "docker"
# See: https://github.com/systemd/systemd/blob/aa0c34279ee40bce2f9681b496922dedbadfca...
RUN mkdir -p /run/systemd && echo 'docker' > /run/systemd/container
CMD ["/bin/bash"]
Unfortunately, a Dockerfile is often not available, and it is not integrated into the image. You have to use Docker inspect command in order to see what is inside:
$ docker inspect ubuntu:18.04
[
{
"Id": "sha256:d27b9ffc56677946e64c1dc85413006d8f27946eeb9505140b094bade0bfb0cc",
"RepoTags": [
"ubuntu:18.04"
],
"RepoDigests": [
"ubuntu@sha256:e5b0b89c846690afe2ce325ac6c6bc3d686219cfa82166fc75c812c1011f0803"
],
"Parent": "",
"Comment": "",
"Created": "2020-07-06T21:56:11.478320417Z",
(...)
"Config": {
"Hostname": "",
"Domainname": "",
"User": "",
"AttachStdin": false,
"AttachStdout": false,
"AttachStderr": false,
"Tty": false,
"OpenStdin": false,
"StdinOnce": false,
"Env": [
"PATH=/usr/local/sbin:/usr/local/bin:/usr/sbin:/usr/bin:/sbin:/bin"
],
"Cmd": [
"/bin/bash"
],
"ArgsEscaped": true,
"Image": "sha256:4f2a5734a710e5466a625e279994892c9dd9003d0504d99c8297b01b7138a663",
"Volumes": null,
"WorkingDir": "",
"Entrypoint": null,
"OnBuild": null,
"Labels": null
},
"Architecture": "amd64",
"Os": "linux",
"Size": 64228599,
"VirtualSize": 64228599,
(…)
}
]
It gives you all detailed information about the image in a JSON format, so you can review what is inside. Finally, you can use docker histor y to see the complete history of how the image was created.
$ docker history ubuntu:18.04 IMAGE CREATED CREATED BY SIZE d27b9ffc5667 13 days ago /bin/sh -c #(nop) CMD ["/bin/bash"] 0B <missing> 13 days ago /bin/sh -c mkdir -p /run/systemd && echo 'do… 7B <missing> 13 days ago /bin/sh -c set -xe && echo '#!/bin/sh' > /… 745B <missing> 13 days ago /bin/sh -c [ -z "$(apt-get indextargets)" ] 987kB <missing> 13 days ago /bin/sh -c #(nop) ADD file:0b40d881e3e00d68d… 63.2MB
So both commands give you the information similar to the Dockerfile content. But you have to admit that it is pretty complex and not very user-friendly. Fortunately, some tools might help you inspect Docker images. Start with checking out dive
It gives you a good view of each Docker image layer with information on what and where something has changed. The above example shows the layers of Ubuntu:18.04 image and corresponding changes to the files in that layer.
All those commands and tools should give you more confidence in order to decide whether it is safe to run a certain image.
Scan and sign
Usually, you do not have time to manually inspect images and check whether they are safe or not. Especially when you do not look for some malicious code but check for some well-known threats and vulnerabilities. This also applies when you build a container by yourself. In that case, you are probably sure that there is no malicious application or package installed, but still, you have to use some base image that may introduce some vulnerabilities. So again, there are multiple tools to help developers and operators check images.
The first two of them are focused on scanning images for Common Vulnerabilities and Exposures (CVE). All those scanners work pretty similarly – scanning images using external data with known vulnerabilities. It may come from OS vendors or non-OS data like NVD (National Vulnerability Database). Results in most cases, depend on the fact which CVE databases are used and if they are up-to-date. So the final number of detected vulnerabilities may differ for different tools. The scan process itself simply analyzes the contents and creates a history of an image with the mentioned databases.
Below are some results from open source tools Clair created by CoreOS and Trivy developed by Aquasec.
$ clair-scanner ubuntu:18.04
$ clair-scanner ubuntu:18.04
2020/07/22 10:10:02 [INFO] ▶ Start clair-scanner
2020/07/22 10:10:04 [INFO] ▶ Server listening on port 9279
2020/07/22 10:10:04 [INFO] ▶ Analyzing e86dffecb5a4284ee30b1905fef785336d438013826e4ee74a8fe7d65d95ee8f
2020/07/22 10:10:07 [INFO] ▶ Analyzing 7ff84cfee7ab786ad59579706ae939450d999e578c6c3a367112d6ab30b5b9b4
2020/07/22 10:10:07 [INFO] ▶ Analyzing 940667a71e178496a1794c59d07723a6f6716f398acade85b4673eb204156c79
2020/07/22 10:10:07 [INFO] ▶ Analyzing 22367c56cc00ec42fb1d0ca208772395cc3ea1e842fc5122ff568589e2c4e54e
2020/07/22 10:10:07 [WARN] ▶ Image [ubuntu:18.04] contains 39 total vulnerabilities
2020/07/22 10:10:07 [ERRO] ▶ Image [ubuntu:18.04] contains 39 unapproved vulnerabilities
+------------+-----------------------+-------+-------------------+--------------------------------------------------------------+
| STATUS | CVE SEVERITY | PKG | PACKAGE VERSION | CVE DESCRIPTION |
+------------+-----------------------+-------+-------------------+--------------------------------------------------------------+
(...)
+------------+-----------------------+-------+-------------------+--------------------------------------------------------------+
| Unapproved | Medium CVE-2020-10543 | perl | 5.26.1-6ubuntu0.3 | Perl before 5.30.3 on 32-bit platforms allows a heap-based |
| | | | | buffer overflow because nested regular expression |
| | | | | quantifiers have an integer overflow. An application |
| | | | | written in Perl would only be vulnerable to this flaw if |
| | | | | it evaluates regular expressions supplied by the attacker. |
| | | | | Evaluating regular expressions in this fashion is known |
| | | | | to be dangerous since the regular expression engine does |
| | | | | not protect against denial of service attacks in this |
| | | | | usage scenario. Additionally, the target system needs a |
| | | | | sufficient amount of memory to allocate partial expansions |
| | | | | of the nested quantifiers prior to the overflow occurring. |
| | | | | This requirement is unlikely to be met on 64bit systems.] |
| | | | | http://people.ubuntu.com/~ubuntu-security/cve/CVE-2020-10543 |
+------------+-----------------------+-------+-------------------+--------------------------------------------------------------+
| Unapproved | Medium CVE-2018-11236 | glibc | 2.27-3ubuntu1 | stdlib/canonicalize.c in the GNU C Library (aka glibc |
| | | | | or libc6) 2.27 and earlier, when processing very |
| | | | | long pathname arguments to the realpath function, |
| | | | | could encounter an integer overflow on 32-bit |
| | | | | architectures, leading to a stack-based buffer |
| | | | | overflow and, potentially, arbitrary code execution. |
| | | | | http://people.ubuntu.com/~ubuntu-security/cve/CVE-2018-11236 |
(...)
+------------+-----------------------+-------+-------------------+--------------------------------------------------------------+
| Unapproved | Low CVE-2019-18276 | bash | 4.4.18-2ubuntu1.2 | An issue was discovered in disable_priv_mode in shell.c |
| | | | | in GNU Bash through 5.0 patch 11. By default, if Bash is |
| | | | | run with its effective UID not equal to its real UID, it |
| | | | | will drop privileges by setting its effective UID to its |
| | | | | real UID. However, it does so incorrectly. On Linux and |
| | | | | other systems that support "saved UID" functionality, |
| | | | | the saved UID is not dropped. An attacker with command |
| | | | | execution in the shell can use "enable -f" for runtime |
| | | | | loading of a new builtin, which can be a shared object that |
| | | | | calls setuid() and therefore regains privileges. However, |
| | | | | binaries running with an effective UID of 0 are unaffected. |
| | | | | http://people.ubuntu.com/~ubuntu-security/cve/CVE-2019-18276 |
+------------+-----------------------+-------+-------------------+--------------------------------------------------------------+
As mentioned above, both results are subtly different, but it is okay. If you investigate issues reported by Trivy, you will see duplicates, and in the end, both results are the same. But it is not the rule, and usually, they differ.
Based on the above reports, you should be sure if it is safe to use that particular image or not. By inspecting the image, you ensure what is running there, and thanks to the scanner, you are guaranteed about any known CVE. But it is important to underline that those vulnerabilities have to be known. In case of some new threats, you should schedule a regular scan, e.g., every week. In some of the Docker registries, this can be very easily configured, or you can use your CI/CD to run scheduled pipelines. It is also a good idea to send some notification in case of any High Severity vulnerability is found.
Active image scanning
All the above methods are passive, which means they do not actively scan or verify a running container. It was just a static analysis and scan of the image. If you want to be super secure, then you can simply add this live runtime scanner. An example of such a tool is Falco . It is an open-source project started by SysDig and now developed as CNCF Incubating Project. An extremely useful advantage provided by Falco comes to scanning for any abnormal behavior in your container. Besides, it has a built-in analyzer for Kubernetes Audit events. So taking both features together, this is a quite powerful tool to analyze and keep an eye on running containers in real-time. Below there is a quick setup of Falco with the Kubernetes cluster.
First of all, you have to run Falco. You can, of course, deploy it on Kubernetes or use the standalone version. Per the documentation, the most secure way is to run it separated from the Kubernetes cluster to provide isolation in case of a hacker attack. For testing purposes, we will do it in a different way and deploy it onto Kubernetes using Helm .
The setup is quite simple. First, we have to add the helm repository with a falco chart and simply install it. Please note that nginx pod is used for testing purposes and is not a part of Falco.
$ helm repo add falcosecurity https://falcosecurity.github.io/charts
$ helm repo update
$ helm install falco falcosecurity/falco
$ kubectl get pods
NAME READY STATUS RESTARTS AGE
falco-qq8zx 1/1 Running 0 23m
falco-t5glj 1/1 Running 0 23m
falco-w2krg 1/1 Running 0 23m
nginx-6db489d4b7-6pvjg 1/1 Running 0 25m
And that is it. Now let’s test that. Falco comes with already predefined rules, so we can, for example, try to exec into some pod and view sensitive data from files. We will use the mentioned nginx pod.
$ kubectl exec -it nginx-6db489d4b7-6pvjg /bin/bash
root@nginx-6db489d4b7-6pvjg:/# echo "Knock, knock!"
Knock, knock!
root@nginx-6db489d4b7-6pvjg:/# cat /etc/shadow > /dev/null
root@nginx-6db489d4b7-6pvjg:/# exit
Now we should check the logs from the falco pod which runs on the same node as our nginx.
$ kubectl logs falco-w2krg
* Setting up /usr/src links from host
* Running falco-driver-loader with: driver=module, compile=y...
* Unloading falco module, if present
(...)
17:07:53.445726385: Notice A shell was spawned in a container with an attached terminal (user=root k8s.ns=default k8s.pod=nginx-6db489d4b7-6pvjg container=b17be5f70cdc shell=bash parent=runc cmdline=bash terminal=34816 container_id=b17be5f70cdc image=<NA>) k8s.ns=default k8s.pod=nginx-6db489d4b7-6pvjg container=b17be5f70cdc
17:08:39.377051667: Warning Sensitive file opened for reading by non-trusted program (user=root program=cat command=cat /etc/shadow file=/etc/shadow parent=bash gparent=<NA> ggparent=<NA> gggparent=<NA> container_id=b17be5f70cdc image=<NA>) k8s.ns=default k8s.pod=nginx-6db489d4b7-6pvjg container=b17be5f70cdc k8s.ns=default k8s.pod=nginx-6db489d4b7-6pvjg container=b17be5f70cdc
Great, there are nice log messages about exec and reading sensitive file incidents with some additional information. The good thing is that you can easily add your own rules.
$ cat custom_rule.yaml
customRules:
example-rules.yaml: |-
- rule: shell_in_container
desc: notice shell activity within a container
condition: container.id != host and proc.name = bash
output: TEST shell in a container (user=%user.name)
priority: WARNING
To apply them you have to update the helm chart again.
$ helm install falco -f custom_rule.yaml falcosecurity/falco
$ kubectl get pods
NAME READY STATUS RESTARTS AGE
falco-7qnn8 1/1 Running 0 6m21s
falco-c54nl 1/1 Running 0 6m3s
falco-k859g 1/1 Running 0 6m11s
nginx-6db489d4b7-6pvjg 1/1 Running 0 45m
Now we can repeat the procedure and see if there is something more in the logs.
$ kubectl exec -it nginx-6db489d4b7-6pvjg /bin/bash
root@nginx-6db489d4b7-6pvjg:/# echo "Knock, knock!"
Knock, knock!
root@nginx-6db489d4b7-6pvjg:/# cat /etc/shadow > /dev/null
root@nginx-6db489d4b7-6pvjg:/# exit
$ kubectl logs falco-7qnn8
* Setting up /usr/src links from host
* Running falco-driver-loader with: driver=module, compile=yes, download=yes
* Unloading falco module, if present
(...)
17:33:35.547831851: Notice A shell was spawned in a container with an attached terminal (user=root k8s.ns=default k8s.pod=nginx-6db489d4b7-6pvjg container=b17be5f70cdc shell=bash parent=runc cmdline=bash terminal=34816 container_id=b17be5f70cdc image=<NA>) k8s.ns=default k8s.pod=nginx-6db489d4b7-6pvjg container=b17be5f70cdc k8s.ns=default k8s.pod=nginx-6db489d4b7-6pvjg container=b17be5f70cdc
17:33:35.551194695: Warning TEST shell in a container (user=root) k8s.ns=default k8s.pod=nginx-6db489d4b7-6pvjg container=b17be5f70cdc
(...)
17:33:40.327820806: Warning Sensitive file opened for reading by non-trusted program (user=root program=cat command=cat /etc/shadow file=/etc/shadow parent=bash gparent=<NA> ggparent=<NA> gggparent=<NA> container_id=b17be5f70cdc image=<NA>) k8s.ns=default k8s.pod=nginx-6db489d4b7-6pvjg container=b17be5f70cdc k8s.ns=default k8s.pod=nginx-6db489d4b7-6pvjg container=b17be5f70cdc k8s.ns=default k8s.pod=nginx-6db489d4b7-6pvjg container=b17be5f70cdc
You can see a new message is there. You can add more rules and customize falco to your needs. We encourage setting up gRPC and then using falco-exporter to integrate it with Prometheus to easily monitor any security incident. In addition, you may also configure falco to support Kubernetes audit events.
Is it enough? You have inspected and scanned your image. You deployed a runtime scanner to keep an eye on the running containers. But none of those methods guarantee that the image you have just pulled or started is the same you wanted to run. What if someone injected there some malicious code and you did not notice? In order to defend against such an attack, you have to somehow securely and confidently identify the image. There has to be some tool that guarantees us such confidence… and there is one!
The UpdateFramework and Notary
The key element that helps and in fact solves many of those concerns is The Update Framework (TUF) that describes the update system as “secure” if:
- “it knows about the latest available updates in a timely manner,
- any files it downloads are the correct files, and,
- no harm results from checking or downloading files.”
(source: https://theupdateframework.github.io/security.html )
There are four principles defined by the framework that make it almost impossible to make a successful attack on such an update system.
1. The first principle is responsibility separation. In other words, there are a few different roles defined (that are used by e.g., the user or server) that are able to do different actions and use different keys for that purpose.
2. The next one is the multi-signature trust. This simply says that you need a fixed number of signatures which has to come together to perform certain actions, e.g., two developers using their keys to agree that a specific package is valid.
3. The third principle is explicit and implicit revocation. Explicit means that some parties come together and revoke another key, whereas implicit is when e.g., after some time, the repository may automatically revoke signing keys.
4. The last principle is to minimize individual key and role risks. As it says, the goal is to minimize the expected damage which can be defined by the probability of the event happening and its impact. So if there is a root role with a high impact on the system, the key it uses is kept offline.
The idea of TUF is to create and manage a set of metadata (signed by corresponding roles) that provide general information about the valid state of the repository at a specified time.
The next question is: How can Docker use this update framework, and what does it mean to you and me? First of all, Docker already uses it in the Content Trust, which definition seems to answer our first question about image correctness. As per documentation:
“Content trust provides the ability to use digital signatures for data sent to and received from remote Docker registries. These signatures allow client-side verification of the integrity and publisher of specific image tags.”
(source: https://docs.docker.com/engine/security/trust/content_trust )
To be more precise, Content Trust does not use TUF directly. Instead, it uses Notary, a tool created by Docker, which is an opinionated implementation of TUF. It keeps the TUF principles, so there are five roles (with corresponding keys), same as TUF defined, so we have:
· a root role – it uses the most important key that is used to sign the root metadata, which specifies other roles, so it is strongly advised to keep it secure offline;
· a snapshot role – this role signs snapshot metadata that contains information about file names, sizes, hashes of other (root, target and delegation) metadata files, so it ensures users about their integrity. It can be held by owner/admin or Notary service itself;
· a timestamp role – using timestamp key Notary signs metadata file which guarantee the freshness of the trusted collection, because of short expiration time. Due to that fact it is kept by Notary service to automatically regenerate when it is outdated;
· a targets role – it uses the targets key to sign the targets metadata file, with information about files in the collection (filenames, sizes and corresponding hashes) and it should be used to verify the integrity of the files inside the collection. The other usage of the targets key is to delegate trust to other peers using delegation roles.
· a delegation role – which is pretty similar to the targets role but instead of the whole content of the repository those keys ensure integrity of some (or sometimes all) of the actual content. They also can be used to delegate trust to other collaborators via lower level delegation roles.
All this metadata can be pulled or pushed to the Notary service. There are two components in the Notary service – server and signer. The server is responsible for storing the metadata (those files generated by the TUF framework underneath) for trusted collections in an associated database, generating the timestamp metadata, and the most important validating any uploaded metadata.
Notary signer stores private keys (this way they are not kept in the Notary server) and in case of a request from the Notary server it signs metadata for it. In addition, there is a Notary CLI that helps you to manage trusted collections and supports Content Trust with additional functionality. The basic interaction between client, server, and service can be described as: When the client wants to upload new metadata, after authentication (if required) metadata is validated by the server, which generates timestamp metadata (and sometimes snapshot based on what has changed) and sends it to the Notary signer for signing. After that server stores the client metadata, timestamp, and snapshot metadata which ensures that client files are the most recent and valid.
Let’s check how it works. First, run an unsigned image with Docker Content Trust (DCT) disabled. Everything works fine, so we can simply run our image v1:
$ docker run mirograpeup/hello:v1
Unable to find image 'mirograpeup/hello:v1' locally
v1: Pulling from mirograpeup/hello
Digest: sha256:be202781edb5aa6c322ec19d04aba6938b46e136a09512feed26659fb404d637
Status: Downloaded newer image for mirograpeup/hello:v1
Hello World folks!!!
Now we can check how it goes with DCT enabled. First, let’s see what happens when we want to run v2 (which is not signed as well):
$ export DOCKER_CONTENT_TRUST=1
$ docker run mirograpeup/hello:v2
docker: Error: remote trust data does not exist for docker.io/mirograpeup/hello: notary.docker.io does not have trust data for docker.io/mirograpeup/hello.
apiVersion: v1
See 'docker run --help'.
The error above is obvious – we did not specify the trust data/signatures for that image, so it fails to run. To sign the image, you have to push it to the remote repository.
$ docker push mirograpeup/hello:v2
The push refers to repository [docker.io/mirograpeup/hello]
c71acc1231cb: Layer already exists
v2: digest: sha256:be202781edb5aa6c322ec19d04aba6938b46e136a09512feed26659fb404d637 size: 524
Signing and pushing trust metadata
Enter passphrase for root key with ID 1d3d9a4:
Enter passphrase for new repository key with ID 5a9ff85:
Repeat passphrase for new repository key with ID 5a9ff85:
Finished initializing "docker.io/mirograpeup/hello"
Successfully signed docker.io/mirograpeup/hello:v2
For the first time, docker will ask you for the corresponding passphrases for the root key and repository if needed. After that, your image is signed, and we can check again if v1 or v2 can run.
$ docker run mirograpeup/hello:v1
docker: No valid trust data for v1.
See 'docker run --help'.
$ docker run mirograpeup/hello:v2
Hello World folks!!!
So it works well. You can see that it is not allowed to run unsigned images when DCT is enabled and that during the push all the signing process is done automatically. In the end, even though the process itself is a little bit complicated, you can very easily push images to the Docker repository and be sure that it is always the image you intended to run. One drawback of the DCT is that it is not supported in Kubernetes by default. You are able to work around that with admission plugins but it requires additional work.
Registry
We spoke a lot about containers security and how to run them without a headache. But besides that, you have to secure your container registry. First of all, you need to decide whether to use a hosted (e.g., Docker Hub) or on-prem registry.
One good thing about a hosted registry is that it should support (at least Docker Hub does) the Docker Content Trust by default and you just have to enable that on the client side. If you want that to be supported in the on-prem registry then you have to deploy the Notary server and configure that properly on the client side.
On the other hand, the Docker Hub does not provide image scanning and in the on-prem registries, it is usually a standard to provide such ability. Plus in most cases, those solutions support more than one image scanner. So you can choose which scanner you want to run. In some cases, like in Harbor, you are allowed to configure automatically scheduled tests and you can set up some notifications if needed. So it is a very nice thing that the on-prem registry is not worse and sometimes offers more than a free Docker Hub registry which comes with few limitations.
In addition, you have much more control over the on-prem registry. You can have a super-admin account and see all the images and statistics. But you have to maintain it and make sure it will be always up and running. Still, many companies prevent use of external registries - so in that case, you have no choice.
Whatever you choose, always make sure to use TLS communication. If your on-prem registry uses self-signed or signed by company root CA, certificates, then you have to configure Docker in Kubernetes properly. You can specify the insecure-registries option in the Docker daemon, but it may end up with fallback to HTTP which is not what we tried to prevent in the first place. A more secure option is to provide the certificates to the Docker daemon:
cp domain.crt /etc/docker/certs.d/mydomain.com:5000/ca.crt
Private registry
Also, if you want to use a private registry, you will have to provide the credentials or cache (manually load) the image to each worker node. Please note to force cached images to be used you need to block the imagePullPolicy: Always . When it comes to providing credentials, you basically have two options.
Configure Nodes
Prepare the proper docker config.json:
{
"auths": {
"https://index.docker.io/v1/": {
"username": "xxxxxxxx"
"password": "xxxxxxxx"
"email": "xxxxxxxx"
"auth": "<base64-encoded-‘username:password’>"
}
}
}
And copy that to each worker node to the kubelet configuration directory. It is usually /var/lib/kubelet, so for a single worker it would be:
$ scp config.json root@worker-node:/var/lib/kubelet/config.json
Use ImagePullSecrets
The easiest way is to use the built-in mechanism in the Kubernetes secrets:
kubectl create secret docker-registry <secret-name> \
--docker-server=<your-registry-server> \
--docker-username=<your-name> \
--docker-password=<your-password> \
--docker-email=<your-email>
or you may create a secret by providing a YAML file with the base64 encoded docker config.json:
{
"auths": {
"https://index.docker.io/v1/": {
"username": "xxxxxxxx"
"password": "xxxxxxxx"
"email": "xxxxxxxx"
"auth": "<base64-encoded-‘username:password’>"
}
}
}
secret.yml (please note the type has to be kubernetes.io/dockerconfigjson and the data should be placed under .dockerconfigjson):
apiVersion: v1
kind: Secret
metadata:
name: <secret-name>
namespace: <namespace-name>
data:
.dockerconfigjson: <base64-encoded-config-json-file>
type: kubernetes.io/dockerconfigjson
Adding the above secret, you have to keep in mind that it works only in the specified namespace, and anyone in that namespace may be able to read that. So you have to be careful who is allowed to use your namespace/cluster. Now, if you want to use this secret, you simply have to put it in the Pod spec imagePullSecrets property:
apiVersion: v1
kind: Pod
metadata:
name: private-reg
spec:
containers:
- name: private-reg-container
image: <your-private-image>
imagePullSecrets:
- name: <your-secret-name>
Container security checks
If you want to be even more secure than you can run some additional tests to check your setup. In that case, the Docker security is the thing you want to check. In order to do that, you can use Docker Bench Security. It will scan your runtime to find any issues or insecure configurations. The easiest way is to run it as a pod inside your cluster. You have to mount a few directories from the worker node and run this pod as root, so make sure you know what you are doing. The below example shows how the Pod is configured if your worker runs on Ubuntu (there are some different mount directories needed on different operating systems).
cat docker-bench.yml
apiVersion: v1
kind: Pod
metadata:
name: docker-bench
spec:
hostPID: true
hostIPC: true
hostNetwork: true
securityContext:
runAsUser: 0
containers:
- name: docker-bench
image: docker/docker-bench-security
securityContext:
privileged: true
capabilities:
add: ["AUDIT_CONTROL"]
volumeMounts:
- name: etc
mountPath: /etc
readOnly: true
- name: libsystemd
mountPath: /lib/systemd/system
readOnly: true
- name: usrbincontainerd
mountPath: /usr/bin/containerd
readOnly: true
- name: usrbinrunc
mountPath: /usr/bin/runc
readOnly: true
- name: usrlibsystemd
mountPath: /usr/lib/systemd
readOnly: true
- name: varlib
mountPath: /var/lib
readOnly: true
- name: dockersock
mountPath: /var/run/docker.sock
readOnly: true
volumes:
- name: etc
hostPath:
path: /etc
- name: libsystemd
hostPath:
path: /lib/systemd/system
- name: usrbincontainerd
hostPath:
path: /usr/bin/containerd
- name: usrbinrunc
hostPath:
path: /usr/bin/runc
- name: usrlibsystemd
hostPath:
path: /usr/lib/systemd
- name: varlib
hostPath:
path: /var/lib
- name: dockersock
hostPath:
path: /var/run/docker.sock
type: Socket
kubectl apply -f docker-bench.yml
kubectl logs docker-bench -f
# ------------------------------------------------------------------------------
# Docker Bench for Security v1.3.4
#
# Docker, Inc. (c) 2015-
#
# Checks for dozens of common best-practices around deploying Docker containers in production.
# Inspired by the CIS Docker Community Edition Benchmark v1.1.0.
# ------------------------------------------------------------------------------
Initializing Sun Sep 13 22:41:02 UTC 2020
[INFO] 1 - Host Configuration
[WARN] 1.1 - Ensure a separate partition for containers has been created
[NOTE] 1.2 - Ensure the container host has been Hardened
[INFO] 1.3 - Ensure Docker is up to date
[INFO] * Using 18.09.5, verify is it up to date as deemed necessary
[INFO] * Your operating system vendor may provide support and security maintenance for Docker
[INFO] 1.4 - Ensure only trusted users are allowed to control Docker daemon
[INFO] * docker:x:998
[WARN] 1.5 - Ensure auditing is configured for the Docker daemon
[WARN] 1.6 - Ensure auditing is configured for Docker files and directories - /var/lib/docker
[WARN] 1.7 - Ensure auditing is configured for Docker files and directories - /etc/docker
[WARN] 1.8 - Ensure auditing is configured for Docker files and directories - docker.service
[INFO] 1.9 - Ensure auditing is configured for Docker files and directories - docker.socket
[INFO] * File not found
[WARN] 1.10 - Ensure auditing is configured for Docker files and directories - /etc/default/docker
[INFO] 1.11 - Ensure auditing is configured for Docker files and directories - /etc/docker/daemon.json
[INFO] * File not found
[INFO] 1.12 - Ensure auditing is configured for Docker files and directories - /usr/bin/docker-containerd
[INFO] * File not found
[INFO] 1.13 - Ensure auditing is configured for Docker files and directories - /usr/bin/docker-runc
[INFO] * File not found
[INFO] 2 - Docker daemon configuration
[WARN] 2.1 - Ensure network traffic is restricted between containers on the default bridge
[PASS] 2.2 - Ensure the logging level is set to 'info'
[WARN] 2.3 - Ensure Docker is allowed to make changes to iptables
[PASS] 2.4 - Ensure insecure registries are not used
[PASS] 2.5 - Ensure aufs storage driver is not used
[INFO] 2.6 - Ensure TLS authentication for Docker daemon is configured
(...)
After completing these steps, you can check the logs from the Pod to see the full output from Docker Bench Security and act on any warning you see there. The task is quite demanding but gives you the most secure Docker runtime. Please note sometimes you have to leave a few warnings in order to keep everything working. Then you still have an option to provide more security using Kubernetes configuration and resources, but this is a topic for a separate article.

Grape Up guides enterprises on their data-driven transformation journey
Ready to ship? Let's talk.
Check related articles
Read our blog and stay informed about the industry's latest trends and solutions.
Common Kubernetes failures at scale
Currently, Vanilla Kubernetes supports 5000 nodes in a single cluster. It does not mean that we can just deploy 5000 workers without consequences - some problems and edge scenarios happen only in the larger clusters. In this article, we analyze the common Kubernetes failures at scale, the issues we can encounter if we reach a certain cluster size or high load - network or compute.
Incorrect size
When the compute power requirements grow, the cluster grows in size to house the new containers. Of course, as experienced cluster operators , while adding new workers, we also increase master nodes count. Everything works well until the Kubernetes cluster size expanded slightly over 1000-1500 nodes - and now everything fails. Kubectl does not work anymore, we can’t make any new changes - what has happened?
Let’s start with what is a change for Kubernetes and what actually happens when an event occurs. Kubectl contacts the kube-apiserver through API port and requests a change. Then the change is saved in a database and used by other APIs like kube-controller-manager or kube-scheduler. This gives us two quick leads - either there is a communication problem or the database does not work.
Let’s quickly check the connection to the API with curl ( curl https://[KUBERNETES_MASTE_HOST]/api/ ) - it works. Well, that was too easy.
Now, let’s check the apiserver logs if there is something strange or alarming. And there is! We have an interesting error message in logs:
etcdserver: mvcc: database space exceeded
Let’s connect to ETCD and see what is the database size now:
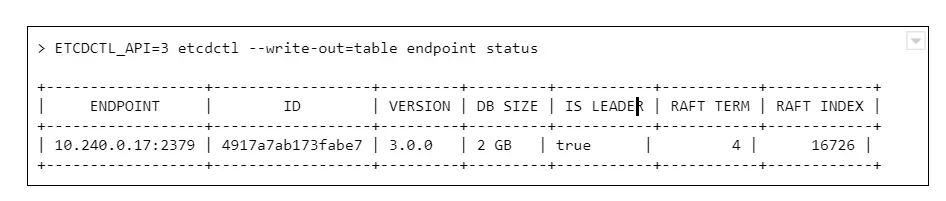
And we see a round number 2GB or 4GB of database size. Why is that a problem? The disks on masters have plenty of free space.
The thing is, it is not caused by resources starvation. The maximum DB size is just a configuration value, namely quota-backend-bytes . The configuration for this was added in 1.12, but it is possible (and for large clusters highly advised) to just use separate etcd cluster to avoid slowdowns. It can be configured by environment variable:
ETCD_QUOTA_BACKEND_BYTES
Etcd itself is a very fragile solution if you think of it for the production environment. Upgrades, rollback procedure, restoring backups - those are things to be carefully considered and verified because not so many people think about it. Also, it requires A LOT of IOPS bandwidth, so optimally, it should be run on fast SSDs.
What are ndots?
Here occurs one of the most common issues which comes to mind when we think about the Kubernetes cluster failing at scale. This is the first issue faced by our team while starting with managing Kubernetes clusters, and it seems to occur after all those years to the new clusters.
Let’s start with defining ndots . And this is not something specific to Kubernetes this time. In fact, it is just a rarely used /etc/resolv.conf configuration parameter, which by default is set to 1 .
Let’s start with the structure of this file, there are only a few options available there:
- nameserver - list of addresses of the DNS server used to resolve the addresses (in the order listed in a file). One address per keyword.
- domain - local domain name.
- sortlist - sort order of addresses returned by gethostbyname() .
- options:
- ndots - maximum number of dots which must appear in hostname given for resolution before initial absolute query should happen. Ndots = 1 means if there is any dot in the name the first try will be absolute name try.
- debug , timeout , attempts … - let’s leave other ones for now
- search - list of domains used for the resolution if the query has less than configure in ndots dots.
So the ndots is a name of configuration parameter which, if set to value bigger than 1 , generates more requests using the list specified in the search parameter. This is still quite cryptic, so let’s look at the example `/etc/resolve.conf` in Kubernetes pod:
nameserver 10.11.12.13
search kube-system.svc.cluster.local svc.cluster.local cluster.local
options ndots:5
With this configuration in place, if we try to resolve address test-app with this configuration, it generates 4 requests:
- test-app.kube-system.svc.cluster.local
- test-app.svc.cluster.local
- test-app.cluster.local
- test-app
If the test-app exists in the namespace, the first one will be successful. If it does not exist at all, it 4th will get out to real DNS.
How can Kubernetes, or actually CoreDNS, know if www.google.com is not inside the cluster and should not go this path?
It does not. It has 2 dots, the ndots = 5, so it will generate:
- www.google.com.kube-system.svc.cluster.local
- www.google.com.svc.cluster.local
- www.google.com.cluster.local
- www.google.com
If we look again in the docs there is a warning next to “search” option, which is easy to miss at first:
Note that this process may be slow and will generate a lot of network traffic if the servers for the listed domains are not local and that queries will time out if no server is available for one of the domains.
Not a big deal then? Not if the cluster is small, but imagine each DNS resolves request between apps in the cluster being sent 4 times for thousands of apps, running simultaneously, and one or two CoreDNS instances.
Two things can go wrong there - either the DNS can saturate the bandwidth and greatly reduce apps accessibility, or the number of requests sent to the resolver can just kill it - the key factor here will be CPU or memory.
What can be done to prevent that?
There are multiple solutions:
1. Use only fully qualified domain names (FQDN). The domain name ending with a dot is called fully qualified and is not affected by search and ndots settings. This might not be easy to change and requires well-built applications, so changing the address does not require a rebuild.
2. Change ndots in the dnsConfig parameter of the pod manifest:
dnsConfig:
options:
- name: ndots
value: "1"
This means the short domain names for pods do not work anymore, but we reduce the traffic. Also can be done for deployments which reach a lot of internet addresses, but not require local connections.
3. Limit the impact. If we deploy kube-dns (CordeDNS) on all nodes as DaemonSet with a fairly big resources pool there will be no outside traffic. This helps a lot with the bandwidth problem but still might need a deeper look into the deployed network overlay to make sure it is enough to solve all problems.
ARP cache
This is one of the nastiest failures, which can result in the full cluster outage when we scale up - even if the cluster is scaled up automatically. It is ARP cache exhaustion and (again) this is something that can be configured in underlying linux.
There are 3 config parameters associated with the number of entries in the ARP table:
- gc_thresh1 - minimal number of entries kept in ARP cache.
- gc_thresh2 - soft max number of entries in ARP cache (default 512).
- gc_thresh3 - hard max number of entries in ARP cache (default 1024).
If the gc_thresh3 limit is exceeded, the next requests result with a neighbor table overflow error in syslog.
This one is easy to fix, just increase the limits until the error goes away, for example in /etc/sysctl.conf file (check the manual for you OS version to make sure what is the exact name of the option):
net.ipv4.neigh.default.gc_thresh1 = 256
net.ipv4.neigh.default.gc_thresh2 = 1024
net.ipv4.neigh.default.gc_thresh3 = 2048
So it’s fixed , by why did it happen in the first place? Each pod in Kubernetes has it’s own IP address (which is at least one ARP entry). Each node takes at least two entries. This means it is really easy for a bigger cluster to exhaust the default limit.
Pulling everything at once
When the operator decides to use a smaller amount of very big workers, for example, to speed up the communication between containers, there is a certain risk involved. There is always a point of time when we have to restart a node - either it is an upgrade or maintenance. Or we don’t restart it, but add a new one with a long queue of containers to be deployed.
In certain cases, especially when there are a lot of containers or just a few very big ones, we might have to download a few dozens of gigabytes, for example, 100GB. There are a lot of moving pieces that affect this scenario - container registry location, size of containers, or several containers which results in a lot of data to be transmitted - but one result: the image pull fails. And the reason is, again, the configuration.
There are two configuration parameters that lead to Kubernetes cluster failures at scale:
- serialize-image-pulls - download the images one by one, without parallelization.
- image-pull-progress-deadline - if images cannot be pulled before the deadline triggers it is canceled.
It might be also required to verify docker configuration on nodes if there is no limit set for parallel pulls. This should fix the issue.
Kubernetes failures at scale - sum up
This is by no means a list of all possible issues which can happen. From our experience, those are the common ones, but as the Kubernetes and software evolve, this can change very quickly. It is highly recommended to learn about Kubernetes cluster failures that happened to others, like Kubernetes failures stories and lessons learned to avoid repeating mistakes that had happened before. And remember to backup your cluster, or even better make sure you have the immutable infrastructure for everything that runs in the cluster and the cluster itself, so only data requires a backup.
Kubernetes cluster management: Size and resources
While managing Kubernetes clusters, we can face some demanding challenges. This article helps you manage your cluster resources properly, especially in an autoscaling environment.
If you try to run a resource-hungry application, especially on a cluster which has autoscaling enabled, at some point this happens:
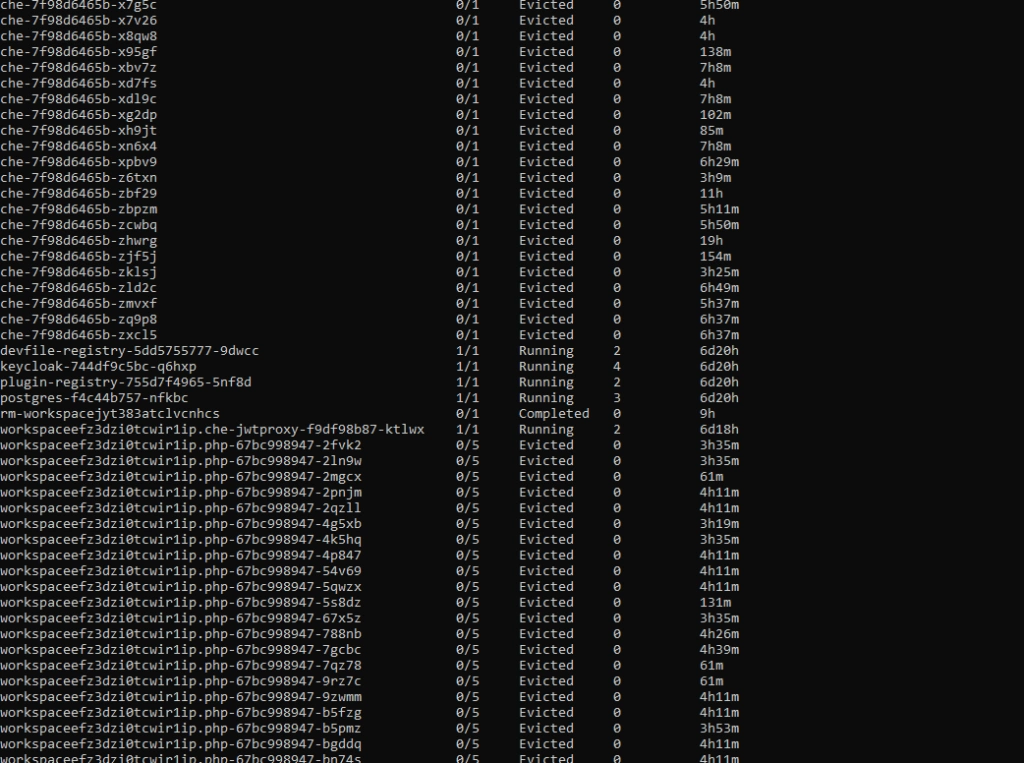
For the first time, it may look bad, especially if you see dozens of evicted pods in kubectl get, and you only wanted to run 5 pods. With all that claims, that you can run containers without worries about the orchestration, as Kubernetes does all of that for you, you may find it overwhelming.
Well, this is true to some extent, but the answer is - it depends, and it all boils down to a crucial topic associated with Kubernetes cluster management. Let's dive into the problem.
Learn more about services provided by Grape Up
You are at Grape Up blog, where our experts share their expertise gathered in projects delivered for top enterprises. See how we work.
Enabling the automotive industry to build software-defined vehicles
Empowering insurers to create insurance telematics platforms
Providing AI & advanced analytics consulting
Kubernetes Cluster resources management
While there is a general awareness that resources are never limitless - even in a huge cluster as a service solution, we do not often consider the exact layout of the cluster resources. And the general idea of virtualization and containerization makes it seem like resources are treated as a single, huge pool - which may not always be true. Let’s see how it looks.
Let’s assume we have a Kubernetes cluster with 16 vCPU and 64GB of RAM.

Can we run on it our beautiful AI container, which requires 20GB of memory to run? Obviously, not. Why not? We have 64GB of memory available on the cluster!
Well, not really. Let’s see how our cluster looks inside:
The Cluster again
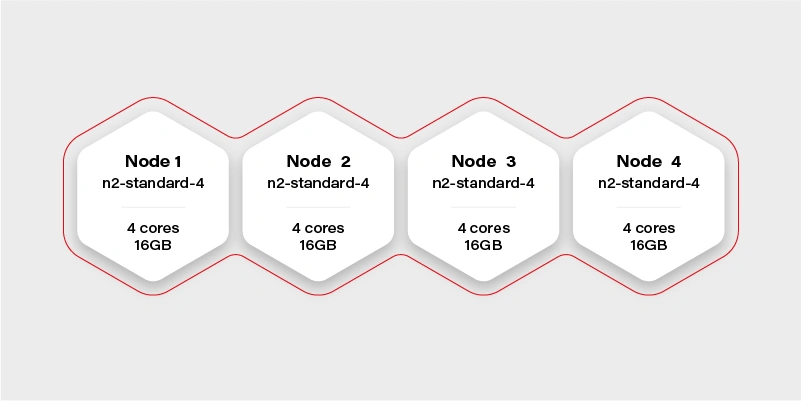
There are 4 workers in the cluster, and each has 16GB of memory available (in practice, it will be a little bit less, because of DaemonSets and system services, which run a node and take their small share). Container hard memory limit is, in this case, 16GB, and we can’t run our container.
Moreover, it means we have to always take this limitation into account. Not just if we deploy one big container, but also in complex deployments, or even things which in general can run out-of-the-box like helm charts .
Let’s try another example.
Our next task will be a Ceph deployment to the same cluster. The target we want to achieve is a storage size of 1TB split into 10 OSDs (object storage daemons) and 3 ceph MONs (monitors). We want to put it on 2 of the nodes, and leave the other 2 for deployments which are going to use the storage. Basic and highly extensible architecture.
The first, naive approach is to just set OSDs count to 10, MONs count to 3 and add tolerations to the Ceph pods, plus of course matching taint on Node 1 and Node 2 . All ceph deployments and pods are going to have the nodeSelector set to target only nodes 1 and 2 .
Kubernetes does its thing and runs mon-1 and mon-2 on the first worker along with 5 osds, and mon-3 along with 5 osds on the second worker.
mon-1
mon-2
osd-1
osd-2
osd-3
osd-4
osd-5 mon-3
osd-6
osd-7
osd-8
osd-9
osd-10 Stateless App
It worked out! And our application can now save quite a lot of large files to Ceph very quickly, so our job becomes easier. If we also deploy the dashboard and create a replicated pool, we can even see 1TB of storage available and 10 OSDs up, that's a huge achievement!
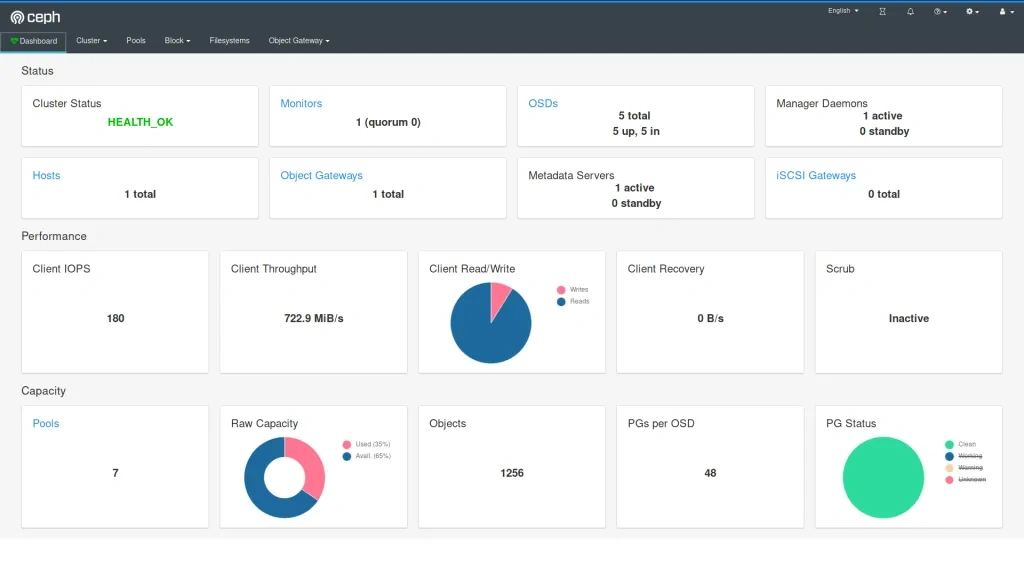
The very next morning, we check the status again and see that the available storage is around 400GB and 4 OSDs in flight. What is going on? Is this a crash? Ceph is resilient, it should be immune to crashes, restart quickly, and yet it does not seem like it worked very well here.
If we now check the cluster, we can see a lot of evicted OSD pods. Even more, than we are supposed to have at all. So what really has happened? To figure this out, we need to go back to our initial deployment configuration and think it through.
Limits and ranges
We ran 13 pods, 3 of them (monitors) don’t really need a lot of resources, but OSDs do. More we use it more resources it needs because ceph caches a lot of data in memory. Plus replication and balancing data over storage containers do not come free.
So initially after the deployment, the memory situation looks more or less like this:
Node 1
mon-1 - 50MB
mon-2 - 50MB
osd-1 - 200MB
osd-2 - 200MB
osd-3 - 200MB
osd-4 - 200MB
osd-5 - 200MB
1100MB memory used Node 2
mon-3 - 50M
Bosd-6 - 200MB
osd-7 - 200MB
osd-8 - 200MB
osd-9 - 200MB
osd-10 - 200MB
1050MB memory used
After a few hours of extensive usage, something goes wrong.
Node 1
mon-1 - 250MB
mon-2 - 250MB
osd-1 - 6500MB
osd-2 - 5300MB
osd-3 - Evicted
osd-4 - Evicted
osd-5 - Evicted
12300MB memory used Node 2
mon-3 - 300MB
osd-6 - 9100MB
osd-7 - 5700MB
osd-8 - Evicted
osd-9 - Evicted
osd-10 - Evicted
15100MB memory used
We have lost almost 50% of our pods. Does it mean it’s over? No, we can lose more of them quickly, especially if the high throughput will now target the remaining pods. Does it mean we need more than 32GB of memory to run this Ceph cluster? No, we just need to correctly set limits so a single OSD can’t just use all available memory and starve other pods.
In this case, the easiest way would be to take the 30GB of memory (leave 2GB for mons - 650MB each, and set them limits properly too!) and divide it by 10 OSDs. So we have:
resources :
limits :
memory : "3000Mi"
cpu : "600m"
Is it going to work? It depends, but probably not. We have configured 15GB of memory for OSDs and 650MB for each pod. It means that first node requires: 15 + 2*0.65 = 16.3GB. A little bit too much and also not taking into account things like DaemonSets for logs running on the same node. The new version should do the trick:
resources :
limits :
memory : "2900Mi"
cpu : "600m"
Quality of Service
There is one more warning. If we also set a request for the pod to exactly match the limit, then Kubernetes treats this kind of pod differently:
resources :
requests :
memory : "2900Mi"
cpu : "600m"
limits :
memory : "2900Mi"
cpu : "600m"
This pod configuration is going to have QoS in Kubernetes set to Guaranteed . Otherwise, it is Burstable . Guaranteed pods are never evicted - by setting the same request and limit size, we confirm that we are certain what is the resource usage of this pod, so it should not be moved or managed by Kubernetes. It reduces flexibility for the scheduler but makes the whole deployment way more resilient.
Obviously, for mission-critical systems , “best-effort” is never enough.
Resources in an autoscaling environment
If we can calculate or guess the required resources correctly to match the cluster size, the limits and quality of service may be just enough. Sometimes though the configuration is more sophisticated and the cluster size is fluid - it can scale up and down horizontally and change the number of available workers.
In this case, the planning goes in two parallel paths - you need to plan for the minimal cluster size and the maximum cluster size - assuming linear scaling of resources.
It cannot be assumed that applications will act properly and leave space for the other cluster cohabitants. If the pods are allowed to scale up horizontally or vertically while the cluster is expanding, it may result in evicting other pods when it’s scaling down. To mitigate this issue, there are two main concepts available in Kubernetes: Pod Priority and Pod Disruption Budget .
Let’s start again by creating our test scenario. This time we don’t need tons of nodes, so let’s just create a cluster with two node groups: one consisting of regular instances (let’s call it persistent) and one consisting of preemptible/spot instance (let’s just call them preemptible for the sake of an experiment).
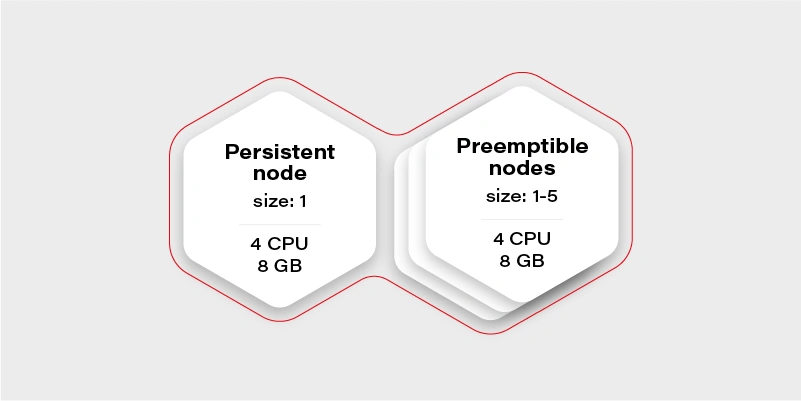
The preemptible nodes group will scale up when the CPU usage of the VM (existing node) will be over 0.7 (70%).
The advantage of the preemptible/spot instances is their price. They are much cheaper than regular VMs of the same performance. The only drawback is that there is no guarantee for their lifetime - the instance can be killed when the cloud providers decide it is required somewhere else, for maintenance purposes, or just after 24 hours. This means we can only run fault-tolerant, stateless workloads there.
Which should be most of the things which run in your cluster if you follow the 12 factors, right?
Why there is one persistent node in our cluster then? To prepare for the rare case, when none of the preemptible nodes are running, it is going to maintain the minimal set of containers to manage the operability of the application.
Our application will consist of:
Application Replicas CPUs Memory Redis cluster with one redis master - has to run on a persistent node 1 0.5 300MB Frontend application (immutable) 2 0.5 500MB Backend application (immutable) 2 0.7 500MB Video converter application (immutable) 1 1 2GB Sum 3.9 4.3GB
We can configure the redis master to work on the persistent node using a node selector. Then just deploy everything else and Bob is your uncle .
Horizontal Pod Autoscaler
Well, but we have an autoscaling nodes group and no autoscaling configured in the cluster. This means we have never really triggered cluster autoscaling and it stays all the time on two workers, because application itself does not increase replicas count. Let’s start with the Horizontal Pod Autoscaler:
Frontend:
apiVersion : autoscaling/v2beta2
kind : HorizontalPodAutoscaler
metadata :
name : frontend-hpa
spec : scaleTargetRef :
apiVersion : apps/v1
kind : Deployment
name : frontend
minReplicas : 2
maxReplicas : 10
metrics :
- type : Resource
resource :
name : cpu
target :
type : Utilization
averageUtilization : 75
Backend:
apiVersion : autoscaling/v2beta2
kind : HorizontalPodAutoscaler
metadata :
name : backend-hpa
spec :
scaleTargetRef :
apiVersion : apps/v1
kind : Deployment
name : backend
minReplicas : 2
maxReplicas : 10
metrics :
- type : Resource
resource :
name : cpu
target :
type : Utilization
averageUtilization : 75
Video converter:
apiVersion : autoscaling/v2beta2
kind : HorizontalPodAutoscaler
metadata :
name : video-converter-hpa
spec :
scaleTargetRef :
apiVersion : apps/v1
kind : Deployment
name : video-converter
minReplicas : 1
maxReplicas : 25
metrics :
- type : Resource
resource :
name : cpu
target :
type : Utilization
averageUtilization : 25
So now we have the same configuration as we described in the deployment - the sum of minReplicas is equal. Why does the video converter have such a low target average utilization? When there are multiple conversions enqueued, it will make autoscaling quicker - if it quickly reaches 25% of average CPU usage, then the new one is spawned. This is a very trivial configuration - if you need something more sophisticated check scaling policies .
What might happen if we now test our environment and enqueue 50 video conversions each taking around 10 minutes?
It depends, but the likely scenario is that the video converter will scale up to the 25 instances. What happens with other containers in the cluster? Some of them will be evicted, maybe backend ones, maybe frontend ones, or maybe even redis. There is quite a high risk of the setup to break down and be inaccessible for the end-users.
Can we mitigate the issue? Yes, for example, we can create the priority classes and assign them lower for the video converter. The higher priority pod has, the more worth it has for the scheduler. If two pods are due to be evicted - the one with lower priority gets the pole position. If two pods of different priorities are scheduled, the higher priority one gets the precedence.
apiVersion : scheduling.k8s.io/v1
kind : PriorityClass
metadata :
name : high-priority
value : 100000
globalDefault : false
description : "This is high priority class for important workloads"
So if we give the converter lower priority, we confirm that the frontend and backend pods are more important, and in the worst case, the video converter can be expelled from the cluster.
Moreover, this is not going to guarantee that the backend can’t evict the frontend.
There is also an alternative that allows us to have better control over the scheduling of the pods. It is called…
Pod Disruption Budget
This resource allows us to configure a minimal amount of the deployment pods running at once. It is more strict than just priority because it can even block the node drain, if there is not enough space on other workers to reschedule the pod, and in result make the replicas count lower than the assigned budget.
The configuration is straightforward:
apiVersion : policy/v1beta1
kind : PodDisruptionBudget
metadata :
name : frontend-pdb
spec :
minAvailable : 2
selector :
matchLabels :
app : frontend
From now on, the frontend replica count cannot get lower than 2. We can assign this way minimums for all the pods and make sure there are always at least 1 or 2 pods which can handle the request.
This is the easiest and safest way to make sure that pod autoscaling and cluster scaling down is not going to affect the overall solution stability - as long as the minimal set of containers configured with the disruption budget can fit the minimal cluster size and it is enough to handle the bare minimum of requests.
Connecting the dots
Now we have all the required pieces to create a stable solution. We can configure HPAs to have the same min number of replicas as PDB to make the scheduler's life easier. We know our max cluster size and made sure limits are the same as requests, so pods are not evicted. Let’s see what we get with the current configuration:
Application Min. replicas Max. replicas PDB CPUs Memory A redis cluster with one redis master - has to run on a persistent node 1 1 1 0.5 300MB Frontend application (immutable) 2 10 2 0.5 500MB Backend application (immutable) 2 10 2 0.7 500MB Video converter application (immutable) 1 25 1 1 2GB Sum (min) 3.9 4.3GB Sum (max) 37.5 ~60.3GB
Not bad. It can even stay as it is, but the current max cluster size is 24 cores with 48GB of memory. With all the configurations we went through, it should be fine when we exceed that size, so there is a little bit of flexibility for the scheduler - for example if there is a very low load on frontend and backend, but a huge pile of data to be converted, then the converter can scale up to approx. 19-21 instances, which is nice to have.
There is no one design that fits all
Is there anything wrong with the current configuration? Well, there can be, but we are going into unknown depths of “it depends.”
It all starts with the simple question - what is the purpose of my solution/architecture and what are the KPIs. Let’s look again at the example - it is a video converted with a web application. A pretty basic solution that scales up if required to accommodate a higher load. But what is more important - faster conversion or more responsible UI?
It all boils down to the product requirements, and in general, it is easy to solve. There are three paths we can follow from now on:
The I don’t care path
If it does not matter from the user and product perspective just leave it and see how it performs. Maybe even two frontend pods can handle a lot of load? Or maybe nobody cares about the latency as long as nothing crashes unexpectedly? Don’t overengineer and don’t try the premature optimization - let it be and see if it’s fine. If it’s not there are still two other paths available.
The I know what matters most path
This path requires a bit of knowledge about priorities. If the priority is the smooth and scalable UI and it’s fine to have quite some conversions waiting - put the higher priority on the frontend and backend deployments as described in previous paragraphs. If the video conversion is the key - put the higher priority on it. Whatever you choose, it will be the deployment that can scale up at the expense of the other one. This is especially important if loads don’t really run in parallel most of the time, so can scale up and down independently, and the next path does not fit that scenario.
The I want to be safe path
The last path is straightforward, just put the maximums so to be close to the cluster limits, but not higher:
Application Min. replicas Max. replicas PDB CPUs Memory A redis cluster with one redis master - has to run on a persistent node 1 1 1 0.5 300MB Frontend application (immutable) 2 8 2 0.5 500MB Backend application (immutable) 2 8 2 0.7 500MB Video converter application (immutable) 1 13 1 1 2GB Sum (min) 3.9 4.3GB Sum (max) 23,1 34,3GB
Now there is some space in the memory department, so we can, for example, give the pods more memory. We are also always safe because most of the time, there will be no fighting for resources. It might happen only when the cluster will be scaling up.
Is this a perfect solution? Not really, because it is possible to fit 20 video converters at once in the cluster when there is no traffic on the UI (frontend and backend) and we artificially limit the deployment ability to scale.
Autoscaling considerations
When it comes to autoscaling, there are some things to keep in mind. First, it is not reliable - it’s impossible to say how long it will take for the cloud provider to spin up the VM. It may take seconds, and it may take minutes (in general it rarely takes less than a minute), so starting very small with the hope of autoscaling solving the peak loads may not be the greatest idea.
The other often forgotten thing is that when we scale up, then there is a point when the cluster scales down. If the deployment scales down and pods are truly stateless and can handle it gracefully - then it is not a big deal. When it comes to the cluster scaling down, we need to remember that it effectively shuts down the VMs. Sometimes something is running on them, and the scheduler has to quickly move the workload to the other workers. This is something that has to be thoughtfully tested to make sure it does not break the application operations.
Kubernetes cluster management - summary
This is the end of our quite long journey through Kubernetes cluster size and resources management. There is much more there, especially for the bigger clusters or complex problems, which may come in handy later on, like configuring the eviction policies , namespace requests and limits , or topology management useful when we have specific nodes for specific purposes. Although what we have gone through in this article should be perfectly fine and serve well even quite complex solutions . Good luck and we wish you no evicted pods in the future!
Interested in our services?
Reach out for tailored solutions and expert guidance.