Thinking out loud
Where we share the insights, questions, and observations that shape our approach.
Server Side Swift with Vapor - end to end application with Heroku cloud
In this tutorial, I want to show you the whole production process of back-end and front-end swift applications and push the backend side to the heroku cloud.
First, please make sure that you have installed at least Xcode 10. Let’s start from the backend side:
Open a terminal and check your Swift version and make sure that your swift version is 4.2.
swift –-version

Time to install Vapor CLI, for this one we should use homebrew.
brew install vapor/tap/vapor
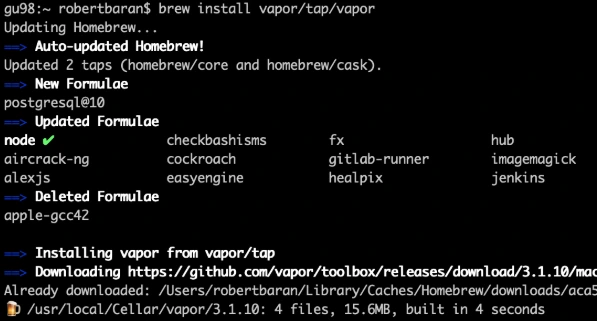
Vapor CLI is already installed.
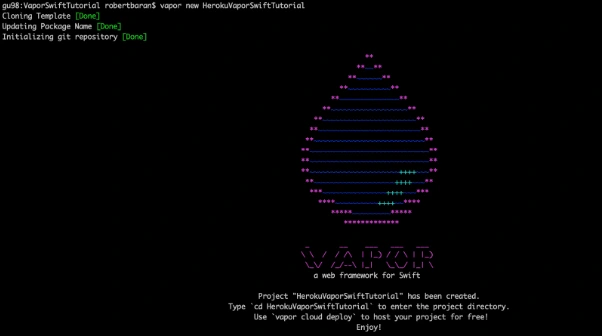
Let’s create a new project. Vapor CLI have simple commands for lots of things. Most of them you will learn in this tutorial later.
Vapor new {your-project-name}
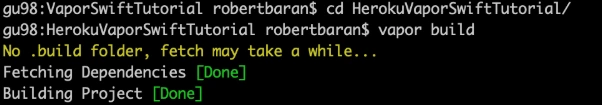
Go into the project directory and build it using "vapor build" command:
vapor build
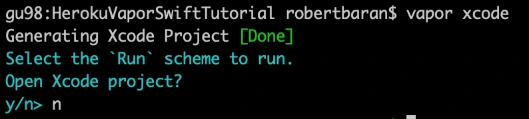
Let’s create xcode project using vapor xcode which will be needed later.
And verify if your backend works fine locally:
vapor run
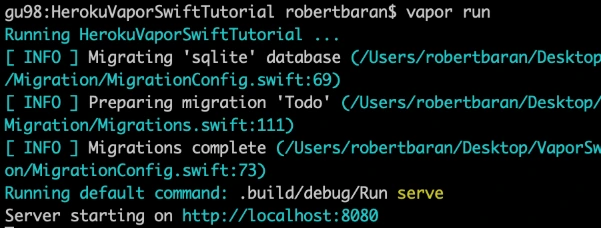
As we can see the server is starting on our machine to be sure if that works fine, go to the web browser and check the localhost:8080.
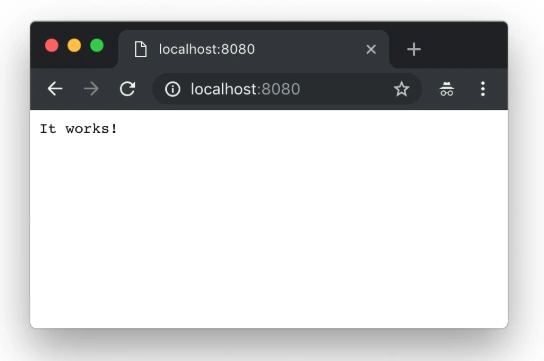
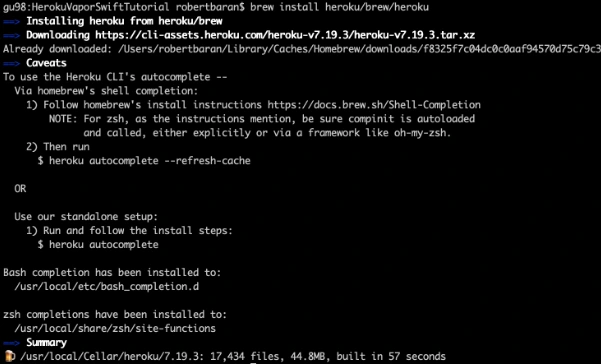
Yupi! Here is your first application running with Perfect Swift. Let's try to deploy it to the cloud, but first, we need to install heroku cli.
brew install heroku/brew/ heroku
Now, deploy your first application to the cloud, but first you need to create free Heroku account. I will skip this process in tutorial. When the account was created go to the terminal install Heroku CLI and try to deploy.
vapor heroku init
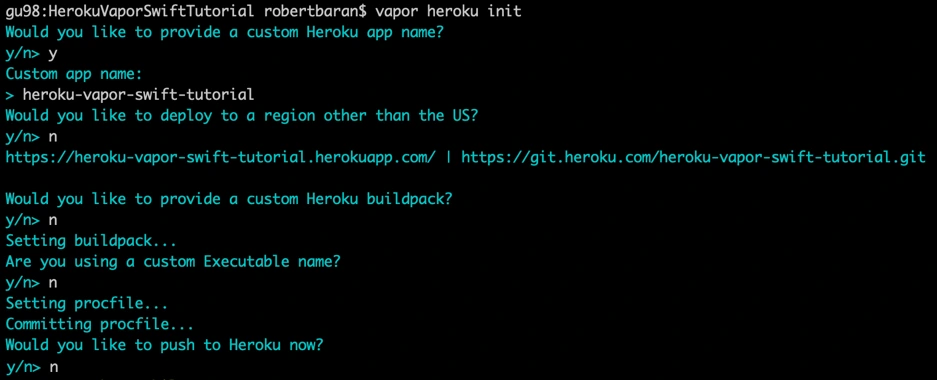
Before we push to Heroku we have to change Heroku stack from 18 to 16 as 18 is in the beta stage and doesn’t support vapor yet.

Let’s deploy: git push Heroku master.
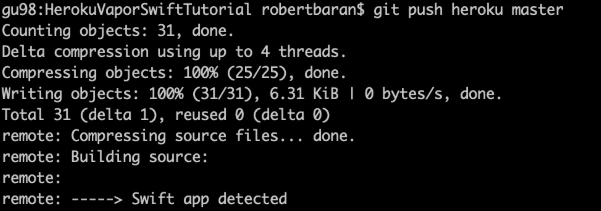
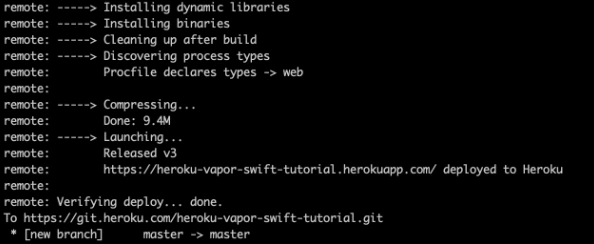
The app is already deployed. You can log in via a web browser to your Heroku account and see if it is running and if it works!
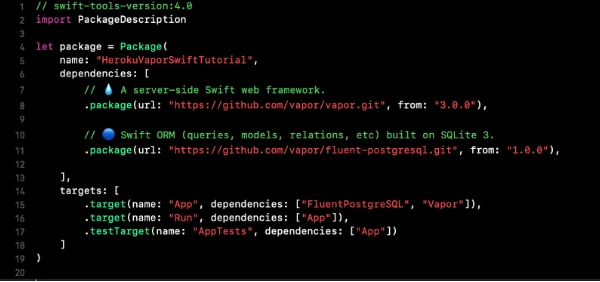
Now we need to configure the project. Go to Xcode or other source editor and install PostgreSQL framework. In Package.swift we need to add the FluentPostreSQL. In Package.swift we need to add the FluentPostreSQL.
Run vapor clean, vapor build and then vapor Xcode.
It's time to configure the database and clean up the project. First of all, go to configure.swift file and remove FluentSQL and remove related functions related to it. Then we need to configure the PostgreSQL database in our project. We need to remember that few things need to be done like at the beginning import the FluentPostgreSQL and register provider into services.
try services.register(FluentPostgreSQLProvider())
Then we need to create a database config and register the database.
// Configure a database
var databases = DatabasesConfig()
let databaseConfig: PostgreSQLDatabaseConfig
if let url = Environment.get("DATABASE_URL") {
guard let urlConfig = PostgreSQLDatabaseConfig(url: url) else {
fatalError("Failed to create PostgresConfig")
}
print(urlConfig)
databaseConfig = urlConfig
} else {
let databaseName: String
let databasePort: Int
if (env == .testing) {
databaseName = "vapor-test"
if let testPort = Environment.get("DATABASE_PORT") {
databasePort = Int(testPort) ?? 5433
} else {
databasePort = 5433
}
}
else {
databaseName = Environment.get("DATABASE_DB") ?? "vapor"
databasePort = 5432
}
let hostname = Environment.get("DATABASE_HOSTNAME") ?? "localhost"
let username = Environment.get("DATABASE_USER") ?? "robertbaran"
databaseConfig = PostgreSQLDatabaseConfig(hostname: hostname, port: databasePort, username: username, database: databaseName, password: nil)
}
let database = PostgreSQLDatabase(config: databaseConfig)
databases.add(database: database, as: .psql)
services.register(databases)
Once the database is registered we need to create our model and controller. In the example project, we have todo model and controller you could remove that as we will create a new model and controller. The idea for the app is creating a shopping list, so we need to think about what we need for that. So we have already database registered so we have to create a model which will contain our productName and id. Create ShoppingList.swift file which will be our PostgreSQL model.
import FluentPostgreSQL
import Vapor
final class ShoppingList: PostgreSQLModel {
var id: Int?
var productName: String
init(id: Int? = nil, productName: String) {
print("Shopping List Model was sucesfully created")
self.id = id
self.productName = productName
}
}
extension ShoppingList: Migration { }
extension ShoppingList: Content { }
extension ShoppingList: Parameter { }
Go back to the configuration file and register database migration for that model.
var migrations = MigrationConfig()
migrations.add(model: ShoppingList.self, database: .psql)
services.register(migrations)>
The model is already done, the database is registered so it’s time to create a controller which we gonna use for getting, creating and deleting data from our database. We have provided functions for that:
import Vapor
final class ShoppingListController {
func index(_ req: Request) throws -> Future<[ShoppingList]> {
return ShoppingList.query(on: req).all()
}
func create(_ req: Request) throws -> Future {
return try req.content.decode(ShoppingList.self).flatMap { item in
return item.create(on: req)
}
}
func delete(_ req: Request) throws -> Future {
return try req.parameters.next(ShoppingList.self).flatMap { item in
return item.delete(on: req)
}.transform(to: .ok)
}
}
Also, we need to configure the routes. Go to routes.swift and initialize ShoppingListController and create routes for the functions which we already created in the controller:
let shoppingListController = ShoppingListController()
router.get("shoppingList", use: shoppingListController.index)
router.post("shoppingList", use: shoppingListController.create)
router.delete("shoppingList", ShoppingList.parameter, use: shoppingListController.delete)
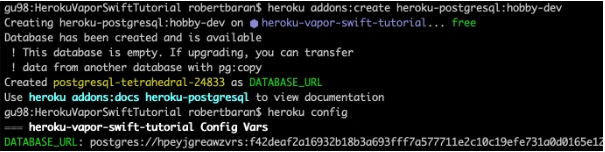
Try to build the project. Once the project is built successfully you can test that locally but first, you need to setup PostgreSQL locally. I would recommend you to configure Postgres on Heroku and push it directly. First, add Heroku add-ons. I’m using the free hobby-dev database for this project:
heroku addons:create heroku-postgresql:hobby-dev
Then:
heroku config
Edit procfile web: Run serve --env production --port $PORT --hostname 0.0.0.0
Commit the changes and push to Heroku .
gu98:VaporSwiftTutorial robertbaran$ cd HerokuVaporSwiftTutorial/
gu98:HerokuVaporSwiftTutorial robertbaran$ clear
gu98:HerokuVaporSwiftTutorial robertbaran$ heroku addons:create heroku-postgresql:shoppingList-dev
Creating heroku-postgresql:shoppingList-dev on ⬢ heroku-vapor-swift-tutorial... !
▸ Couldn't find either the add-on service or the add-on plan of "heroku-postgresql:shoppingList-dev".
gu98:HerokuVaporSwiftTutorial robertbaran$ clear
gu98:HerokuVaporSwiftTutorial robertbaran$ heroku addons:create heroku-postgresql:hobby-dev
Creating heroku-postgresql:hobby-dev on ⬢ heroku-vapor-swift-tutorial... free
Database has been created and is available
! This database is empty. If upgrading, you can transfer
! data from another database with pg:copy
Created postgresql-tetrahedral-24833 as DATABASE_URL
Use heroku addons:docs heroku-postgresql to view documentation
gu98:HerokuVaporSwiftTutorial robertbaran$ heroku config
=== heroku-vapor-swift-tutorial Config Vars
DATABASE_URL: postgres://hpeyjgreawzvrs:f42deaf2a16932b18b3a693fff7a577711e2c10c19efe731a0d0165e12d5a6c4@ec2-23-21-188-236.compute-1.amazonaws.com:5432/dab0tadl6uco6a
gu98:HerokuVaporSwiftTutorial robertbaran$
Verify the Heroku build, you can use it for that Postman or any other tool for API Development. Make post/get/delete and verify if that works. If you followed this tutorial everything should work fine.
Now let's begin work on the iOS app for creating a shopping list. Usually, I create a workspace and new project for iOS, but you can do it whatever you like. There are a few options. You can have 2 separate projects for frontend and backend, you can group everything in one project and use different targets for it or you can have a workspace with 2 projects. In this tutorial, I will be working with the workspace and 2 separates projects.
Save your backend project as a workspace from Xcode -> File menu now close the current project and open the workspace. Create SingleViewApplication for frontend application select shared scheme for it and drag n drop your project file to the workspace. Now you have to close Xcode and open again your workspace. All projects should appear properly.
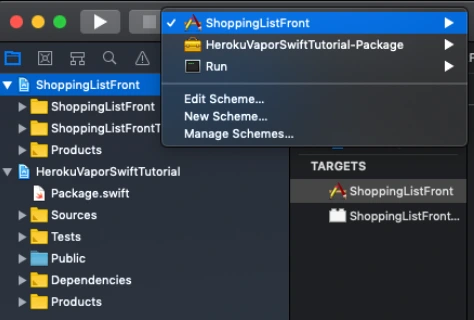
Make sure that you have all schemes here and also your projects appear properly.
Let’s start working on the iOS app. This will be just quick as we need just add a button text field and table view with the list. I’m not gonna create MVVM but it’s recommended also will use just NSURLSession for it as this tutorial it’s not about it. I just want to show you how quick and easy the whole application can be created.
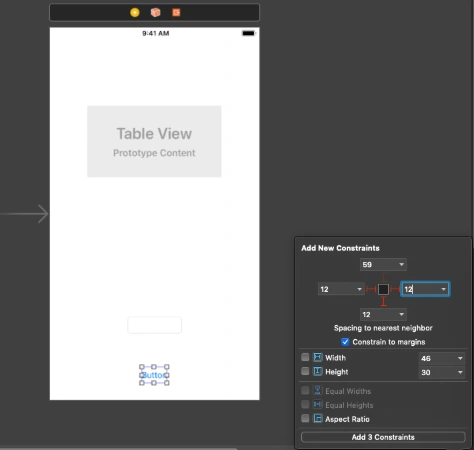
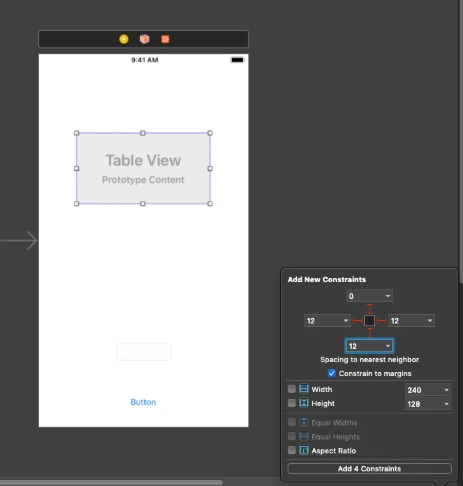
Go to Main.storyboard and create UI for this app first. Add tableView, button, and textField into you view Controller and setup constraints.

Create outlets for button, textField and connect delegate and dataSource for the tableView. Create an action for the button, create an extension for tableView delegate and data source. Create CellView. In your storyboard, you could create a prototype cell and use it in the data source. You could also create some labels and loading indicator to make that application a nice look. This tutorial is not about swift – iOS so I just give you an example of usage APIs here. You can find the whole project here. This for both frontend and backend with the workspace created. To be able to run it first you need to follow all the changes related to backend specific and Heroku as URL needs to be changed here for Heroku deployed an app or if you want to run it locally you need to configure PostgreSQL database on your machine and change database configuration in the configure.swift file.
Conclusion
Vapor is the best choice until you don’t need to use a non-SQL database like Kassandra as there is no easy way to configure that and make it work. As for me, this is no issue at all. This tutorial is easy but this is just to show you how that simple is writing backend in Swift. It’s the most important thing for the ios developers and also for every other delveloper as in my opinion this language is becoming to be the most popular language in a few years. I’m not a backend developer just enthusiast of server-side swift but thinking about change my frontend role to become a full stack.

Painless view controller configuration in Swift
Back in the pre-storyboard era of iOS development, developers had to write hundreds of lines of boilerplate code that served to manage UIViewController object hierarchies. Back then, some were inventing generic approaches to the configuring of controllers and transitions between them. Others were just satisfied with the ad-hoc view controller creation and presented them directly from other code controllers. But things changed when Apple introduced storyboards in iOS 5. It was a huge step forward in the UI design for iOS. Storyboards introduced an ability to visually define app screens and - what is the most important - transitions between them (called segues) in a single file. Storyboard segues allow to discard all the boilerplate code related to transitions between view controllers.
Of course, every solution has its advantages and disadvantages. When it comes to storyboards, some may note issues such as hard to resolve merge conflicts, coupling of view controllers, poor reusability etc. Some developers don’t even use storyboards because of such disadvantages. For others the advantages play a more important role. However, the real bottleneck of the storyboards is the initialization of view controllers. In fact, there is no true initialization for the view controllers presented by storyboard segues.
Problems with the view controller configuration
Let’s start from some basics. In Objective-C/Swift, in order to give an object an initial state, the initializer ( init() ) is called. This call assigns values to properties of the class. It always happens at the point where the object is created. When subclassing any class, we may provide the initializer and this is the only proper way. We may also provide such initializer for the UIViewController subclass. However, in case such controller is created/presented using the storyboard, the segue creation takes place through a particular initializer – init(coder:) . Overriding it in subclass may give us the ability to initialize properties added by the subclass. However, we don’t have the ability to pass additional arguments to the overridden method. Moreover, even if we had such an ability, it would make no sense. This is because for storyboard-driven view controllers there is no particular point in code which allows them to pass data to the initializer. That is, we cannot catch the moment of creation of such controller. The creation of view controllers managed by storyboard segues is hidden from the programmer. It happens when segue to the controller is triggered – either entirely handled by the system (when triggering action is set up in the storyboard file) or using performSegue() method.
Apple, however, provides a place where we can pass some data to an already created view controller after the segue is triggered. It’s a prepare(for : sender:) method. From its first parameter (of UIStoryboardSegue type), we can get the segue’s destination view controller. Because the controller has already been created (initialization is already performed when triggering segue) the only option for passing the required data is to configure it. This means that after the initialization, but before the prepare(for : sender:) is called, the properties of the controller that hold such data should not have initial value or should have fake ones. While the second option is meaningless in most cases, the first one is widely used. Such absence of data means that the corresponding controller’s properties should be of an optional type(s). Let’s take a look on the following sample:
override func prepare(for segue: UIStoryboardSegue, sender: Any?) {
if segue.identifier == "ToSomeViewControllerSegueID",
let controller = segue.destination as? SomeViewController {
controller.someValue = 12345
}
}
}
This is how the view controller configuring is implemented in most cases when dealing with segues:
- check segue id;
- get the destination view controller from the segue object;
- try to cast it to the type of the expected view controller subclass.
In case all conditions are satisfied we can set values to the properties of the controller that need to be configured. The problem with the approach is that it has too much service code related to verification and data extraction. It may not be visible in simple cases like the one shown above. However, taking into account the fact that each view controller in application often has transitions to several other view controllers such service code becomes a real boilerplate code we’d like to avoid. Take a look at the following example that generalizes the problem with prepare(for : sender:) implementation.
override func prepare(for segue: UIStoryboardSegue, sender: Any?) {
if segue.identifier == "ToViewControllerA",
let controller = segue.destination as? ViewControllerA {
// configure View Controller A
}
} else if segue.identifier == "ToViewControllerB",
let controller = segue.destination as? ViewControllerB {
// configure View Controller B
}
} else if segue.identifier == "ToViewControllerC",
let controller = segue.destination as? ViewControllerC {
// configure View Controller C
}
} else ...
...
} else if segue.identifier == "ToViewControllerZ",
let controller = segue.destination as? ViewControllerZ {
// configure View Controller Z
}
}
}
All those if… else if… blocks are making code hard to read. Moreover, each block is for the a different view controller that has to be configured. That is, the more view controllers are going to be present by this one, the more if… else if… will be added. This, in turn, reveals another problem with such configuration. There is a single method for a particular controller that does all configurations for every controller we’re going to present.
Solution
Let’s try to find the approach to the view controller configuration that may eliminate the outlined problems. We’re limited to the usage of prepare(for : sender:) since it’s the only point where the configuration can be done. So we cannot do anything with the type of the destination view controller and with the check of segue identifier. Instead we’d like to generalize the process of configuration in a way that allows us to have a single type check and single verification for identifier. That is, check with some generalized type of destination view controller and variable segue identifier rather than enumerating all the possible concrete types/identifiers. For this, we need to pass somehow the information about the type and the segue identifier to the prepare(for : sender:) method. We would like to have something like the following:
override func prepare(for segue: UIStoryboardSegue, sender: Any?) {
if segue.identifier == ,
let viewerController = segue.destination as? {
// configure viewerController
}
}
In order to have a single configuration code for all the controllers we need two things: unified interface to configure the controller, and a way to get the configuration data for the particular destination controller and segue identifier. Let’s define each part of the solution.
1. Unified interface for view configuration
As defined previously, configuration means setting values to one or more properties of destination view controller. So it’s natural to associate the configuration interface with the destination controller rather than with the one that triggers the segue. Obviously, each destination view controller has a different number of properties of different types to configure.
In order to provide a unified configuration interface we may implement a method for configuring each controller. We should pass there the values that will be assigned to the corresponding controller properties. To unify such method, every configured controller should have the same signature. To achieve this, we should wrap a set of passed configuring values into a single object. Then such method will always have one argument – no matter how many properties should be set. The type of the argument is a type of the wrapping object and is different for each view controller. This means that the view controller should implement a method for configuring and somehow define a type of the argument of the method. This is a perfect task for protocols with associated types. Let’s define the following protocol:
protocol Configurable {
associatedtype ConfigurationType
func configure(with configuration: ConfigurationType)
}
Each view controller that is going to be configured (is configurable) should conform to this protocol by implementing the configure(with:) method and defining a concrete type for ConfigurationType . In the easiest case where we only have one property that needs to be configured, the ConfigurationType is the type of that property. Otherwise, the ConfigurationType may be defined as a structure or tuple to represent several values. Consider the following examples:
class SomeViewController: UIViewController, Configurable {
var someValue: Int?
var someObject: MyModelType?
…
func configure(with configuration: (value: Int, object: MyModelType)) {
value = configuration.value
someObject = configuration.object
}
}
class OtherViewController: UIViewController, Configurable {
var underlyingObject: MyObjectType?
…
func configure(with object: MyObjectType) {
underlyingObject = object
}
}
2. Defining the configuration data for view controller
Now, let’s go back to the controller that is triggering a segue. We’re going to use the configuration protocol we’ve defined. For this, we need to have data for passing it to the configure(with:) method. This should be something as follows:
override func prepare(for segue: UIStoryboardSegue, sender: Any?) {
if let segueIdentifier = segue.identifier {
// 1. Get configuration object
// for segue.destination and segueIdentifier
// 2. Pass configuration object to the destination controller
}
}
Let's focus on how should we obtain the configuration object. Each segue is unique within a controller that triggers those segues. For each segue we have a single destination controller that has its own type of configuration. This means that segue id unambiguously defines a configuration type that should be used for configuring the destination view controller.
On the other hand, just returning the configuration of a concrete type per each segue id is not enough. If we did so, we would need to pass it somehow to a destination controller that has a type UIViewCotroller. It has nothing to do with the configuration. On the other hand, we cannot use the Configurable protocol as a type of an object directly because it has an associated type constraint. That is, we cannot cast the destination view controller to the Configurable type like as follows:
(segue.destination as? Configurable)?.configure(with: data) . Instead, we need to use some proxy generic type that is constrained to being a Configurable.
Also, creating all the configuration objects for the controllers in a single method has no sense since it brings the same issue as the one with prepare(for ) . That is, in this case we have a concentration of code intended to configuring different objects in a single method. Instead, the better solution is to group the code for creating the particular configuration and the type of the controller which is configured into a separate object. Consider the following example:
class Configurator {
let configurationProvider: () -> ConfigurableType.ConfigurationType
init(configuringCode: @escaping () -> ConfigurableType.ConfigurationType) {
self.configurationProvider = configuringCode
}
func performConfiguration(of object: ConfigurableType) {
let configuration = configurationProvider()
object.configure(with: configuration)
}
}
In the code above, a single Configurator<T> instance is responsible for configuring the controller of a particular type. The code that creates the configuration is injected to the configurator in the init() method during creation.
According with the reasoning given above, we should associate a segue ID with the particular configuration and type. Considering the approach with the Configurator<T> , the easiest way to do it is to create a mapping object where the key is a segue ID and a value is the corresponding Configurator<T> instance. We may also create those Configurator<T> objects in place of the map definition. This will make the code more clear and readable. The following example demonstrates such map:
var segueIDToConfigurator: [String : Any] {
return [
"ToSomeViewControllerSegueID": Configurator {
return (value: 123, object: MyModelType())
},
"ToOtherViewControllerSegueID": Configurator {
return MyObjectType()
}
]
}
Let’s now try to use the configuration from the dictionary above in prepare(for ) method. Let’s take a look at the following example
override func prepare(for segue: UIStoryboardSegue, sender: Any?) {
if let segueIdentifier = segue.identifier,
let configuring = segueIDToConfigurator[segueIdentifier] as? Configurator {
configuring.performConfiguration(of: segue.destination)
}
}
The problem is that the value type of the dictionary segueIDToConfigurator is Any . We cannot call on it any method directly. Instead, we need to cast it to the type that contains the performConfiguration(of:) method. On the other hand, the only type in our implementation that contains the performConfiguration(of:) method is the generic type Configurator<T> . And to use it we should pass a certain type of the destination view controller in place of the generic type placeholder. At this point, the problem is in prepare(for ) method. In this method we don’t have the information about that view controller type. Let’s try to resolve the problem. We need Configurator<T> only to call the performConfiguration(of:) method. Instead of having the whole interface of Configurator<T> type inside the prepare(for ) method we may use some intermediate interface that does not depend on a generic type and allows us to call performConfiguration(of:) .
var segueIDToConfigurator: [String : Configuring] {
return [
"ToSomeViewControllerSegueID": Configurator {
return (value: 123, object: MyModelType())
},
"ToOtherViewControllerSegueID": Configurator {
return MyObjectType()
}
]
}
For this, let’s create a protocol Configuring and modify the Configurator<T> type to make it conform to it. The example below demonstrates the refined approach.
protocol Configuring {
func performConfiguration(of object: SomeType) throws
}
class Configurator: Configuring {
let configurationProvider: () -> ConfigurableType.ConfigurationType
init(configuringCode: @escaping () -> ConfigurableType.ConfigurationType) {
self.configurationProvider = configuringCode
}
func performConfiguration(of object: SomeType) throws {
if let configurableObject = object as? ConfigurableType {
let configuration = configurationProvider()
configurableObject.configure(with: configuration)
} else {
throw ConfigurationError()
}
}
}
Now, the performConfiguration(of:) is a generic method. This allows us to call it without knowing the exact type of the object which is configured. The method however became throwable. This is because the type of its argument is widened so that the arbitrary type can be passed. But the method can still handle only the objects that conform to the Configurable protocol. And if the passed object is not Configurable we don’t have anything to do with it. In this case we throw an error.
We may now use the newly defined Configuring protocol to define the dictionary for segue-to-configurator mapping:
This allows us to use the Configuring objects inside the prepare(for ) method as shown below:
override func prepare(for segue: UIStoryboardSegue, sender: Any?) {
if let segueIdentifier = segue.identifier,
let configuring = segueIDToConfigurator[segueIdentifier] {
do {
try configuring.performConfiguration(of: segue.destination)
} catch let configurationError {
fatalError("Cannot configure (segue.destination). " +
"Error: (configurationError)")
}
}
}
Refining the solution
The above prepare(for ) implementation is the same for any controller that is going to use the described approach. There are several ways to avoid such code duplication. But you must keep in mind that each has its downsides.
The first and the most obvious way is to use some base view controller across the project that will implement the method prepare(for ) and the segueIDToConfigurator property for holding configurations:
class BaseViewController {
var segueIDToConfigurator: [String: Configuring] {
return [String: Configuring]()
}
override func prepare(for segue: UIStoryboardSegue, sender: Any?) {
if let segueIdentifier = segue.identifier,
let configuring = segueIDToConfigurator[segueIdentifier] {
do {
try configuring.performConfiguration(of: segue.destination)
} catch let configurationError {
// throw an error or just write to log
// if you just want to silently it ignore
fatalError("Cannot configure (segue.destination). " +
"Error: (configurationError)")
}
}
}
}
class MyViewController: BaseViewController {
// Define needed configurators
override var segueIDToConfigurator: [String: Configuring]{
...
}
}
The advantage of the first way is that any controller that subclasses BaseViewController needs to define strictly the data that is needed for the configuration. That is, override the segueIDToConfigurator property. However, it forces all the view controllers to subclass BaseViewController . This makes it impossible to use the system UIViewController subclasses like UITableViewViewController , etc.
The second way is to use a special protocol that defines the interface of the controller that can configure other controllers. Consider the following example:
protocol ViewControllerConfiguring {
var segueIDToConfigurator: [String: Configuring] { get }
}
extension ViewControllerConfiguring {
func configure(segue: UIStoryboardSegue) {
if let segueIdentifier = segue.identifier,
let configuring = segueIDToConfigurator[segueIdentifier] {
do {
try configuring.performConfiguration(of: segue.destination)
} catch let configurationError {
fatalError("Cannot configure (segue.destination). " +
"Error: (configurationError)")
}
}
}
}
class MyViewController: UIViewController, ViewControllerConfiguring {
// Define needed configurators
var segueIDToConfigurator = ...
// Each view controller still have to implement this method
override func prepare(for segue: UIStoryboardSegue, sender: Any?) {
configure(segue: segue)
}
}
This way is more flexible in comparison to the first one. The protocol can be implemented by any object that is going to configure the segue destination controller. It means that not only UIViewController subclass can use it. Moreover, it doesn’t limit us to use only the BaseViewController as a superclass. On the other hand, each view controller still needs to override prepare(for ) and call configure(segue:) method in its implementation.
Summary
In this article, I described the approach to configuring destination view controllers with clean and straightforward code when using storyboard segues. The approach is possible thanks to useful Swift concepts, such as Generics and Protocols with associated types. The code is also safe as it uses static typing wherever possible and handles errors. Meanwhile the dynamic types are concentrated in single place and the possible errors are handled only there. This approach allows us to avoid unnecessary boilerplate code in the prepare(for ) methods. On the other hand, it makes configuring particular view controllers clearer and more robust by using a specific Configurable protocol.

Grape Up consultants’ 101 – what does on-site work look like?
When I first came to Grape Up, almost two years ago, I could hardly say I did not know what to expect. The kind of work I was to be doing was known to me, as was the location. Still, I felt anxious about going over the pond and spending almost three months in a peaceful Chicago suburb. Another challenge – working with people with whom I seemingly had little in common, apart from the knowledge of the tech and language. I was kind of obsessed with those tiny details that set the American and European cultures apart – so similar, yet so different. But let me get back to where the story started.
In the first half of 2017, I happened to be looking for a different job, just when Grape Up tried to reach me. An inconspicuous e-mail, detailing a work opportunity in the United States, for a period of time, possibly in an Illinois or Texas location, appeared somehow in my inbox. I decided to bite the bullet, well knowing myself as a not-so-adventurous person – apparently, the more I thought about the implications of going abroad for a fairly long time, the more I hesitated. So, the decision was a quick one – still, I wish I knew things back then that I now do.
Because of that, to clarify matters for anybody pondering about working with Grape Up as a contractor programmer here is a little guide, which I modeled after a typical FAQ. This should be a good start – if any questions arise, do not hesitate to contact us!
Can you tell me more about the job you got?
I have been working for a big insurance company, perhaps the second largest of its kind in the US by revenue. By all means, this could be likened to working in a Polish branch of a corporation, but the work culture is quite different from what you could get in the country of my residence.
Was your job interview anyhow different from the usual?
I would say it was as good as any interview I have been to, save for one thing. Since I would be working in pairs (a very common practice in teams adhering to extreme programming), I had a short call with a technical person from the US company. I was presented with a problem, and we then tried to alternatively write tests and implementations together – the purpose was to have a quick outlook on how I would find myself in the new environment, and also for me to get a gist of how pair coding looks like. This might seem unusual at the beginning – try not to let it intimidate you!
Was getting to the USA hard?
I found the process of obtaining the necessary visa daunting. First, the ancient form on the US Embassy’s website (watch out for mistakes), then waiting for the appointment and finally getting into the queue at the Consulate. I cannot say that I did not enjoy getting that sticker in my passport – it made me proud! Apart from that, the flight itself and resulting jet lag can be physically challenging for some (myself included). Still, once that initial fatigue subsided, America was all mine to enjoy.
What did your usual day look like?
For the morning routine, we would usually drive or walk to work (had we been fortunate enough to live downtown), attend a group standup at 8AM, have a team stand-up shortly afterward and then have a complimentary breakfast, provided by our company. After working for a bit, we would head for lunch at 12 (lots of options, regardless of the location). Informal breaks also happen, more or less frequently – ping-pong and Mario Kart are among popular leisure activities in the US workplace. Workday would end at 5PM with some exceptions, such as “summer hours” on Fridays, in which case we could go home a little earlier. Still, all of this varies from company to company, and even from location to location.
What about the projects?
I happened to work on-and-off with various product teams. The projects spanned internal enterprises, such as data buses, as well as front-facing customer applications, like video chatrooms and remote consulting services. Worth noting is the fact that I have always felt like an important part of a team – little difference was being made between people working as contractors and full-time employees.
How did you find the people there?
Whether you are headed for America or otherwise, you may be in a culture shock. In America, they may seem unusually nice, in other places, to the contrary, somewhat uptight. Either way, unhelpful and rude people are a surprisingly rare occurrence. Some of them were externals, like me and we had little problem finding common ground – regardless, cultural discrepancies are a fun topic to chit-chat about.
What’s there to do in the time after?
Speaking of Chicago, depending on the closeness to the city center, there’s a lot to do or even more. Museums are abounding, as are clubs. Try eating something different every day! In the suburbs, some local Asian restaurants are well worth paying a visit. Apart from that, you may want to save some of your planned leave for visiting the other cities or sights after your assignment is completed.
Is food in the US really as unhealthy as it gets?
Depends on what you are having, of course. There are plenty of decently healthy options to choose from but finding them requires a little effort. It’s easy to end up eating junk food every day, because of the convenience, so watch your carbs while you are there.
Was there anything you felt uncomfortable with?
The 9-hour working day with an hourly lunch break takes some time to get used to. American cities are vast and half an hour drives to the nearest Wal-Mart are not uncommon while living in the suburbs. Downtown, on the other hand, while offering a lot of services within walking distance is very loud and lively – I certainly did not expect being woken up to car sirens at 2:00 in the morning on the weekends!
To sum it up, how was your experience?
Overall, quite good – I really appreciate the opportunities that on-site work was able to provide me with, like working with people from different backgrounds and getting a taste of what’s it like to live in a different country.
Would you go back?
Absolutely – as a matter of fact, I already did and came back. It has only been getting better with every new place I traveled to. I sure hope that impression lasts long enough.
Outsourcing of authorization and authentication
Nowadays, we can observe many repetitive patterns in existing implementations. From microservices, to MVC layers, or REST APIs. Authorization and authentication are the fundamental parts of application security. The most popular pattern it the login and password, frequently with the addition of two-factor authentication via SMS code, e-mail or a software token.
But the problem is more complex than it seems at first. There is a chance that every year the current “best practices” become obsolete as they fail to provide a sufficient level of security. Sometimes a critical bug, like HeartBleed, creates an earthquake in the security world and forces everyone to immediately review update their services.
To top it all off, unfortunately security is not something that’s painfully obvious for the non-technical clients - so from the business perspective it does not directly “make money”. As a result, some companies try to reduce resources spent on it. The management is more likely to spend a month on improving the appearance of a landing page than a week on improving passwords encryption.
The complexity and lack of a business reason to invest in the problem make it a great candidate to outsource . Those reasons made our customers do so.
When to delegate?
In this section I would like to list the cases which can make delegation extremely profitable.
Providers have everything we need. Almost.
Major identity providers addressed a wide range of their clients’ problems. Namely, the configuration of their service takes most likely less time than writing everything from scratch on your own. This makes even more sense when we consider startup-like projects when time is putting on us the pressure of “sell fast or die” and having a working prototype is crucial as soon as possible.
We don’t know the requirements yet.
Another problem that frequently appears in the initial phase is postponing the creation of the security model to the remote future. Writing your own temporary solution from scratch would take days and if key decisions are not made yet it would end up being rewritten again and again. Integration with an external provider in default configuration takes hours, and usually there is a free trial period (and it doesn’t always have to be expensive, Auth0 starts at $13 /month for databases less than 1k users). Migration from the external provider to your own in an optimistic case, may be as simple as changing a couple of entries in the configuration file.
Relatively high costs of support authorization.
Perfect software should not need any maintenance. Unfortunately, the reality isn’t that perfect, nor any software we write. If our services contain their own authorization mechanism it may require some changes in it even it has been coded properly long time ago. Improving security (for instance changing password encryption from MD5 to blowfish) requires a couple of days of the developer’s work. It engages other departments such as the UX team - users have to be notified in a non-invasive way, a test team - someone has to check if the new path works and check whether or not any features have been affected by it.
If your software is rarely changed and the identity management is the most common reason to change it - then rewriting the authorization mechanism to use external provider makes a lot of sense.
What should you not be afraid of?
There are cases when such delegation provides significant value, but it also comes with an additional cost.
Social networks integration
Most identity providers offer Facebook integration. It is slightly different to other social networks, because it is mandatory to fill an additional form which is required by Facebook’s bureaucracy. It also happens when you integrate Facebook SSO yourself. Integration with other social networks is easier in both approaches.
Data import
It is possible to import existing user data to an external provider. Unfortunately, in most cases it won’t be transparent from the users perspective. For example, Auth0 doesn’t import passwords even if for some reason we have them in plain text (of course, nobody has). It forces the user to set their password at next login via the password reset mechanism.
Vendor lock-in
I have mentioned before that, in an optimistic case, the migration from an external provider to your own solution may be as simple as changing configuration files. The problem is that we don’t live in a perfect world. A lot of provides share libraries that speed up integration, but make the migration to a different vendor much harder. If your software runs on a local machine or a mobile device, chances are that a certain group of users may resist to download the latest update from the store. You have to decide if you prefer to change the authorization, lose them, or provide both solutions simultaneously for some period of time.
There is a story of team, that have built their own authorization service once provider wasn’t able to handle as many requests as they need. It shows that despite the long and successful relationship with the provider, they were able to break it up and move to the totally new solution.
When not to delegate?
There are also cases when the integration is not possible or creates more problems than it actually solves.
Law and other regulations
There are governmental or organizational regulations that control how data should flow and where it can be stored. Auth0 allows you to store data somewhere in EU, but you cannot control if it is stored in Spain, Germany or Poland. Having GDPR in mind it may have consequences to store data in EU when you create a project for the United States. Also, government projects generally require all (or at least confidential) data to stay inside the country.
Costs
Most providers work in the SaaS model. It means that the monthly fee depends on the number of users and the features you use. In some rare cases, it may not scale very effectively and the invoice from the provider may get really high. In this case, you should consider preparing your own local solution for the problem. Storing user data in your own datacenters may be cheaper.
Communication with other servers
Delegation requires communication with the provider. By default, providers require to redirect users to the external or to use iframe element on your site. It is impossible to use that in the application which should, even temporarily, work without an internet connection. This sometimes forces team to create mock services for end to end automatic tests.
Integration with custom solutions
- Software that works in an internal network (for instance LDAP or Active Directory) is harder, ask your operations team if it is possible.
- Authorization with the client-side software – the most popular solution for digital signature in Poland requires the installation of the Java Applet based plugin. Integration with it, even without integrating it with an identity provider poses many obstacles.
To delegate or to do not delegate?
If you aim for PoC or MVP type of project, just integrate a trial version of the existing authorization and authentication service provider - if it’s not the core feature of your product. Start fast, implement the most important features and then, when you feel that the solution is too limited, switch to your own implementation or maybe a different provider.
What is it like to work on an on-site project?
Have you ever considered working abroad on an on-site project? Or maybe you have already tried it? Whether it's one of your goals for the upcoming year or you are just curious what the pros and cons are, it's always worth to explore other people's perspectives and scenarios of their episodes abroad. So, based on a recent episode of mine, let me share a few thoughts on the topic myself.
Different kinds of professional life abroad
There are a variety of ways to get a feeling of what it's like to work overseas. The first one is that you can get hired and work in a foreign country for a few years. Another option is to be employed by a company in your country, but work on a project abroad for, let’s say, half a year. Last but not least, you can travel to different places for just a few days on a weekly basis. My own experience below is based on a short-term contract with one of Grape Up’s US-based customers but can apply to any kind of professional experience in a foreign country in general.
Professional benefits of working on-site
While being involved in any type of project abroad you get to experience the global marketplace and have a chance to learn new ways of doing business. Interacting with people born and raised in a different country lets you understand their work culture, ethics and point of view. Failing to understand the culture norms is often a source of conflicts within geographically dispersed teams. For example, it takes time to become aware of different ways an email or conversation could be interpreted, both as a sender and a receiver. And although being on-site is not the only way to gain that experience, it is usually the most efficient and authentic one. Since you are able to meet face-to-face, you get to see the direct perspective of your international customers and peers.
Working on-site comes with all the benefits of a collaborative workspace. It goes without saying that it's easier to explain something face-to-face rather than on the phone or, let alone, via email. Especially when dealing with complex or urgent topics. There are no internet connection issues, there is just one time zone and there is a space for body language, which is quite an underestimated type of communication these days. In fact, social and teamwork-style settings are a perfect way to boost all kinds of interpersonal communication skills. Also, there is probably no better way to learn a foreign language than to be around people who use it every day, especially when those people happen to be native speakers.
Potential challenges of working on-site
Even though most of us prefer to work in a team, there are also those who like to work alone. Actually, there is a very good chance that even the most active and social teammates will need a moment alone every once in a while. Just a moment to zone out, avoid the potential distractions, focus and get their creative juices flowing. And that’s not always possible when you work on-site. If you travel to another office for a relatively short period of time to meet your customer or coworker, you want to make the most out of your visit. So usually you end up spending most of the time actively collaborating with others and there will be little time for individual work. Not only is it more intense but it also takes a lot of discipline and flexibility, which some may find quite challenging, especially at the beginning.
Another thing is that travelling to one office means missing out on events and meetings happening in the other office. You are solving a problem of your absence in one place but at the same time you are creating a similar problem somewhere else. So, it's always a matter of choosing which place is more beneficial to you and your company at a given moment.
Personal pros and cons of living abroad
What does living abroad really come with? Well, this part can vary in as many ways as there are people who have ever lived in a foreign country for a while. Some point out the ability to explore new places, cultures and cuisines. Others are happy to learn or practice their language skills. There are also those who do the exact same things as they would do in their hometowns, with the exception of leveraging the presence of local people and resources. Whether you choose to immerse yourself in a country or not, living abroad always gives you new perspectives and new ways of looking at things. And that's gold.
Of course, there are also the downsides of being away from your home country. Depending on what your current situation is, it very often means that you have to leave your home, family and friends for some period of time. You need to learn how to live without some people and things you got used to having around, or you can find a way to take them with you. For some people it can also be overwhelming to deal with all the cultural differences, local habits and the number of new things in general. It all depends on how open and flexible you are.
Summary
Getting a taste of living and working abroad has become very popular these days - and not without a reason. For one, it is easier than ever before, and it also gives you countless benefits and the kinds of experiences you wouldn't gain in any other way. So, if it has ever crossed your mind and if you ever come across such an opportunity , don't hesitate to take it.
STAMP - Satisfying Things About Managing Projects
Project Managers really are in the driver’s seat when it comes to creating new products. Compare it to a bumpy road - there are deadlines, a solid dose of uncertainty, and plenty of planning along the way, but on the flip side, there also these truly satisfying moments associated with that position which I tend to label as: Satisfying Things About Managing Projects. And here they are:
Making a difference
As the stakes get higher, the vision of taking the lead and being in charge can be quite paralyzing for some. Others on the other hand will find it really satisfying. This is why the role of an effective Project Manager is so important. A person on such position will lead with an understanding that if they drive an idea or IT project towards success, a real difference can be made. No one will ever know the world we would live in if all those ideas and projects had been executed perfectly. What we can imagine, though, is the impact and value that can be added not only to the business, but through the world at large.
Building amazing things
This one is self-explanatory. Regardless of market competition and the constraints provided by stakeholders, it feels good to know that you are creating something that will meet or exceed expectations. Whether your task is to solve a complex problem, improve an already existing solution or create something new, yet desired, it is crucial to believe that you can do great - if only you are able to pass that feeling on your team, it will motivate them to work hard and accomplish amazing things together.
Being always able to perform better
Think about the spreadsheets tracking status of a project. How do they make you feel? Motivated and excited? Most likely not. At first thought, we do not think of spreadsheets as the beginning of achieving a goal. According to the SMART principle, goals should be measurable. I realized that during my time as a software developer, I found it difficult to set measurable goals. I would always think to myself: How do I measure this if the architecture I created is already good? How can I quantify whether my code was easy to maintain and extend, so I know how much better it gets over time?
As a Project Manager this is no longer the case - you are surrounded by precise numbers, relentless dates, and unswerving percentages. You know what are the costs, you know the ROI (return of investment) and plenty of other metrics. You are able to compare this to the rules in sports where you know your scores and all the statistics. The environment is perfect for setting and reaching measurable goals and endless opportunities to adapt and perform better.
Quick throwback to the spreadsheets. Can you see all the available opportunities now?
Watching people grow
Being a Project Manager, just like any other manager, gives you the opportunity to work with many people. Some may see this as one of the most difficult aspects within the Project Manager role. But it is important to keep in mind, that in this role you have the chance to create an open communication and bring your team together in order to be more efficient. A manager also has the opportunity to help individuals grow and develop from the very beginning of a project till its very end . Knowing you had a hand in someone's development is very gratifying.
Overcoming challenges
There are plenty of them. During the execution of every project, regardless of internal or external factors, a lot of unexpected things can happen.
You need to adapt and react quickly to be most efficient at change and risk management. Not only that, but also today’s solutions are the beginning of tomorrow’s problems. This can perhaps be a pessimistic way to see things, but there is a grain of truth in it. There will always be challenges to overcome. The beauty is that after achieving any milestone, you can take a look back from the top of that mountain. From that peak, you will be able to see this steep and bumpy road, all the past iterations and realize that these were the things that you and your team have overcome to get to the top. This is truly a great feeling of pride, reward, satisfaction and accomplishment.
Server Side Swift – quick start
Building Swift web applications allows you to reuse the skills you already have. However, you can also start from scratch if you are not an ”iPhone mac„ developer. This article shows you the most popular Server-Side Swift frameworks and lets you dive into the world of faster and safer APIs using Swift.
Swift was released in 2014. Ever since then, it has become a popular solution for the iOS and macOS development. Since Swift was the open source and people started playing with it. There were a lot of attempts to find other usages of Swift. They turned out to be perfect for the server-side while being faster and safer than other languages. The next step in the process was to apply Swift to the server-side development. Here, it is important to mention that Swift can be compiled on macOS as well as Linux and even Windows. Moreover, some frameworks allow developers to create cloud applications .
Just after Server-Side Swift has been released I felt the urge to take a quick look on it. It was really hard to tell if it at that point, it was ready for commercial use. Now, as I look at it, I would say it is stable enough. So let’s try to compare the most popular frameworks. Personally, I would recommend trying each framework before you even pick the one that works best for you – there are slight differences between them.
Currently, the most popular Server-Side Swift frameworks are Vapor, Perfect and Kitura. There are also a few other ones such as Zewo and NozelIO, however they’re not as popular, but that doesn’t take away from their value. As a matter of fact, I looked into each framework and my verdict is: Perfect and Vapor.
Why Server-Side Swift?
A few years ago, when Server-Side Swift was still new to me, I wasn’t convinced that it would be the optimal language for backend specific. Why? Because it worked just like every other backend solution and there was nothing particularly specific in it making it special, but still for me as an IOS developer it allowed me to be at a full-stack. I know Java and JS and, in my opinion, the newest technologies are good to get hold of mainly because they let us become better developers. I haven’t found too many tutorials or articles about it. Certainly not as many as there are about Java or JS. Therefore, you have to create lots of things on your own. In my opinion, Swift is also faster than other languages. If you want to compare it with others, here is the benchmark server-side swift frameworks vs nodeJS.
Tools
SPM - Swift Package Manager - manages the distribution Swift code, integrated with the build system to automate downloading, compiling and linking dependencies process runs on Mac and Linux.
XCode – Apple IDE to compile and debug Obj-C and Swift code.
AppCode – Jetbrains IDE for compile and debug Obj-C and Swift code.
Other text editors like Brackets, VS Code, Sublime etc. + SPM
There are also a bunch of very specific tools for the frameworks and I will tell a bit more about that in a quick overview below.
Overview
Vapor
It has a very active community and simple syntax as well. This framework is mostly focused on being written purely in Swift. Just as the Vapor - Swift is a very readable and understandable API, due to the fact that it keeps the naming and conventions.
Data formats:
JSON, XML
Databases:
MySQL, PostgresSQL, SQLite, MongoSB
Cloud:
Heroku, Amazon Web Services and Vapor Cloud
Tools:
Vapor toolbox
Perfect:
The most popular framework for the server-side swift development and as the author claims, it is production ready and can be used with commercial products. This one is highly recommended to use as it’s big, powerful and fast. The framework is updated on a monthly basis.
Data formats:
JSON, XML, native support for direct operations on files, directories and .zip files
Databases:
MySQL, PostgresSQL, SQLite, CouchDB, MongoSB, MariaDB, FileMaker
Cloud:
Heroku, Amazon Web Services
Tools:
Perfect Assistant
Kitura:
This Framework is like a WebFramework. Kitura is unique in its approach to databases. Example SQL DB types Kitura uses abstraction layer called "Kuery" instead of "Query". Kuery supports MySQL, SQLite and PostgreSQL. Kitura also has support for Redis, CouchDB, Apache Cassandra and ScyllaDB, but through native packages these are not related to Kuery.
Supported Data formats:
JSON, Aphid MQTT (IoT/IoT Messaging)
Databases:
MySQL, PostgresSQL, SQLite, CouchDB, Apache Cassandra, ScyllaDB
Cloud:
Heroku, Amazon Web Services, Pivotal Web Services, IBM Bluemix
Tools:
Kitura CLI
Summary
Server-Side Swift is a fast growing solution and can be used commercially with the newest technologies like cloud. After a few years, we have acquired a mature language and amazing frameworks which constantly make Server-Side Swift better. When it comes to the Vapor and Perfect, both of them seems to be in a pretty good shape by now. Vapor, for example, is growing quite fast since its first release in September 2016 and currently there is 3.1 version of it available. Perfect has similar qualities and was first released in November 2015. As I mentioned before, I would personally recommend trying to play a bit with each framework before choosing the right one.
Tutorials and code examples
Perfect
Vapor
Kitura
Swift NIO:
Released by Apple on 1st March 2018 – low-level, cross platform, event driven network application framework.
Other frameworks
There are also Zewo and NozelIO but those just based on Swift and Zewo is a Go-Style framework, NozelIO is the node.js style framework.
Swift for specific OS
Key takeaways from XaaS Evolution Europe: IaaS, PaaS, SaaS
At Grape Up we attend multiple events all over the globe, particularly those that focus on cloud-native technologies, gather thousands of attendees and have hundreds of stunning keynote presentations.
But keeping in mind the fact that beauty comes in all sizes, we also exhibit at smaller, but just as important events such as the XaaS Evolution Europe which took place on November 26-27 at the nHow hotel Berlin.
With only 100 exclusive attendees and a few exhibiting vendors, XaaS stresses the importance of delivering a great and professional networking experience through its unique “Challenge your Peers”, “Icebraker” and “Round Tabele” sessions.
Summary
It was great to see that we are in the right place at the right time with our business model: digital transformation, moving workloads to the cloud, and market disruption are still hot topics among decision makers across Europe. We had great conversations which we hope will convert to business opportunities and long-lasting partnerships!
About the event
XaaS Evolution Europe 2018 is the only all-European XaaS use and business cases' event. IT decision-makers from large as well as medium size companies from all major industries meet to present their case studies and discuss major challenges, strategies, integration approaches and technological solutions related to the practical implementation of cloud services. Among those great presentations our very own Roman Swoszowski presented Cloudboostr as a go to platform for all those companies that want to avoid vendor lock-in and use open source but in the same time have Enterprise Support and professional enablement partner.

Secure Docker images
Containers are great. They allow you to move faster with your development team, deploy in reliable and consistent way and scale up to the sky. With some orchestrators it is even better. It helps you grow faster, use more containers, accelerate growth even more and use even more containers. Then, at some point you may wonder how I can be sure that the container I have just started or pulled is the correct one? What if someone injected there some malicious code and I did not notice? How can I be sure this image is secure? There has to be some tool that guarantees us such confidence… and there is one!
The update framework
The key element that helps and in fact solves many of those concerns is The Update Framework (TUF) that describes the update system as “secure” if:
- “it knows about the latest available updates in a timely manner
- any files it downloads are the correct files, and,
- no harm results from checking or downloading files.”
(source: https://theupdateframework.github.io/security.html)
There are four principles defined by the framework that makes almost impossible to make a successful attack on such update system.
The first principle is responsibility separation. In other words, there are a few different roles defined (that are used by e.g. the user or server) that are able to do different actions and use different keys for that purpose.
The next one is the multi-signature trust. Which simply says that you need a fixed number of signatures which has to come together to perform certain actions, e.g. two developers using their keys to agree that a specific package is valid.
The third principle is explicit and implicit revocation. Explicit means that some parties come together and revoke another key, whereas implicit is when for e.g. after some time, the repository may automatically revoke signing keys.
The last principle is minimize individual key and role risk. As it says, the goal is to minimize the expected damage which can defined by the probability of event happening and the impact. So if there is a root role with high impact to the system the key it uses is kept offline. The idea of TUF is to create and manage a set of metadata, signed by corresponding roles which provide general information about the valid state of repository at a specified time.
Notary
The next question is: how can a Docker use this update framework and what does it mean to you and me? First of all, a Docker already uses it in the Content Trust which definition seems to answer our first question about the image correctness. As per documentation:
“Content trust provides the ability to use digital signatures for data sent to and received from remote Docker registries. These signatures allow client-side verification of the integrity and publisher of specific image tags.”
(source: https://docs.docker.com/engine/security/trust/content_trust)
To be more precise, Content Trust does not use TUF directly. Instead, it uses Notary, a tool created by Docker which is an opinionated implementation of TUF. It keeps the TUF principles so there are five roles with corresponding keys, same as in TUF, so we have:
- root role – it uses the most important key that is used to sign the root metadata, which specifies other roles so it is strongly advised to keep it securely offline,
- snapshot role – this role signs snapshot metadata that contains information about filenames, sizes, hashes of other (root, target and delegation) metadata files so it ensures the user about their integrity. It can be held by the owner or admin or the Notary service itself,
- timestamp role – using timestamp key Notary signs metadata files which guarantees freshness of the trusted collection, because of short expiration time. Due to that fact it is kept by Notary service to automatically regenerate when it will be outdated,
- target role – it uses the target’s key to sign the target’s metadata file with information about files in the collection (filenames, sizes and corresponding hashes) and it should be used to verify the integrity of the files inside the collection. The other usage of the target key is to delegate trust to other peers using delegation roles,
- delegation role – which are pretty similar to the target role but instead of the whole content of repository, those keys ensure integrity of some (or sometimes all) of the actual content. They also can be used to delegate trust to other collaborators via lower level delegation role.
All this metadata can be pulled or pushed to the Notary service. There are two components in the Notary service – server and signer. The server is responsible for storing the metadata (those files generated by TUF framework underneath) for trusted collections in an associated database, generating the timestamp metadata and - most importantly - validating any uploaded metadata. Notary signer stores private keys, it is done not to keep them in the Notary server and in case of request from Notary server, it signs metadata for it. In addition, there is a Notary CLI that helps you manage trusted collections and supports Content Trust with additional functionality. The basic interaction between client, server and service can be described when the client wants to upload new metadata. After authentication, and if required, the metadata is validated by the server it generates timestamp metadata (and sometimes snapshot based on what has changed) and send it to the Notary signer for signing. After that, the server stores the client metadata, timestamp and snapshot metadata which ensure that the client files are valid and it their most recent versions.
What's next?
It sounds like a complete solution and it surely is one, but just for one particular area of threats. There are a lot of other threats that just sit there and wait to impact your container images. Along with those problems there are solutions:
- Vulnerability Static analyzer, which scans container images for any known vulnerabilities (mostly based on CVE databases),
- Container firewalls or activity monitors designed to detect some inappropriate behavior when your application is running,
- There are plenty of “Best practices for secure Docker images” – rules that you should follow when creating a Docker image,
- and many more…

How to avoid cloud-washed software?
The term "cloud-washed" was invented in the exact same way as the phrase "green-washed" came into being, which was used to describe products that don’t have anything to do with being "eco", but were sold in "green" packaging. The same with cloud. There is a trend in the software development community where many companies take perfect advantage of the cloud computing hype and re brand their products as "cloud", while in reality their solutions don’t have much in common with cloud. But first, let’s define what exactly "cloud washing" is:
Companies stick a "cloud" label on their products in order to stay on this competitive market. The only thing that they don’t do is explain whether it is cloud-native, cloud-based or something else.
Don’t get lost in the clouds
In order for you to easily expose fake cloud solution, I have prepared a list of questions to ask cloud solutions vendors to make sure you are buying a product with all the benefits of cloud-native software.
1. Is the platform hosted in the cloud or does it rely on an on-site server?
If the platform is hosted purely in the cloud with proper backup strategy, availability zones and replication in place, you will not be affected in case the server fails and should not worry a lot about data loss. But if it’s an on-site server, be sure to expect an outage when the server fails make sure there are backups – preferably in the different data center.
2. Is the service multi-tenant or single-tenant?
In the case of single-tenant services, support may not be as dedicated as you would expect it to be. Some issues might take weeks to resolve. Multi-tenant and cloud-based are a much better option, but only when you go cloud-native can you expect the best support, scalability and quick fixes. Also, cloud native platforms provide better level of system-level security for all deployed services.
3. How often are updates and new features released? Do they require downtime?
The answer is simple, if updates require downtime, it’s not cloud-native at all. If the features are available immediately, the software is cloud-native. Also, critical updates are deployed to all customers. On top of that, there is no disruption in service once they are deployed, because rolling update strategies are already in place. In addition, when failure happens rollback to previous version can be done immediately, or even automatically.
4. Who is responsible for security? Do you include security certifications or do I need to pay extra?
Remember one rule, cloud-native software is secure by definition . Cloud platforms "by design" are more secure because the whole system layer is abstracted from the developers and therefor easier to update with the latest security patches.
Continuous deployment of iOS apps with Fastlane
Automation helps with all the mundane and error-prone tasks that developers need to do on a daily basis. It also saves a lot of time. For automating iOS beta deployment, a very popular tool is Fastlane. The tools automate entire iOS CI/CD pipelines and allow us to keep an iOS infrastructure as code. Today I will share my observations and tips regarding setting up fastlane for iOS project.
Setting up Jenkins
Jenkins is an open-source automation server, but you can use fastlane on your local machine too. However, a separate build server can certainly help you create a more streamlined process.
The Jenkins installation process is pretty straightforward, so I will not be going into details here. But there are some quirks that we should take into consideration.
To elevate the problem with detached HEAD, we should provide Branch Specifier with „origin” e.g. „origin/master” and choose the option Check out to specific local branch with branch name including ** . For more details, see the Jenkins' help.
All the tool commands should be put in the Execute shell phase.
Setting up Fastlane
Fastlane is used to simplify deployment of iOS and Android apps. It is well documented and its community always tries to help in case of any bugs etc. We can install it using Homebrew or RubyGems and I personally recommend using the latter. I stumbled upon some problems during installation of fastlane plugins after using `brew` to install fastlane.
To integrate the tool with our project, we should open its directory in terminal and type:
fastlane init
It will start a very intuitive creator that guides us through the process of setting up fastlane for our project. After this process is finished, we have configured it. Now we can customize and create new lanes.
Fastlane lanes are written in Ruby. Even if you are unfamiliar with this programming language, learning the basics that are needed to configure it shouldn't take too long. There is also a version of fastlane that supports Swift. However, it is still in beta.
Fastlane tips
The tool provides a few ways of handling code signing e.g. „cert” and „sigh” or „match”. However, if you plan to use fastlane mainly on CI/CD server you can rely on automatic code by signing in Xcode and installing the certificates manually on that machine. In that case you don't need to use any of those actions in your lanes.
If you prefer to move your Fastfile (fastlane configuration file) to a different directory than the project's directory, you will have to provide manually paths to the actions. In that case it is better to use absolutes paths since when you just use ../ prefix you may end up in a different directory that you would expect.
Error block error do |lane, exception| is very useful for error notifications. For example, you can post message to Slack when lane executed by the CI server failed.
DevOps Enterprise Summit 2018: Driving the future of DevOps
What happens when you gather 1500 attendees, more than 50 speakers and a few hundred media representatives under one roof? The answer is DevOps Enterprise Summit – one of the largest global events devoted to DevOps enabling top technology and business leaders from around the world to learn and network for 3 days in a row.
DevOps Enterprise Summit describes itself as an „unfolding documentary of ongoing transformations which leaders are helping drive in their large, complex organizations”. The atmosphere at the Cosmopolitan Hotel in Las Vegas, the event venue, we could literally feel the excitement of all the attendees throughout the whole time. Everything thanks to the openness of the attendees to learning, connecting and new experiences from peers from the industry. Throughout the discussions, we have also gotten inspired by key thought leaders and industry experts and found the answers to constantly debated questions.
As Grape Up, we had over 180 visitors in just 3 days at our booth. All of them were genuinely interested in our services, both those who knew our company from previous events and those who haven’t heard of us yet (well, now they have). On top of that, we have seen one of the biggest domestic airlines in the US, that had delegated over 70 of her employees to DOES to learn. The DevOps Enterprise Summit was definitely the event of the year for this company and served the purpose of helping further accelerate their digital transformation – from our perspective this is a company that is going all-in DevOps. There have also been several others companies who have come to Las Vegas all the way from New Zealand – this is also a great example of the global nature of digital transformation.
Our new product, Cloudboostr, has really caught the eye of many visitors. The ability to run any workload anywhere, using enterprise-grade open source, supported by an experienced company like Grape Up who has been around for over a decade, has proved to be a winning combination. Apart from booth visitors, we have also collected many inquiries from large companies who are already interested in the product. The future for Cloudboostr as Grape Up’s first product looks bright.
Overall, the DevOps Enterprise Summit has been a successful event for Grape Up. Besides having met many DevOps enthusiasts, we had the opportunity to get to know plenty of sponsors who are also delivering amazing value through their products and services . The event definitely feels like a one-stop-shop for all needs DevOps.
Yet another look at cloud-native apps architecture
Cloud is getting extremely popular and ubiquitous. It’s everywhere. Imagine, the famous “everywhere” meme with Buzz and Woody from Toy Story in which Buzz shows Woody an abundance of...whatever the caption says. It’s the same with the cloud.
The original concepts of what exactly cloud is, how it should or could be used and adopted, has changed over time. Monolithic applications were found to be difficult to maintain and scale in the modern environments. Figuring out the correct solutions has turned into an urgent problem and blocked the development of the new approach.
Once t he cloud platform like Pivotal Cloud Foundry or Kubernetes is deployed and properly maintained , developers, managers and leaders step in. They start looking for best practices and guidelines for how cloud applications should actually be developed and how these apps should operate. Is it too little too late? No, not really.
If cloud platforms were live creatures, we could compare them to physical infrastructure. Why? Because they both don't really care if developers deploy a huge monolith or well-balanced microservices. You can really do anything you want, but before you know it, will be clearly visible that the original design does not scale very well. It may fail very often and is virtually impossible to configure and deploy it on different environments without making specific changes to the platform or extremely complex and volatile configuration scripts.
Does a universal architecture exist?
The problem with the not-really-defined cloud architecture led to the creation of the idea of the “application architecture” which performs well in the cloud. It should not be limited to the specific platform or infrastructure, but a set of universal rules that help developers bootstrap their applications. The answer to that problem was constituted in Heroku, one of the first commonly used PaaS platforms.
It’s a concept of twelve-factor applications which is still applicable nowadays, but also endlessly extended as the environment of cloud platforms and architectures mutate. That concept was extended in a book by Kevin Hoffman, titled "Beyond Twelve-Factor App" to the number of 15 factors. Despite the fact that the list is not the one and only solution to the problem, it has been successfully applied by a great deal of companies. The order of factors is not important, but in this article, I have tried to preserve the order from the original webpage to make the navigation easier. Shall we?
I. Codebase
There is one codebase per application which is tracked in revision control (GIT, SVN - doesn’t matter which one). However, a shared code between applications does not mean that the code should be duplicated - it can be yet another codebase which will be provided to the application as a component, or even better, as a versioned dependency. The same codebase may be deployed to multiple different environments and has to produce the same release. The idea of one application is tightly coupled with the single responsibility pattern. A single repository should not contain multiple applications or multiple entry points - it has to be a single responsibility, a single execution point code that consists of a single microservice.
II. Dependencies
Dependency management and isolation consist of two problems that should be solved. Firstly, it is very important to explicitly declare the dependencies to avoid a situation in which there is an API change in the dependency which renders the library useless from the point of the existing code and fails the build or release process.
The next thing are repeatable deployments. In an ideal world all dependencies should be isolated and bundled with the release artifact of the application. It is not always entirely achievable, but should be done and it should be possible too. In some platforms such as Pivotal Cloud Foundry this is being managed by buildpack which clearly isolates the application from, for example, the server that runs it.
III. Config
This guideline is about storing configuration in the environment. To be explicit, it also applies to the credentials which should also be securely stored in the environment using, for example, solutions like CredHub or Vault. Please mind that at no time the credentials or configuration can be a part of the source code! The configuration can be passed to the container via environment variables or by files mounted as a volume. It is recommended to think about your application as if it was open source. If you feel confident to push all the code to a publicly accessible repository, you have probably already separated the configuration and credentials from the code. An even better way to provide the configuration will be to use a configuration server such as Consul or Spring Cloud Config.
IV. Backing services
Treat backing services like attached resources. The bound services are for example databases, storage but also configuration, credentials, caches or queues. When the specific service or resource is bound, it can be easily attached, detached or replaced if required. This adds flexibility to using external services and, as a result, it may allow you to easily switch to the different service provider.
V. Build, release, run
All parts of the deployment process should be strictly separated. First, the artifact is created in the build process. Build artifact should be immutable. This means the artifact can be deployed to any environment as the configuration is separated and applied in the release process. The release artifact is unique per environment as opposed to the build artifact which is unique for all environments. This means that there is one build artifact for the dev, test and prod environments, but three release artifacts (each for each environment) with specific configuration included. Then the release artifact is being run in the cloud. Kevin adds to this list yet another discrete part of the process - the design which happens before the build process and includes (but is not limited) to selecting dependencies for the component or the user story.
VI. Stateless processes
Execute the application as one or more stateless processes. One of the self-explanatory factors, but somehow also the one that creates a lot of confusion among developers. How can my service be stateless if I need to preserve user data, identities or sessions? In fact, all of this stateful data should be saved to the backing services like databases or file systems (for example Amazon S3, Azure Blob Storage or managed by services like Ceph). The filesystem provided by the container to the service is ephemeral and should be treated as volatile. One of the easy ways to maintain microservices is to always deploy two load balanced copies. This way you can easily spot an inconsistency in responses if the response depends on locally cached or stateful data.
VII. Port binding
Expose your services via the port binding and avoid specifying ports in the container. Port selection should be left for the container runtime to be assigned on the runtime. This is not necessarily required on platforms such as Kubernetes. Nevertheless, ports should not be micromanaged by the developers, but automatically assigned by the underlying platform, which largely reduces the risk of having a port conflict. Ports should not be managed by other services, but automatically bound by the platform to all services that communicate with each other.
VIII. Concurrency
Services should scale out via the process model as opposed to vertical scaling. When the application load reaches its limits, it should manually or automatically scale horizontally. This means creating more replicas of the same stateless service.
IX. Disposability
Application should start and stop rapidly to avoid problems like having an application which does not respond to healthchecks. Why? Because it starts (which may even result in the infinite loop of restarts) or cancels the request when the deployment is scaled down.
X. Development, test and production environments parity
Keeping all environments the same, or at least very similar, may be a complex task. The difficulties vary from VMs and licenses costs to the complexity of deployment. The second problem may be avoided by properly configured and managed underlying platform. The advantages of the approach is to avoid the "works for me" problem which gets really serious when happens on production which is automatically deployed and the tests passed on all environments except production because totally different database engine was used.
XI. Logs
Logs should be treated as event streams and entirely independent of the application. The only responsibility of the application is to output the logs to the stdout and stderr streams. Everything else should be handled by the platform. That means passing the logs to centralized or decentralized store like ELK, Kafka or Splunk.
XII. Admin processes
The administrative and management processes should be run as "one-off". This actually self-explanatory and can be achieved by creating Concourse pipelines for the processes or by writing Azure Function/AWS Lambdas for that purpose. This list concludes all factors provided by Heroku team. Additional factors added to the list in "Beyond Twelve-Factor App" are:
XIII. Telemetry
Applications can be deployed into multiple instances which means it is not viable anymore to connect and debug the application to find out if it works or what is wrong. The application performance should be automatically monitored, and it has to be possible to check the application health using automatic health checks. Also, for specific business domains telemetry is useful and should be included to monitor the current and past state of the application and all resources.
XIV. Authentication and authorization
Authentication, authorization, or the general aspect of security, should be the important part of the application design and development, but also configuration and management of the platform. RBAC or ABAC should be used on each endpoint of the application to make sure the user is authorized to make that specific request to that specific endpoint.
XV. API First
API should be designed and discussed before the implementation. It enables rapid prototyping, allows to use mock servers and moves team focus to the way services integrate. As product is consumed by the clients the services are consumed by different services using the public APIs - so the collaboration between the provider and the consumer is necessary to create the great and useful product. Even the excellent code can be useless when hidden behind poorly written and badly documented interface. For more details about the tools and the concept visit API Blueprint website.
Is that all?
This is very extensive list and in my opinion from technical perspective this is just enough to navigate the cloud native world. On the other hand there is one more point that I would like to add which is not exactly technical, but still extremely important when thinking about creating successful product.
XVI. Agile company and project processes
The way to succeed in the rapidly changing and evolving cloud world is not only to create great code and beautiful, stateless services. The key is to adapt to changes and market need to create the product that is appreciated by the business. The best fit for that is to adopt the agile or lean process, extreme programming, pair programming . This allows the rapid growth in short development cycles which also means quick market response. When the team members think that their each commit is a candidate to production release and work in pairs the quality of the product improves. The trick is to apply the processes as widely as possible, because very often, as in Conway's law, the organization of your system is only as good as organizational structure of your company.
Summary of cloud-native apps
That’s the end of our journey through to the perfect Cloud-Native apps. Of course this is not the best solution to every problem. In the real world we don’t really have handy silver bullets. We must work with what we’ve got, but there is always room for improvement. Next time when you design your, hopefully, cloud-native apps, bear these guidelines in mind.

Key takeaways from Cloud Foundry Summit Europe 2018 in Basel
This year's Cloud Foundry Summit Europe was held in Basel, Switzerland. As a company which strongly embraces the cloud, we could simply not miss it! Throughout the event, all visitors to our Silver Sponsor booth no. 15 could not only discuss all things cloud-native, but also drink a cup of our delicious, freshly brewed vanilla coffee. First, lets take a look at some numbers from the event. There were:
- 144 keynotes, break notes and lightning talks
- 65 member companies
- 8 certified platforms
- 961 registered attendees
Why Cloud Foundry Summit?
However, coffee wasn’t the only reason we traveled over 1000 kilometers. What mattered to us was the impressive conference line-up. We were hungry for the upcoming tech news, to see what’s trending and, of course, to learn new things. By the very looks of the schedule we could tell that the European edition in Basel was slightly different from the Boston edition earlier this year.
Everyone’s talking about Kubernetes with Cloud Foundry
Let’s focus first on serverless. This topic has either been exhausted or has only been a temporary fling among the international circles. Why? Because this year’s edition has only devoted two speeches in the Containers and Serverless track to FaaS. Whereas, 6 months ago in Boston the number of speeches about it was twice as big. One more reason for that might be the growing popularity of Kubernetes. There were 6 tracks and, apart from Contrainers and Serverless, each had at least one speech about K8S/containers.
Currently, the interest in Kubernetes is so palpable and obvious that even Cloud Foundry themselves confirmed it by announcing a CF Containerization project:
But there’s more…
Finally, it's worth mentioning the second project approved by Cloud Foundry - Eirini - which brings the CF closer to K8S and enables using Kubernetes as a container scheduler in the Cloud Foundry Application Runtime. It means nothing else but the fact that we are getting closer to KubeFoundry or CloudFubernetes - platforms from platforms.
Our anncouncement
During the Summit, one of the most important moments for us was the announcement of our new product, Cloudboostr , an Open Cloud Platform which is a complete cloud-native software stack that integrates open-source technologies like Cloud Foundry and Kubernetes. Thanks to Cloudboostr, companies can build, test, deploy and operate any workload on public, private or hybrid cloud.
Co-author: Julia Haleniuk
A day in the life of a Business Development Manager
Have you ever wondered what it's like to be a Business Development Manager? Marcin Wiśniewski of Grape Up, shares his experience and tips for successful business development management.
1. Hi Marcin, what is your background?
It’s absolutely non-technical and I have a degree in Management and Marketing which can be quite unusual as for someone who works in IT. But I just can’t help the fact that I like all these outlandish tech gimmicks and news. And I like learning new things – which is the crucial part of my job.
2. Why did you decide on a career in business development?
I don’t recall making any big decision of a lifetime to work in sales. What I do know is that I have always wanted to have a career which would allow me to meet new people, discover new views of the world, new beliefs and opinions. I like to talk, travel, I like to be around. But what gives me a rush of adrenaline is the intensity which comes with the sales process. So maybe not intentionally, but I have found myself in the right place.
3. What does your typical day at the office look like? Is there a typical day at all?
I don’t really have a typical day at work. Of course, there are tasks or processes which are repetitive and we do them according to a pattern, but it’s always about a different company, different people, new conferences, new challenges. Therefore, each and every case requires an individual approach.
4. What do you love most about the job and what is its most challenging aspect?
I like it that we work in a niche part of the IT market mainly abroad. We cooperate with Fortune 500 companies which is the most exciting and challenging part of the job at once. Selling to Fortune 500 companies which are basically dream clients isn’t easy-peasy so once you do it, that’s something to be proud of!
5. What competencies do you think makes a good Business Development Manager?
I’m not sure how my colleagues from the industry would answer this question, but I like people, I like talking to them and, of course, learning new things. And my job incorporates all of it, which is exactly why I love what I do.