Secure Docker images

Containers are great. They allow you to move faster with your development team, deploy in reliable and consistent way and scale up to the sky. With some orchestrators it is even better. It helps you grow faster, use more containers, accelerate growth even more and use even more containers. Then, at some point you may wonder how I can be sure that the container I have just started or pulled is the correct one? What if someone injected there some malicious code and I did not notice? How can I be sure this image is secure? There has to be some tool that guarantees us such confidence… and there is one!
The update framework
The key element that helps and in fact solves many of those concerns is The Update Framework (TUF) that describes the update system as “secure” if:
- “it knows about the latest available updates in a timely manner
- any files it downloads are the correct files, and,
- no harm results from checking or downloading files.”
(source: https://theupdateframework.github.io/security.html)
There are four principles defined by the framework that makes almost impossible to make a successful attack on such update system.
The first principle is responsibility separation. In other words, there are a few different roles defined (that are used by e.g. the user or server) that are able to do different actions and use different keys for that purpose.
The next one is the multi-signature trust. Which simply says that you need a fixed number of signatures which has to come together to perform certain actions, e.g. two developers using their keys to agree that a specific package is valid.
The third principle is explicit and implicit revocation. Explicit means that some parties come together and revoke another key, whereas implicit is when for e.g. after some time, the repository may automatically revoke signing keys.
The last principle is minimize individual key and role risk. As it says, the goal is to minimize the expected damage which can defined by the probability of event happening and the impact. So if there is a root role with high impact to the system the key it uses is kept offline. The idea of TUF is to create and manage a set of metadata, signed by corresponding roles which provide general information about the valid state of repository at a specified time.
Notary
The next question is: how can a Docker use this update framework and what does it mean to you and me? First of all, a Docker already uses it in the Content Trust which definition seems to answer our first question about the image correctness. As per documentation:
“Content trust provides the ability to use digital signatures for data sent to and received from remote Docker registries. These signatures allow client-side verification of the integrity and publisher of specific image tags.”
(source: https://docs.docker.com/engine/security/trust/content_trust)
To be more precise, Content Trust does not use TUF directly. Instead, it uses Notary, a tool created by Docker which is an opinionated implementation of TUF. It keeps the TUF principles so there are five roles with corresponding keys, same as in TUF, so we have:
- root role – it uses the most important key that is used to sign the root metadata, which specifies other roles so it is strongly advised to keep it securely offline,
- snapshot role – this role signs snapshot metadata that contains information about filenames, sizes, hashes of other (root, target and delegation) metadata files so it ensures the user about their integrity. It can be held by the owner or admin or the Notary service itself,
- timestamp role – using timestamp key Notary signs metadata files which guarantees freshness of the trusted collection, because of short expiration time. Due to that fact it is kept by Notary service to automatically regenerate when it will be outdated,
- target role – it uses the target’s key to sign the target’s metadata file with information about files in the collection (filenames, sizes and corresponding hashes) and it should be used to verify the integrity of the files inside the collection. The other usage of the target key is to delegate trust to other peers using delegation roles,
- delegation role – which are pretty similar to the target role but instead of the whole content of repository, those keys ensure integrity of some (or sometimes all) of the actual content. They also can be used to delegate trust to other collaborators via lower level delegation role.
All this metadata can be pulled or pushed to the Notary service. There are two components in the Notary service – server and signer. The server is responsible for storing the metadata (those files generated by TUF framework underneath) for trusted collections in an associated database, generating the timestamp metadata and - most importantly - validating any uploaded metadata. Notary signer stores private keys, it is done not to keep them in the Notary server and in case of request from Notary server, it signs metadata for it. In addition, there is a Notary CLI that helps you manage trusted collections and supports Content Trust with additional functionality. The basic interaction between client, server and service can be described when the client wants to upload new metadata. After authentication, and if required, the metadata is validated by the server it generates timestamp metadata (and sometimes snapshot based on what has changed) and send it to the Notary signer for signing. After that, the server stores the client metadata, timestamp and snapshot metadata which ensure that the client files are valid and it their most recent versions.
What's next?
It sounds like a complete solution and it surely is one, but just for one particular area of threats. There are a lot of other threats that just sit there and wait to impact your container images. Along with those problems there are solutions:
- Vulnerability Static analyzer, which scans container images for any known vulnerabilities (mostly based on CVE databases),
- Container firewalls or activity monitors designed to detect some inappropriate behavior when your application is running,
- There are plenty of “Best practices for secure Docker images” – rules that you should follow when creating a Docker image,
- and many more…

Grape Up guides enterprises on their data-driven transformation journey
Ready to ship? Let's talk.
Check related articles
Read our blog and stay informed about the industry's latest trends and solutions.
Common Kubernetes failures at scale
Currently, Vanilla Kubernetes supports 5000 nodes in a single cluster. It does not mean that we can just deploy 5000 workers without consequences - some problems and edge scenarios happen only in the larger clusters. In this article, we analyze the common Kubernetes failures at scale, the issues we can encounter if we reach a certain cluster size or high load - network or compute.
Incorrect size
When the compute power requirements grow, the cluster grows in size to house the new containers. Of course, as experienced cluster operators , while adding new workers, we also increase master nodes count. Everything works well until the Kubernetes cluster size expanded slightly over 1000-1500 nodes - and now everything fails. Kubectl does not work anymore, we can’t make any new changes - what has happened?
Let’s start with what is a change for Kubernetes and what actually happens when an event occurs. Kubectl contacts the kube-apiserver through API port and requests a change. Then the change is saved in a database and used by other APIs like kube-controller-manager or kube-scheduler. This gives us two quick leads - either there is a communication problem or the database does not work.
Let’s quickly check the connection to the API with curl ( curl https://[KUBERNETES_MASTE_HOST]/api/ ) - it works. Well, that was too easy.
Now, let’s check the apiserver logs if there is something strange or alarming. And there is! We have an interesting error message in logs:
etcdserver: mvcc: database space exceeded
Let’s connect to ETCD and see what is the database size now:
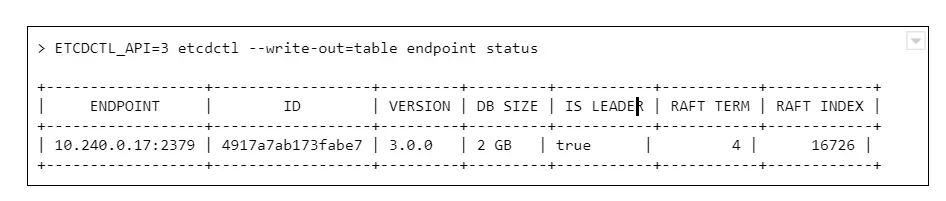
And we see a round number 2GB or 4GB of database size. Why is that a problem? The disks on masters have plenty of free space.
The thing is, it is not caused by resources starvation. The maximum DB size is just a configuration value, namely quota-backend-bytes . The configuration for this was added in 1.12, but it is possible (and for large clusters highly advised) to just use separate etcd cluster to avoid slowdowns. It can be configured by environment variable:
ETCD_QUOTA_BACKEND_BYTES
Etcd itself is a very fragile solution if you think of it for the production environment. Upgrades, rollback procedure, restoring backups - those are things to be carefully considered and verified because not so many people think about it. Also, it requires A LOT of IOPS bandwidth, so optimally, it should be run on fast SSDs.
What are ndots?
Here occurs one of the most common issues which comes to mind when we think about the Kubernetes cluster failing at scale. This is the first issue faced by our team while starting with managing Kubernetes clusters, and it seems to occur after all those years to the new clusters.
Let’s start with defining ndots . And this is not something specific to Kubernetes this time. In fact, it is just a rarely used /etc/resolv.conf configuration parameter, which by default is set to 1 .
Let’s start with the structure of this file, there are only a few options available there:
- nameserver - list of addresses of the DNS server used to resolve the addresses (in the order listed in a file). One address per keyword.
- domain - local domain name.
- sortlist - sort order of addresses returned by gethostbyname() .
- options:
- ndots - maximum number of dots which must appear in hostname given for resolution before initial absolute query should happen. Ndots = 1 means if there is any dot in the name the first try will be absolute name try.
- debug , timeout , attempts … - let’s leave other ones for now
- search - list of domains used for the resolution if the query has less than configure in ndots dots.
So the ndots is a name of configuration parameter which, if set to value bigger than 1 , generates more requests using the list specified in the search parameter. This is still quite cryptic, so let’s look at the example `/etc/resolve.conf` in Kubernetes pod:
nameserver 10.11.12.13
search kube-system.svc.cluster.local svc.cluster.local cluster.local
options ndots:5
With this configuration in place, if we try to resolve address test-app with this configuration, it generates 4 requests:
- test-app.kube-system.svc.cluster.local
- test-app.svc.cluster.local
- test-app.cluster.local
- test-app
If the test-app exists in the namespace, the first one will be successful. If it does not exist at all, it 4th will get out to real DNS.
How can Kubernetes, or actually CoreDNS, know if www.google.com is not inside the cluster and should not go this path?
It does not. It has 2 dots, the ndots = 5, so it will generate:
- www.google.com.kube-system.svc.cluster.local
- www.google.com.svc.cluster.local
- www.google.com.cluster.local
- www.google.com
If we look again in the docs there is a warning next to “search” option, which is easy to miss at first:
Note that this process may be slow and will generate a lot of network traffic if the servers for the listed domains are not local and that queries will time out if no server is available for one of the domains.
Not a big deal then? Not if the cluster is small, but imagine each DNS resolves request between apps in the cluster being sent 4 times for thousands of apps, running simultaneously, and one or two CoreDNS instances.
Two things can go wrong there - either the DNS can saturate the bandwidth and greatly reduce apps accessibility, or the number of requests sent to the resolver can just kill it - the key factor here will be CPU or memory.
What can be done to prevent that?
There are multiple solutions:
1. Use only fully qualified domain names (FQDN). The domain name ending with a dot is called fully qualified and is not affected by search and ndots settings. This might not be easy to change and requires well-built applications, so changing the address does not require a rebuild.
2. Change ndots in the dnsConfig parameter of the pod manifest:
dnsConfig:
options:
- name: ndots
value: "1"
This means the short domain names for pods do not work anymore, but we reduce the traffic. Also can be done for deployments which reach a lot of internet addresses, but not require local connections.
3. Limit the impact. If we deploy kube-dns (CordeDNS) on all nodes as DaemonSet with a fairly big resources pool there will be no outside traffic. This helps a lot with the bandwidth problem but still might need a deeper look into the deployed network overlay to make sure it is enough to solve all problems.
ARP cache
This is one of the nastiest failures, which can result in the full cluster outage when we scale up - even if the cluster is scaled up automatically. It is ARP cache exhaustion and (again) this is something that can be configured in underlying linux.
There are 3 config parameters associated with the number of entries in the ARP table:
- gc_thresh1 - minimal number of entries kept in ARP cache.
- gc_thresh2 - soft max number of entries in ARP cache (default 512).
- gc_thresh3 - hard max number of entries in ARP cache (default 1024).
If the gc_thresh3 limit is exceeded, the next requests result with a neighbor table overflow error in syslog.
This one is easy to fix, just increase the limits until the error goes away, for example in /etc/sysctl.conf file (check the manual for you OS version to make sure what is the exact name of the option):
net.ipv4.neigh.default.gc_thresh1 = 256
net.ipv4.neigh.default.gc_thresh2 = 1024
net.ipv4.neigh.default.gc_thresh3 = 2048
So it’s fixed , by why did it happen in the first place? Each pod in Kubernetes has it’s own IP address (which is at least one ARP entry). Each node takes at least two entries. This means it is really easy for a bigger cluster to exhaust the default limit.
Pulling everything at once
When the operator decides to use a smaller amount of very big workers, for example, to speed up the communication between containers, there is a certain risk involved. There is always a point of time when we have to restart a node - either it is an upgrade or maintenance. Or we don’t restart it, but add a new one with a long queue of containers to be deployed.
In certain cases, especially when there are a lot of containers or just a few very big ones, we might have to download a few dozens of gigabytes, for example, 100GB. There are a lot of moving pieces that affect this scenario - container registry location, size of containers, or several containers which results in a lot of data to be transmitted - but one result: the image pull fails. And the reason is, again, the configuration.
There are two configuration parameters that lead to Kubernetes cluster failures at scale:
- serialize-image-pulls - download the images one by one, without parallelization.
- image-pull-progress-deadline - if images cannot be pulled before the deadline triggers it is canceled.
It might be also required to verify docker configuration on nodes if there is no limit set for parallel pulls. This should fix the issue.
Kubernetes failures at scale - sum up
This is by no means a list of all possible issues which can happen. From our experience, those are the common ones, but as the Kubernetes and software evolve, this can change very quickly. It is highly recommended to learn about Kubernetes cluster failures that happened to others, like Kubernetes failures stories and lessons learned to avoid repeating mistakes that had happened before. And remember to backup your cluster, or even better make sure you have the immutable infrastructure for everything that runs in the cluster and the cluster itself, so only data requires a backup.
5 concourse CI tips: How to speed up your builds and pipeline development
With ever-growing IT projects, automation is nowadays a must-have. From building source code and testing to versioning and deploying, CI/CD tools were always the anonymous team member, who did the job no developer was eager to do. Today, we will take a look at some tips regarding one of the newest tools - Concourse CI. First, we will speed up our Concourse jobs, then we’ll ease the development of the new pipelines for our projects.
Aggregate your steps
By default, Concourse tasks in a job are executed separately. This is perfectly fine for small Concourse jobs that last a minute or two. It also works well at the beginning of the project, as we just want to get the process running. But at some point, it would be nice to optimize our builds.
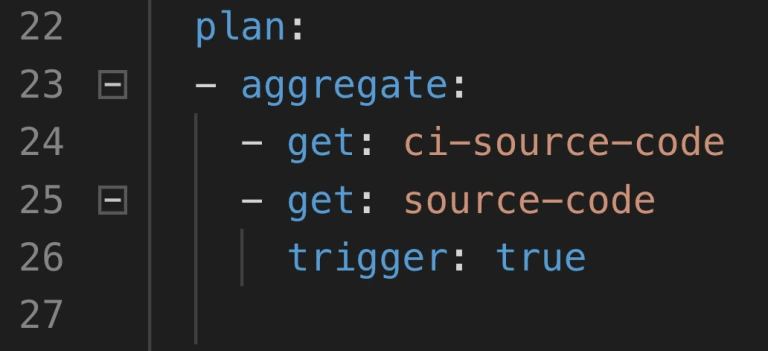
The simplest way to save time is to start using the aggregate keyword. It runs all the steps declared inside of it in parallel. This leads to time-savings in both - script logic execution and in the overhead that occurs when starting the next task.
Neat, so where can we use it? There are 2 main parts of a job where the aggregation is useful:
1. Resource download and upload.
2. Tests execution.
Get and put statements are ideal targets because download and upload of resources are usually completely independent. Integration tests, contract tests, dependency vulnerabilities tests, and alike are also likely candidates if they don’t interfere with one another. Project build tasks? Probably not, because those are usually sequential and we require their output to proceed.
How much time can aggregating save? Of course, it depends. Assuming we can’t aggregate steps that build and test our code, we do get the advantage of simultaneous upload and download of our resources as well as we get less visible step-to-step overhead. We usually save up to two, maybe even three minutes. The largest saving we got was from over half an hour to below ten minutes. Most of the saved time came from running test-related tasks in parallel.
Use docker images with built-in tools
This improvement is trickier to implement but yields a noticeable build time gains. Each task runs in a container, and the image for that container has a certain set of tools available. At some point in the project comes a time where no available image has the tool required. First thing developers do is they download that tool manually or install it using a package manager as a part of the task execution. This means that the tool is fetched every time the task runs. On top of that, the console output is flooded with tool installation logs.
The solution is to prepare a custom container image that already has everything needed for a task to complete. This requires some knowledge not directly related to Concourse, but for example to Docker. With a short dockerfile and a couple of terminal commands, we get an image with the tools we need.
1. Create dockerfile.
2. Inside of the file, install or copy your tools using RUN or COPY commands.
3. Build the image using docker build.
4. Tag and push the image to the registry.
5. Change image_resource part in your Concourse task to use the new image.
That’s it, no more waiting for tools to install each time! We could even create a pipeline to build and push the image for us.
Create pipelines from a template
Moving from time-saving measures to developer convenience tips, here’s one for bigger projects. Those usually have a certain set of similar build pipelines with the only differences being credentials, service names, etc. - parameters that are not hardcoded in the pipeline script and are injected at execution time from a source like CredHub. This is typical for Cloud Foundry and Kubernetes web projects with microservices. With a little bit of creativity, we could get a bash or python script to generate those pipelines from a single template file.
First, we need to have a template file. Take one of your existing pipeline specifications and substitute parameter names with their pipeline agnostic version. Our script needs to loop over a pipeline names list, substitute generic parameter names with proper pipeline related ones that are available in Credhub and then set the pipeline in Concourse with the fly CLI.
The second part of the equation here is a Concourse job that watches for changes in the template file in a Git repository and starts the pipeline generation script. With this solution, we have to change only one file to get all pipelines updated, and on top of that, a commit to pipeline repository is sufficient to trigger the update.
Log into a task container to debug issues
When debugging Concourse task failures, the main source of information on failure is the console. A quick glance at the output is enough to solve most of the problems. Other issues may require a quick peek into the environment of an unsuccessful task. We can do that with fly intercept command.
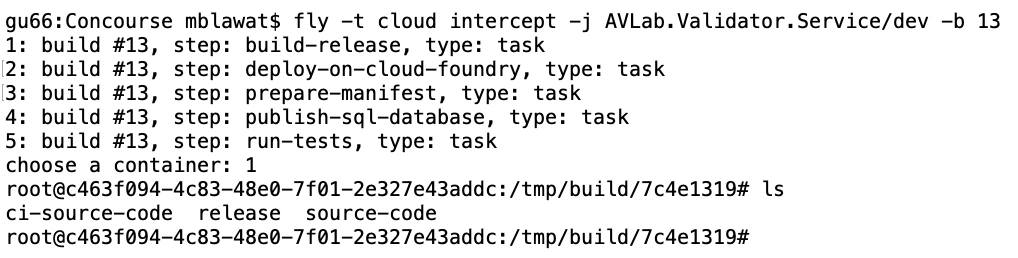
Fly intercept allows us to log into a container that executed a specific task in a specific job run. Inside we can see the state of the container when task finished and can try to find the root of failure. There may be an empty environment variable - we forgot to set the proper param in a yml file. The resource has a different structure inside of it - we need to change the task script or the resource structure. When the work is done, don’t forget to log out of the container. Oh, and don’t wait too long! Those containers can be disposed of by Concourse at any time.
Use Visual Studio Code Concourse add-on
The last thing I want to talk about is the Concourse CI Pipeline Editor for Visual Studio Code. It’s a plugin that offers suggestions, documentation popups, and error checking for Concourse yml files. If you use the pipeline template and generation task from the previous tip, then any syntax error in your template will be discovered as late as the update task updating the pipelines from the template. That’s because you won’t run fly set-pipeline yourself. Fixing such issue requires a new commit in the pipeline repository.
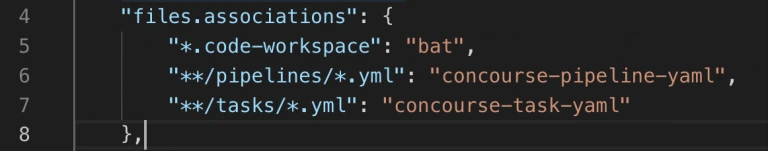
With the plugin, any unused resource or a typo in property name will be detected immediately. Add-on will also help you write new pieces of automation code by suggesting keywords and showing available values for Concourse commands. The only action required is to update the files.associations section in the settings. We use separate directories for pipelines and tasks, so we have set it up as follows:
Conclusion
And that’s it! We hope you have found at least one tip useful and will use it in your project. Aggregate is an easy one to implement, and it’s good to have a habit of aggregating steps from the start. Custom images and pipeline templates are beneficial in bigger projects where they help keep CI less clunky. Finally, fly intercept and the VSC add-on are just extra tools to save time during the pipeline development.
Interested in our services?
Reach out for tailored solutions and expert guidance.