8 tips for an agile debugging of a web application

Building a complex web application, you've probably encountered the fact that something didn’t work as planned. You’ve spent hours and hours looking for a bug in your code and then on the internet searching for help with fixing the problem. To make it easier for you, in this article we explain some effective techniques of debugging a web application that significantly reduce the pain of debugging and shorten the time of detecting issues.
Console.log
First, a commonly used javascript method console.log. You can insert a method in your code with the given variable. During code execution, the application will return the value of the variables specified inside the method in the console. This is the easiest way to check if the program returns the expected value.
Unfortunately, this is not a very effective method of debugging. Such an approach t does not allow us to see the progress of code execution (unless we insert console.log every few lines, but then the amount of data thrown in the console will be unreadable and we will only make a mess in the code.) Furthermore, it returns only the passed variable, provided that the application does not throw an error while executing the code.
Tip no. 1
If you have many console.logs put the name in a string and the next variable, e.g., console.log(‘variable’, variable).
Chrome DevTools (Source Tab)
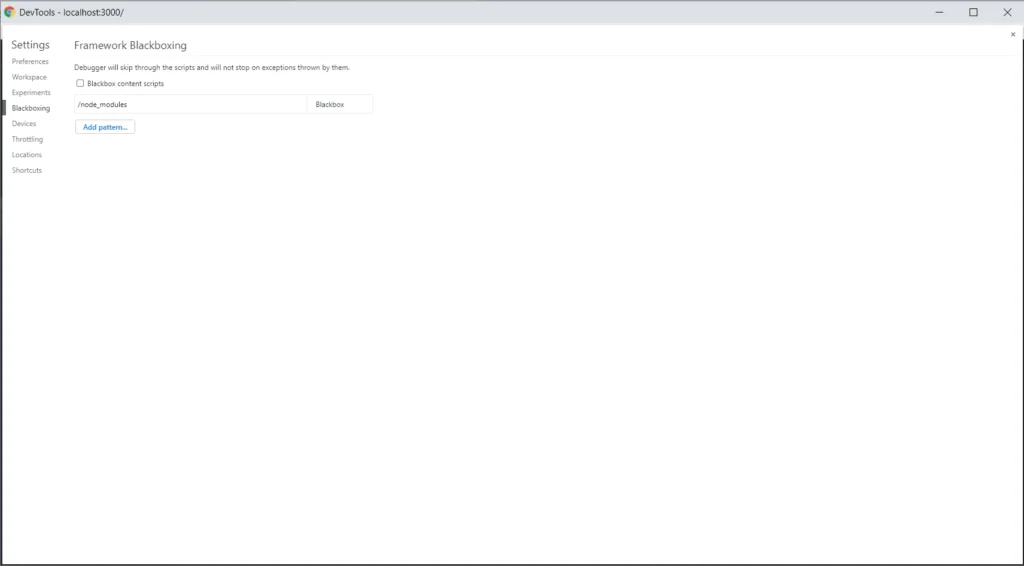
A more efficient method for debugging a web application is to use Chrome DevTools and Source Tab. Before we start debugging in the source tab, we need to add node_modules to black boxing. We add this rule so that when going through breakpoints it does not show us files from external packages, which makes debugging difficult. We need to open settings in Chrome → Blackboxing → Add patterns and then write there /node_modules .
When you add node_modules to black boxing we can go to the Source Tab. Let’s assume you want to follow in real time the process of your function, and check the outputs. Press Ctrl + O in the source tab, and enter a source file name. Then put the breakpoints on the lines of code that interest, you and you can start executing the process in your browser. When the lines you selected start processing, the browser will stop executing the code. See the screenshot below.
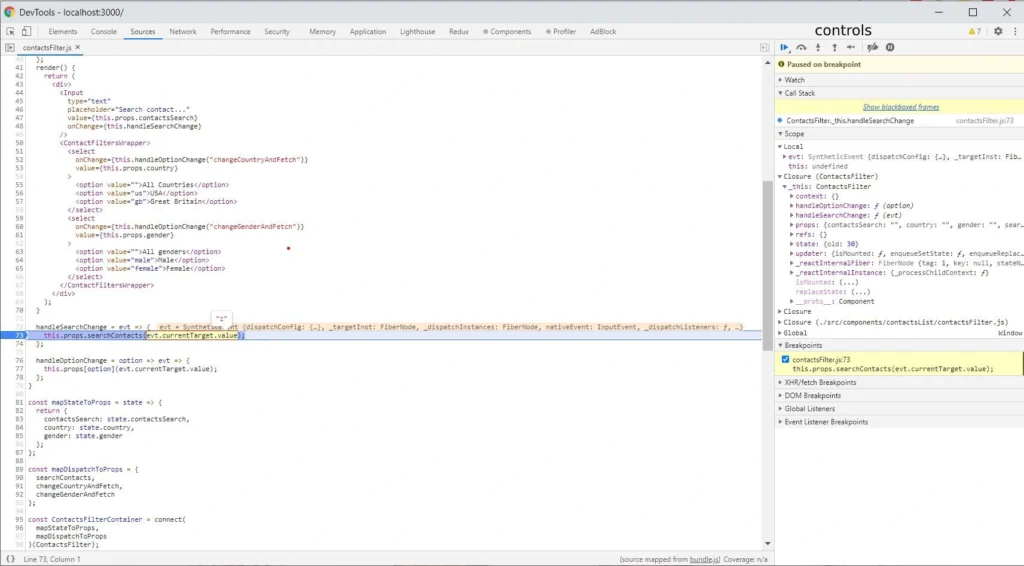
As you can see, the current line of code where the browser has stopped has a blue background. On the right side, there is a bar where our command center is located. Here is our brief introduction.
Controls
At the top of the bar, you have the controls section. Let's focus on the crucial elements. The first Resume control takes us to the next marked breakpoint within the scope of the code being executed. The second control Step over next function call takes us to the next line of the code being executed. The last Deactive breakpoints control deactivates the selected breakpoints. It’s a useful control when we have many breakpoints selected, and we want to go back to clicking through the application for a while without pausing at every breakpoint.
Scopes
We have a scopes section below. We have several types of scopes: local (the currently performed function), and closures depending on the scope in which we are (for example, the parent of the currently performed function or a component). In each of these scopes, the browser shows us all variables occurring in them.
Breakpoints
The last section discussed is breakpoints. It shows what breakpoints and in what files are marked. Using checkboxes, we can easily deactivate and reactivate them.
Tips no. 2-5
- If you use immutable.js in your project, install the Immutable.js Object Formatter plugin and activate it in browser settings. This will significantly simplify the debugging of immutable objects.
- If you do not use immutable.js in your project and you use Visual Studio Code as IDE, We strongly recommend installing and configuring Debugger for Chrome (VSC does not have an immutable.js formatting plugin). It simplifies debugging even further and allows for faster code changes.
- If the source tab doesn’t show your local files check the source map in your project.
- When the browser stops on a breakpoint you have access to variables also in the console.
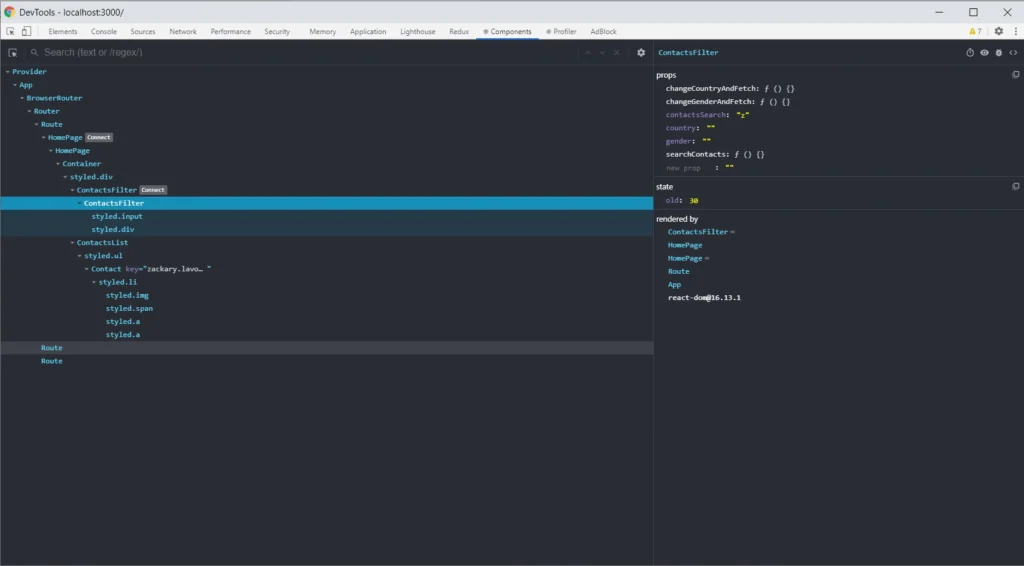
React Developer Tools
React Developer Tools are also helpful solutions. Such tools allow you to easily view the React tree structure in your project, the states, and props in the component. The Select an element in the page to inspect it function is powerful, especially when you don't know the whole project. It helps you find the component you need to update.
Tip no. 6
If you use Vue.js, you can use Vue.js devtools. The extension has similar functions and access to Vuex (the redux equivalent in react).
Redux DevTools
If you use Redux in your project, Redux DevTools is a must-have. Such a solution allows you to track the full flow of actions, status changes, payload, and view the current store after each action performed. If something does not work as we assume, and everything seems fine in the code, it is worth considering what actions are dispatching, with what payload. Sometimes there are simple mistakes like copying the constant from the above action, renaming without changing the value, and then calling something completely different. Below is a gif showing the most important Redux DevTools functions.
Tip no. 7
If your application runs a large number of actions, the extension may not function properly due to insufficient memory to process that many actions. You can try to configure it in the extension options (in this case, the maxAge option.)
Fiddler
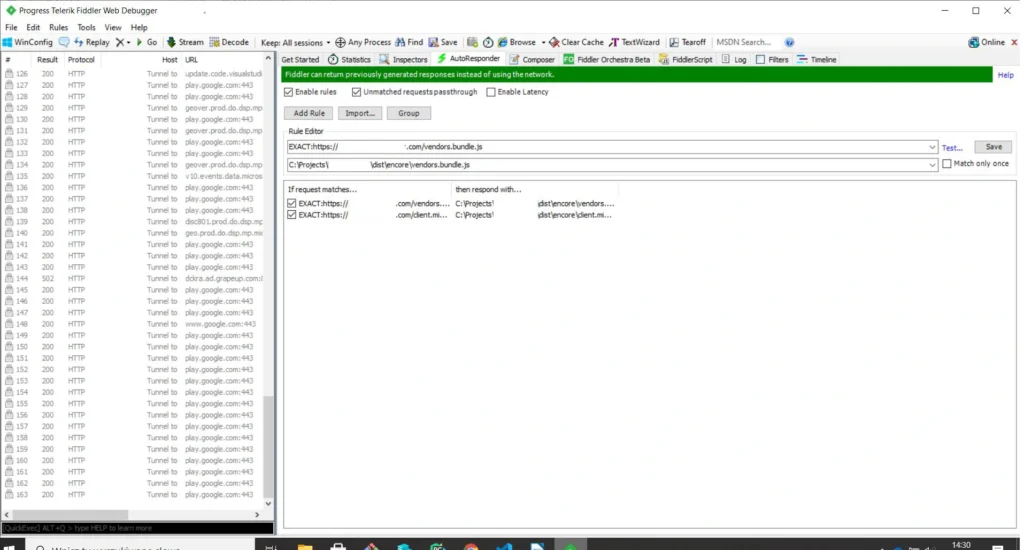
The last tool we would like to introduce is Fiddler . The tool was created to manage network traffic. It is extremely useful when we have some production bugs and we cannot copy the production data to a lower environment to debug locally. In such a situation, to have access to production data in the local environment, we set the traffic in the AutoResponder tab. When you open the page, instead of downloading the js file from the server, Fidler connects our locally built production file. Further debugging is done in the chrome dev tools source tab. Below is a screenshot with the setting to redirect traffic to the local file. The program also allows for mock endpoints.
Tip no. 8
If you want to create mocks of endpoints in an easy and fast way, you can use a mock moon program.
Summary of an agile debugging of a web application
For many of us, the process of debugging a web application is associated with a headache and long hours spent in front of the computer. However, this process can be shortened and made more pleasant if you have the right tools and know-how to use them. Often they are at your fingertips and for free. We shared with you the most important and useful tools that we use daily .

Grape Up guides enterprises on their data-driven transformation journey
Ready to ship? Let's talk.
Check related articles
Read our blog and stay informed about the industry's latest trends and solutions.
Practical tips to testing React apps with Selenium
If you ever had to write some automation scripts for an app with the frontend part done in React and you used Selenium Webdriver to get it to work, you’ve probably noticed that those two do not always get along very well. Perhaps you had to ‘hack’ your way through the task, and you were desperately searching for solutions to help you finish the job. I’ve been there and done that – so now you don’t have to. If you’re looking for a bunch of tricks which you can learn and expand your automation testing skillset, you’ve definitely come to the right place. Below I’ll share with you several solutions to problems I’ve encountered in my experience with testing against React with Selenium . Code examples will be presented for Python binding.
They see me scrolling
First, let’s take a look at scrolling pages. To do that, the solution that often comes to mind in automation testing is using JavaScript. Since we’re using Python here, the first search result would probably suggest using something like this:
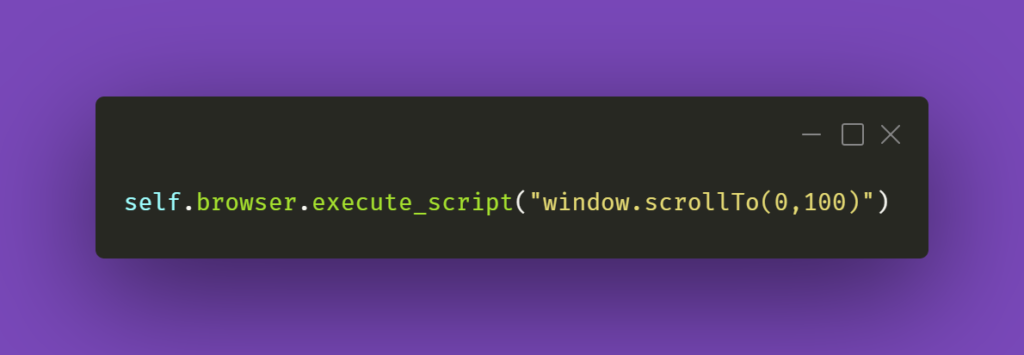
The first argument in the JS part is the number of pixels horizontally, and the second one is the number of pixels vertically. If we just paste window.scrollTo(0,100) into browsers’ console with some webpage opened, the result of the action will be scrolling the view vertically to the pixel position provided.
You could also try the below line of code:
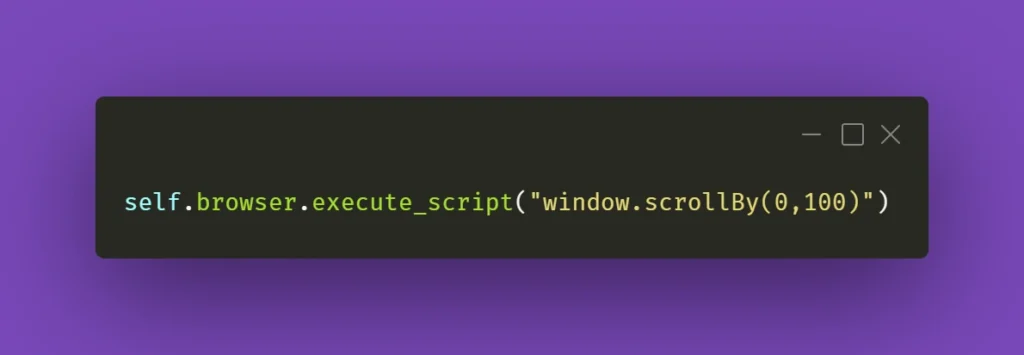
And again, you can see how it works by pasting window.scrollBy(0,100) into browsers’ console – the page will scroll down by the number of pixels provided. If you do this repeatedly, you’ll eventually reach the bottom of the page.
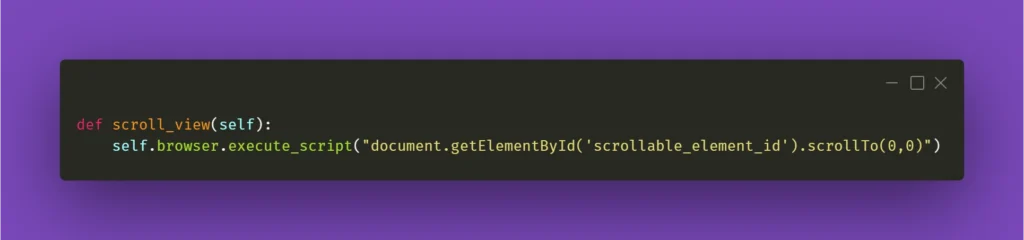
However, that might not always work wonders for you. Perhaps you do not want to scroll the whole page, but just a part of it – the scrollbars might be confusing, and when you think it’s the whole page you need to scroll, it might be just a portion of it. In that case, here’s what you need to do. First, locate the React element you want to scroll. Then, make sure it has an ID assigned to it. If not, do it yourself or ask your friendly neighborhood developer to do it for you. Then, all you have to do is write the following line of code:
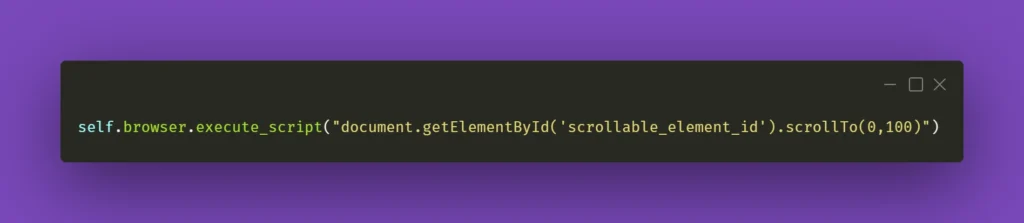
Obviously, don’t forget to change ‘scrollable_element_id’ to an ID of your element. That will perform a scroll action within the selected element to the position provided in arguments. Or, if needed, you can try .scrollBy instead of .scrollTo to get a consistent, repeatable scrolling action.
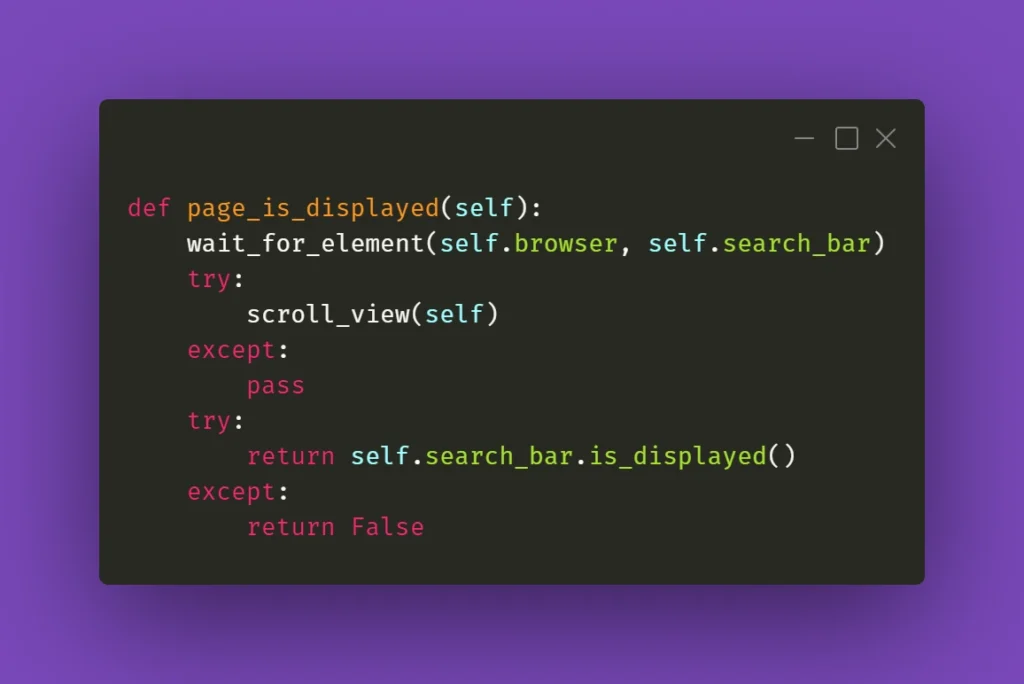
To finish off, you could also make a helper method out of it and call it whenever you need it:
I’ll be mentioning the above method in the following paragraph, so please keep in mind what scroll_view is about.
Still haven’t found what you were looking for
Now that you have moved scrolling problems out of the way, locating elements and interacting with them on massive React pages should not bother you anymore, right? Well, not exactly. If you need to perform some action on an element that exists within a page, it has to be scrolled into view so you can work with it. And Selenium does not automatically do that. Let’s assume that you’re working on a web app that has various sub-pages, or tabs. Each of those tabs contains elements of a different sort but arranged in similar tables with search bars on top of each table at the beginning of the tab. Imagine the following scenario: you navigate to the first tab, scroll the view down, then navigate to the second tab, and you want to use the search bar at the top of the page. Sounds easy, doesn’t it?
What you need to be aware of is the React’s feature which does not always move the view to the top of the page after switching subpages of the app. In this case, to interact with the aforementioned search box you need to scroll the view to the starting position. That’s why scroll_view method in previous paragraph took (0,0) as .scrollTo arguments. You could use it before interacting with an element just to make sure it’s in the view and can be found by Selenium. Here’s an example:
When it doesn’t click
Seems like a basic action like clicking on an element should be bulletproof and never fail. Yet again, miracles happen and if you’re losing your mind trying to find out what’s going on, remember that Selenium doesn’t always work great with React. If you have to deal with some stubborn element, such as a checkbox, for example, you could just simply make the code attempt the action several times:
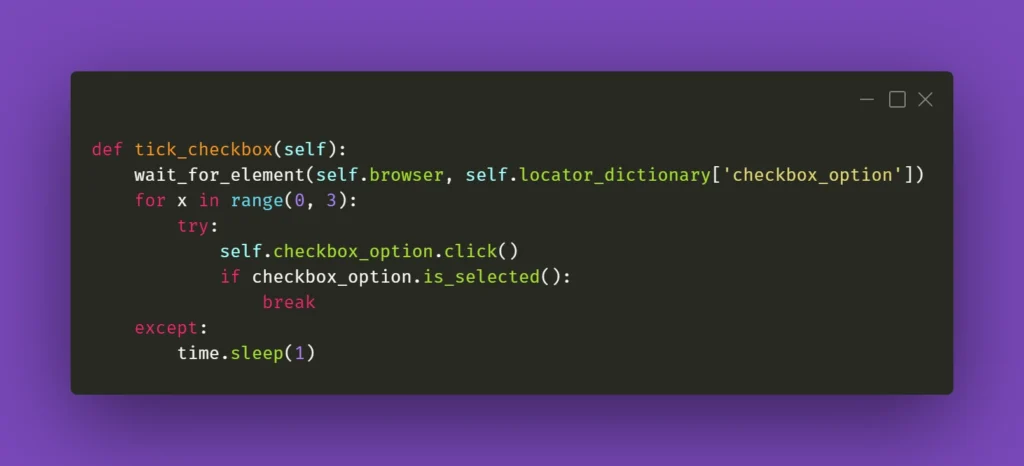
The key here is the if statement; it has to verify whether the requested action had actually taken place. In the above case, a checkbox is selected, and Selenium has a method for verifying that. In other situations, you could just provide a specific selector which applies to a particular element when it changes its state, eg., an Xpath similar to this:
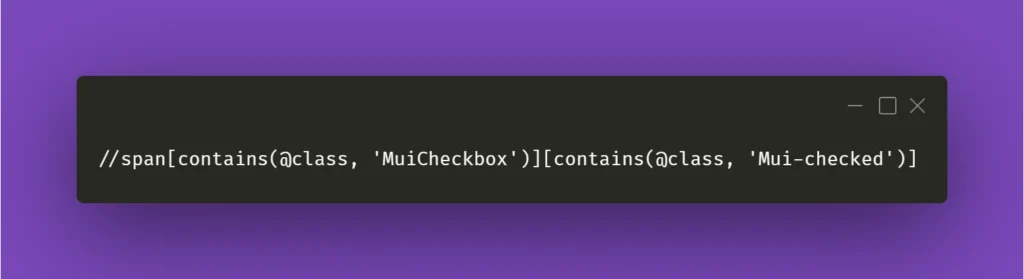
In the above example, Xpath contains generic Material-UI classes, but it could be anything as long as it points out the exact element you needed when it changed its state to whichever you wanted.
Clear situation
Testing often includes dealing with various forms that we need to fill and verify. Fortunately, Selenium’s send_keys() method usually does the job. But when it doesn’t, you could try clicking the text field before inputting the value:
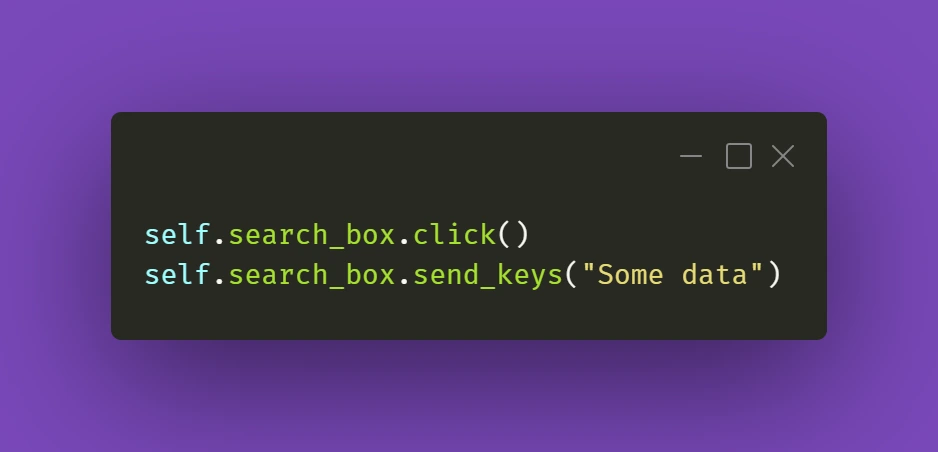
It's a simple thing to do, but we might sometimes have the tendency to forget about such trivial solutions. Anyway, it gets the job done.
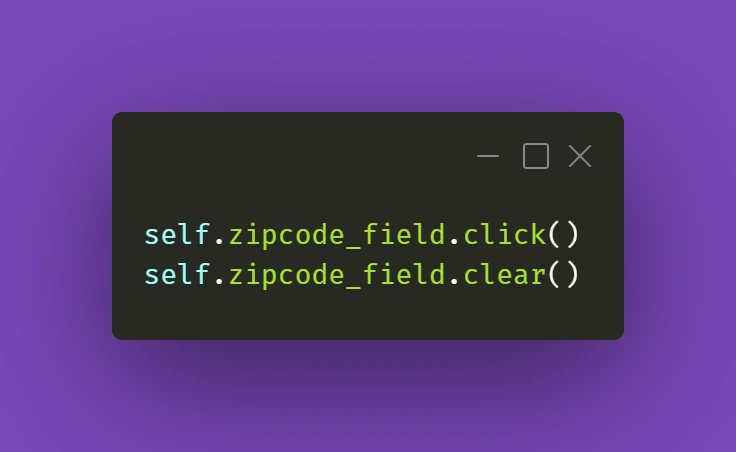
The trickier part might actually be getting rid of data in already filled out forms. And Selenium's .clear() method doesn't cooperate as you would expect it to do. If getting the field into focus just like in the above example doesn't work out for you:
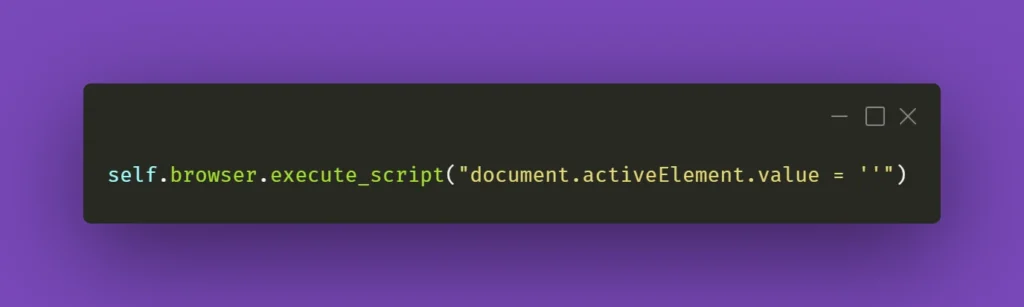
there is a solution that uses some JavaScript (again!). Just make sure your cursor is focused on the field you want to clear and use the following line:
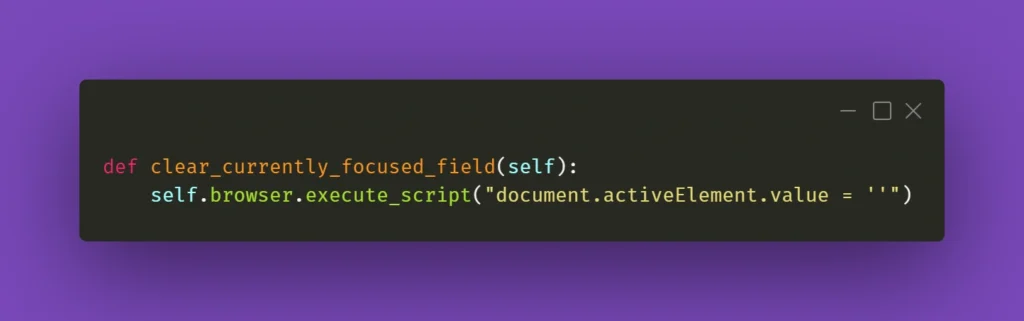
You can also wrap it into a nifty little helper as I did:
While this should work fine 99% of the time, there might be a situation with a stubborn text field where React quickly restores the previous value. What you can do in such a situation is experiment with sending an empty string to that field right after clearing it or sending some whitespace to it:
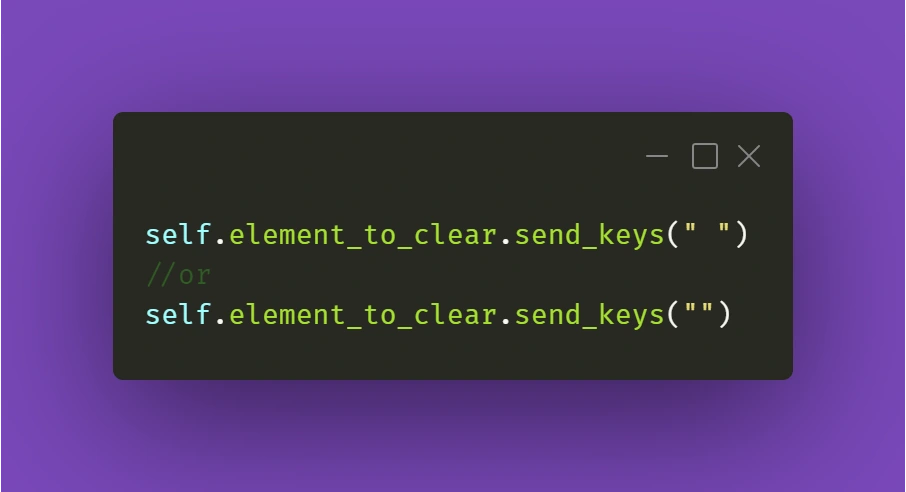
Just make sure it works for you!
Continuing the topic of the text in various fields, which sometimes have to be verified or checked after particular conditions are met, sometimes you need to make sure you're using the right method to extract the text value of an element. They might come in different forms, but the ones below are used quite often. Text in element could be extracted by Selenium with .get_attribute() method:
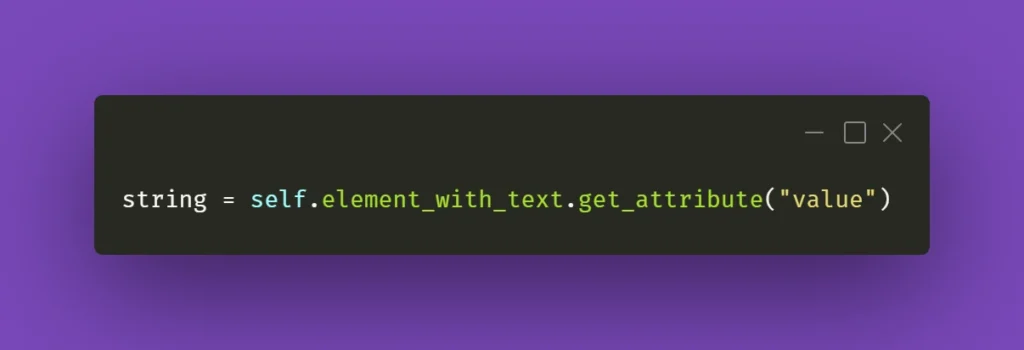
Or sometimes it's just enough to use .text() method:
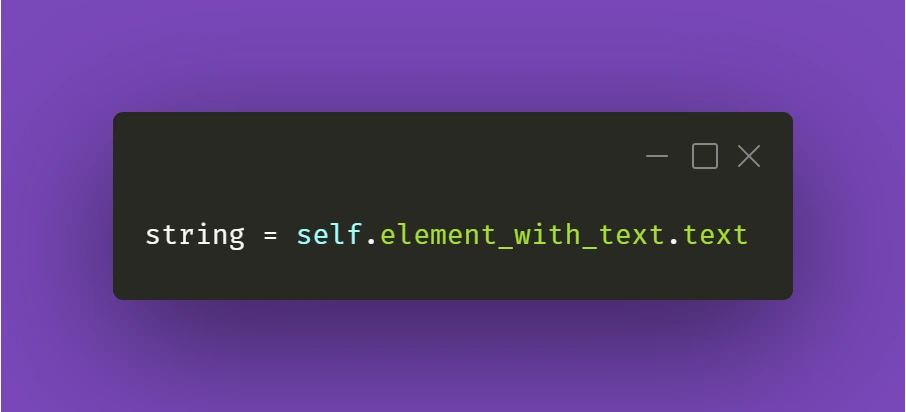
It all depends on the context and the element you're working with. So don't fall into the trap of assuming that all forms and elements in the app are exactly the same. Always check twice, you'll thank yourself for that, and in the end, you'll save tons of time!
React Apps - Keep on testing!
Hopefully, the tips and tricks I presented above will prove most useful for you in your testing projects. There's definitely more to share within the testing field, so make sure you stay tuned in for other articles on our blog!
How to run Selenium BDD tests in parallel with AWS Lambda
Have you ever felt annoyed because of the long waiting time for receiving test results? Maybe after a few hours, you’ve figured out that there had been a network connection issue in the middle of testing, and half of the results can go to the trash? That may happen when your tests are dependent on each other or when you have plenty of them and execution lasts forever. It's quite a common issue. But there’s actually a solution that can not only save your time but also your money - parallelization in the Cloud.
How it started
Developing UI tests for a few months, starting from scratch, and maintaining existing tests, I found out that it has become something huge that will be difficult to take care of very soon. An increasing number of test scenarios made every day led to bottlenecks. One day when I got to the office, it turned out that the nightly tests were not over yet. Since then, I have tried to find a way to avoid such situations.
A breakthrough was the presentation of Tomasz Konieczny during the Testwarez conference in 2019. He proved that it’s possible to run Selenium tests in parallel using AWS Lambda. There’s actually one blog that helped me with basic Selenium and Headless Chrome configuration on AWS. The Headless Chrome is a light-weighted browser that has no user interface. I went a step forward and created a solution that allows designing tests in the Behavior-Driven Development process and using the Page Object Model pattern approach, run them in parallel, and finally - build a summary report.
Setting up the project
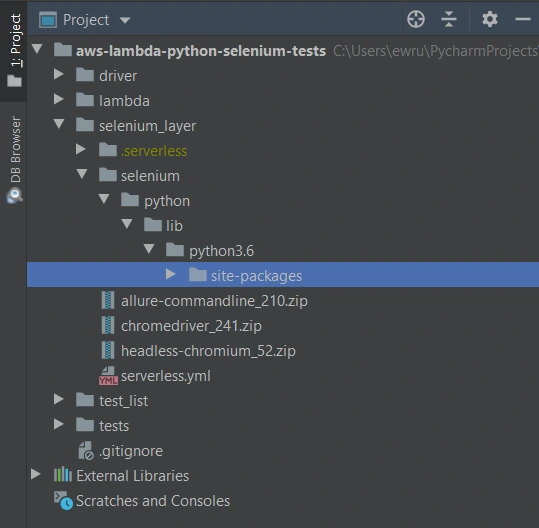
The first thing we need to do is signing up for Amazon Web Services. Once we have an account and set proper values in credentials and config files (.aws directory), we can create a new project in PyCharm, Visual Studio Code, or in any other IDE supporting Python. We’ll need at least four directories here. We called them ‘lambda’, ‘selenium_layer’, ‘test_list’, ‘tests’ and there’s also one additional - ‘driver’, where we keep a chromedriver file, which is used when running tests locally in a sequential way.
In the beginning, we’re going to install the required libraries. Those versions work fine on AWS, but you can check newer if you want.
requirements.txt
allure_behave==2.8.6
behave==1.2.6
boto3==1.10.23
botocore==1.13.23
selenium==2.37.0
What’s important, we should install them in the proper directory - ‘site-packages’.
We’ll need also some additional packages:
Allure Commandline ( download )
Chromedriver ( download )
Headless Chromium ( download )
All those things will be deployed to AWS using Serverless Framework, which you need to install following the docs . The Serverless Framework was designed to provision the AWS Lambda Functions, Events, and infrastructure Resources safely and quickly. It translates all syntax in serverless.yml to a single AWS CloudFormation template which is used for deployments.
Architecture - Lambda Layers
Now we can create a serverless.yml file in the ‘selenium-layer’ directory and define Lambda Layers we want to create. Make sure that your .zip files have the same names as in this file. Here we can also set the AWS region in which we want to create our Lambda functions and layers.
serverless.yml
service: lambda-selenium-layer
provider:
name: aws
runtime: python3.6
region: eu-central-1
timeout: 30
layers:
selenium:
path: selenium
CompatibleRuntimes: [
"python3.6"
]
chromedriver:
package:
artifact: chromedriver_241.zip
chrome:
package:
artifact: headless-chromium_52.zip
allure:
package:
artifact: allure-commandline_210.zip
resources:
Outputs:
SeleniumLayerExport:
Value:
Ref: SeleniumLambdaLayer
Export:
Name: SeleniumLambdaLayer
ChromedriverLayerExport:
Value:
Ref: ChromedriverLambdaLayer
Export:
Name: ChromedriverLambdaLayer
ChromeLayerExport:
Value:
Ref: ChromeLambdaLayer
Export:
Name: ChromeLambdaLayer
AllureLayerExport:
Value:
Ref: AllureLambdaLayer
Export:
Name: AllureLambdaLayer
Within this file, we’re going to deploy a service consisting of four layers. Each of them plays an important role in the whole testing process.
Creating test set
What would the tests be without the scenarios? Our main assumption is to create test files running independently. This means we can run any test without others and it works. If you're following clean code, you'll probably like using the Gherkin syntax and the POM approach. Behave Framework supports both.
What gives us Gherkin? For sure, better readability and understanding. Even if you haven't had the opportunity to write tests before, you will understand the purpose of this scenario.
01.OpenLoginPage.feature
@smoke
@login
Feature: Login to service
Scenario: Login
Given Home page is opened
And User opens Login page
When User enters credentials
And User clicks Login button
Then User account page is opened
Scenario: Logout
When User clicks Logout button
Then Home page is opened
And User is not authenticated
In the beginning, we have two tags. We add them in order to run only chosen tests in different situations. For example, you can name a tag @smoke and run it as a smoke test, so that you can test very fundamental app functions. You may want to test only a part of the system like end-to-end order placing in the online store - just add the same tag for several tests.
Then we have the feature name and two scenarios. Those are quite obvious, but sometimes it’s good to name them with more details. Following steps starting with Given, When, Then and And can be reused many times. That’s the Behavior-Driven Development in practice. We’ll come back to this topic later.
Meantime, let’s check the proper configuration of the Behave project.
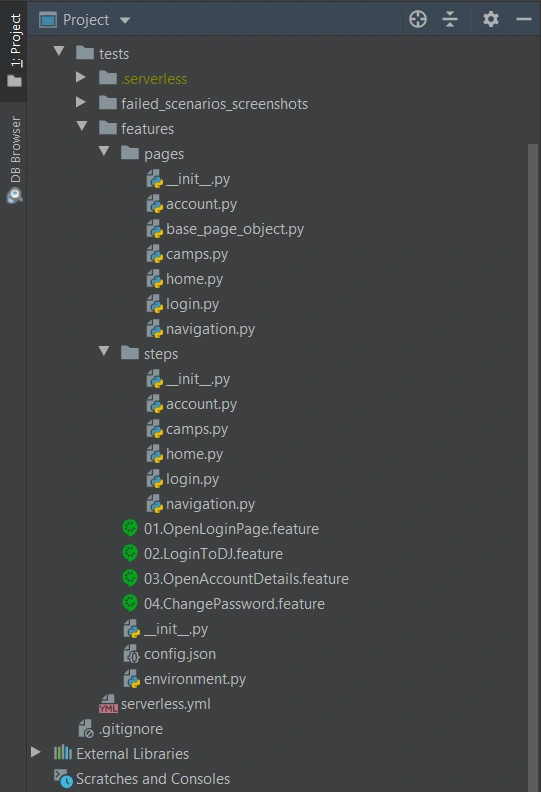
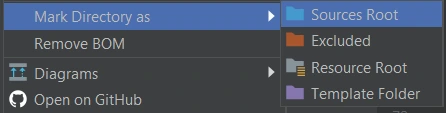
We definitely need a ‘feature’ directory with ‘pages’ and ‘steps’. Make the ‘feature’ folder as Sources Root. Just right-click on it and select the proper option. This is the place for our test scenario files with .feature extension.
It’s good to have some constant values in a separate file so that it will change only here when needed. Let’s call it config.json and put the URL of the tested web application.
config.json
{
"url": "http://drabinajakuba.atthost24.pl/"
}
One more thing we need is a file where we set webdriver options.
Those are required imports and some global values like, e.g. a name of AWS S3 bucket in which we want to have screenshots or local directory to store them in. As far as we know, bucket names should be unique in whole AWS S3, so you should probably change them but keep the meaning.
environment.py
import os
import platform
from datetime import date, datetime
import json
import boto3
from selenium import webdriver
from selenium.webdriver.chrome.options import Options
REPORTS_BUCKET = 'aws-selenium-test-reports'
SCREENSHOTS_FOLDER = 'failed_scenarios_screenshots/'
CURRENT_DATE = str(date.today())
DATETIME_FORMAT = '%H_%M_%S'
Then we have a function for getting given value from our config.json file. The path of this file depends on the system platform - Windows or Darwin (Mac) would be local, Linux in this case is in AWS. If you need to run these tests locally on Linux, you should probably add some environment variables and check them here.
def get_from_config(what):
if 'Linux' in platform.system():
with open('/opt/config.json') as json_file:
data = json.load(json_file)
return data[what]
elif 'Darwin' in platform.system():
with open(os.getcwd() + '/features/config.json') as json_file:
data = json.load(json_file)
return data[what]
else:
with open(os.getcwd() + '\\features\\config.json') as json_file:
data = json.load(json_file)
return data[what]
Now we can finally specify paths to chromedriver and set browser options which also depend on the system platform. There’re a few more options required on AWS.
def set_linux_driver(context):
"""
Run on AWS
"""
print("Running on AWS (Linux)")
options = Options()
options.binary_location = '/opt/headless-chromium'
options.add_argument('--allow-running-insecure-content')
options.add_argument('--ignore-certificate-errors')
options.add_argument('--disable-gpu')
options.add_argument('--headless')
options.add_argument('--window-size=1280,1000')
options.add_argument('--single-process')
options.add_argument('--no-sandbox')
options.add_argument('--disable-dev-shm-usage')
capabilities = webdriver.DesiredCapabilities().CHROME
capabilities['acceptSslCerts'] = True
capabilities['acceptInsecureCerts'] = True
context.browser = webdriver.Chrome(
'/opt/chromedriver', chrome_options=options, desired_capabilities=capabilities
)
def set_windows_driver(context):
"""
Run locally on Windows
"""
print('Running on Windows')
options = Options()
options.add_argument('--no-sandbox')
options.add_argument('--window-size=1280,1000')
options.add_argument('--headless')
context.browser = webdriver.Chrome(
os.path.dirname(os.getcwd()) + '\\driver\\chromedriver.exe', chrome_options=options
)
def set_mac_driver(context):
"""
Run locally on Mac
"""
print("Running on Mac")
options = Options()
options.add_argument('--no-sandbox')
options.add_argument('--window-size=1280,1000')
options.add_argument('--headless')
context.browser = webdriver.Chrome(
os.path.dirname(os.getcwd()) + '/driver/chromedriver', chrome_options=options
)
def set_driver(context):
if 'Linux' in platform.system():
set_linux_driver(context)
elif 'Darwin' in platform.system():
set_mac_driver(context)
else:
set_windows_driver(context)
Webdriver needs to be set before all tests, and in the end, our browser should be closed.
def before_all(context):
set_driver(context)
def after_all(context):
context.browser.quit()
Last but not least, taking screenshots of test failure. Local storage differs from the AWS bucket, so this needs to be set correctly.
def after_scenario(context, scenario):
if scenario.status == 'failed':
print('Scenario failed!')
current_time = datetime.now().strftime(DATETIME_FORMAT)
file_name = f'{scenario.name.replace(" ", "_")}-{current_time}.png'
if 'Linux' in platform.system():
context.browser.save_screenshot(f'/tmp/{file_name}')
boto3.resource('s3').Bucket(REPORTS_BUCKET).upload_file(
f'/tmp/{file_name}', f'{SCREENSHOTS_FOLDER}{CURRENT_DATE}/{file_name}'
)
else:
if not os.path.exists(SCREENSHOTS_FOLDER):
os.makedirs(SCREENSHOTS_FOLDER)
context.browser.save_screenshot(f'{SCREENSHOTS_FOLDER}/{file_name}')
Once we have almost everything set, let’s dive into single test creation. Page Object Model pattern is about what exactly hides behind Gherkin’s steps. In this approach, we treat each application view as a separate page and define its elements we want to test. First, we need a base page implementation. Those methods will be inherited by all specific pages. You should put this file in the ‘pages’ directory.
base_page_object.py
from selenium.webdriver.common.action_chains import ActionChains
from selenium.webdriver.support.ui import WebDriverWait
from selenium.webdriver.support import expected_conditions as EC
from selenium.common.exceptions import *
import traceback
import time
from environment import get_from_config
class BasePage(object):
def __init__(self, browser, base_url=get_from_config('url')):
self.base_url = base_url
self.browser = browser
self.timeout = 10
def find_element(self, *loc):
try:
WebDriverWait(self.browser, self.timeout).until(EC.presence_of_element_located(loc))
except Exception as e:
print("Element not found", e)
return self.browser.find_element(*loc)
def find_elements(self, *loc):
try:
WebDriverWait(self.browser, self.timeout).until(EC.presence_of_element_located(loc))
except Exception as e:
print("Element not found", e)
return self.browser.find_elements(*loc)
def visit(self, url):
self.browser.get(url)
def hover(self, element):
ActionChains(self.browser).move_to_element(element).perform()
time.sleep(5)
def __getattr__(self, what):
try:
if what in self.locator_dictionary.keys():
try:
WebDriverWait(self.browser, self.timeout).until(
EC.presence_of_element_located(self.locator_dictionary[what])
)
except(TimeoutException, StaleElementReferenceException):
traceback.print_exc()
return self.find_element(*self.locator_dictionary[what])
except AttributeError:
super(BasePage, self).__getattribute__("method_missing")(what)
def method_missing(self, what):
print("No %s here!", what)
That’s a simple login page class. There’re some web elements defined in locator_dictionary and methods using those elements to e.g., enter text in the input, click a button, or read current values. Put this file in the ‘pages’ directory.
login.py
from selenium.webdriver.common.by import By
from .base_page_object import *
class LoginPage(BasePage):
def __init__(self, context):
BasePage.__init__(
self,
context.browser,
base_url=get_from_config('url'))
locator_dictionary = {
'username_input': (By.XPATH, '//input[@name="username"]'),
'password_input': (By.XPATH, '//input[@name="password"]'),
'login_button': (By.ID, 'login_btn'),
}
def enter_username(self, username):
self.username_input.send_keys(username)
def enter_password(self, password):
self.password_input.send_keys(password)
def click_login_button(self):
self.login_button.click()
What we need now is a glue that will connect page methods with Gherkin steps. In each step, we use a particular page that handles the functionality we want to simulate. Put this file in the ‘steps’ directory.
login.py
from behave import step
from environment import get_from_config
from pages import LoginPage, HomePage, NavigationPage
@step('User enters credentials')
def step_impl(context):
page = LoginPage(context)
page.enter_username('test_user')
page.enter_password('test_password')
@step('User clicks Login button')
def step_impl(context):
page = LoginPage(context)
page.click_login_button()
It seems that we have all we need to run tests locally. Of course, not every step implementation was shown above, but it should be easy to add missing ones.
If you want to read more about BDD and POM, take a look at Adrian’s article
All files in the ‘features’ directory will also be on a separate Lambda Layer. You can create a serverless.yml file with the content presented below.
serverless.yml
service: lambda-tests-layer
provider:
name: aws
runtime: python3.6
region: eu-central-1
timeout: 30
layers:
features:
path: features
CompatibleRuntimes: [
"python3.6"
]
resources:
Outputs:
FeaturesLayerExport:
Value:
Ref: FeaturesLambdaLayer
Export:
Name: FeaturesLambdaLayer
This is the first part of the series covering running Parallel Selenium tests on AWS Lambda. More here !
How to run Selenium BDD tests in parallel with AWS Lambda - Lambda handlers
In our first article about Selenium BDD Tests in Parallel with AWS Lambda, we introduce parallelization in the Cloud and give you some insights into automating testing to accelerate your software development process. By getting familiar with the basics of Lambda Layers architecture and designing test sets, you are now ready to learn more about the Lambda handlers.
Lambda handlers
Now’s the time to run our tests on AWS. We need to create two Lambda handlers. The first one will find all scenarios from the test layer and run the second lambda in parallel for each scenario. In the end, it will generate one test report and upload it to the AWS S3 bucket.
Let’s start with the middle part. In order to connect to AWS, we need to use the boto3 library - AWS SDK for Python. It enables us to create, configure, and manage AWS services. We also import here behave __main__ function , which will be called to run behave tests from the code, not from the command line.
lambda/handler.py
import json
import logging
import os
from datetime import datetime
from subprocess import call
import boto3
from behave.__main__ import main as behave_main
REPORTS_BUCKET = 'aws-selenium-test-reports'
DATETIME_FORMAT = '%H:%M:%S'
logger = logging.getLogger()
logger.setLevel(logging.INFO)
def get_run_args(event, results_location):
test_location = f'/opt/{event["tc_name"]}'
run_args = [test_location]
if 'tags' in event.keys():
tags = event['tags'].split(' ')
for tag in tags:
run_args.append(f'-t {tag}')
run_args.append('-k')
run_args.append('-f allure_behave.formatter:AllureFormatter')
run_args.append('-o')
run_args.append(results_location)
run_args.append('-v')
run_args.append('--no-capture')
run_args.append('--logging-level')
run_args.append('DEBUG')
return run_args
What we also have above is setting arguments for our tests e.g., tags or feature file locations. But let's get to the point. Here is our Lambda handler code:
lambda/handler.py
def lambda_runner(event, context):
suffix = datetime.now().strftime(DATETIME_FORMAT)
results_location = f'/tmp/result_{suffix}'
run_args = get_run_args(event, results_location)
print(f'Running with args: {run_args}')
# behave -t @smoke -t ~@login -k -f allure_behave.formatter:AllureFormatter -o output --no-capture
try:
return_code = behave_main(run_args)
test_result = False if return_code == 1 else True
except Exception as e:
print(e)
test_result = False
response = {'test_result': test_result}
s3 = boto3.resource('s3')
for file in os.listdir(results_location):
if file.endswith('.json'):
s3.Bucket(REPORTS_BUCKET).upload_file(f'{results_location}/{file}', f'tmp_reports/{file}')
call(f'rm -rf {results_location}', shell=True)
return {
'statusCode': 200,
'body': json.dumps(response)
}
The lambda_runner method is executed with tags that are passed in the event. It will handle a feature file having a name from the event and at least one of those tags. At the end of a single test, we need to upload our results to the S3 bucket. The last thing is to return a Lambda result with a status code and a response from tests.
There’s a serverless file with a definition of max memory size, lambda timeout, used layers, and also some policies that allow us to upload the files into S3 or save the logs in CloudWatch.
lambda/serverless.yml
service: lambda-test-runner
app: lambda-test-runner
provider:
name: aws
runtime: python3.6
region: eu-central-1
memorySize: 512
timeout: 900
iamManagedPolicies:
- "arn:aws:iam::aws:policy/CloudWatchLogsFullAccess"
- "arn:aws:iam::aws:policy/AmazonS3FullAccess"
functions:
lambda_runner:
handler: handler.lambda_runner
events:
- http:
path: lambda_runner
method: get
layers:
- ${cf:lambda-selenium-layer-dev.SeleniumLayerExport}
- ${cf:lambda-selenium-layer-dev.ChromedriverLayerExport}
- ${cf:lambda-selenium-layer-dev.ChromeLayerExport}
- ${cf:lambda-tests-layer-dev.FeaturesLayerExport}
Now let’s go back to the first lambda function. There will be a little more here, so we'll go through it in batches. Firstly, imports and global variables. REPORTS_BUCKET should have the same value as it’s in the environment.py file (tests layer).
test_list/handler.py
import json
import logging
import os
import shutil
import subprocess
from concurrent.futures import ThreadPoolExecutor as PoolExecutor
from datetime import date, datetime
import boto3
from botocore.client import ClientError, Config
REPORTS_BUCKET = 'aws-selenium-test-reports'
SCREENSHOTS_FOLDER = 'failed_scenarios_screenshots/'
CURRENT_DATE = str(date.today())
REPORTS_FOLDER = 'tmp_reports/'
HISTORY_FOLDER = 'history/'
TMP_REPORTS_FOLDER = f'/tmp/{REPORTS_FOLDER}'
TMP_REPORTS_ALLURE_FOLDER = f'{TMP_REPORTS_FOLDER}Allure/'
TMP_REPORTS_ALLURE_HISTORY_FOLDER = f'{TMP_REPORTS_ALLURE_FOLDER}{HISTORY_FOLDER}'
REGION = 'eu-central-1'
logger = logging.getLogger()
logger.setLevel(logging.INFO)
There are some useful functions to avoid duplication and make the code more readable. The first one will find and return all .feature files which exist on the tests layer. Then we have a few functions that let us create a new AWS bucket or folder, remove it, upload reports, or download some files.
test_list/handler.py
def get_test_cases_list() -> list:
return [file for file in os.listdir('/opt') if file.endswith('.feature')]
def get_s3_resource():
return boto3.resource('s3')
def get_s3_client():
return boto3.client('s3', config=Config(read_timeout=900, connect_timeout=900, max_pool_connections=500))
def remove_s3_folder(folder_name: str):
s3 = get_s3_resource()
bucket = s3.Bucket(REPORTS_BUCKET)
bucket.objects.filter(Prefix=folder_name).delete()
def create_bucket(bucket_name: str):
client = get_s3_client()
try:
client.head_bucket(Bucket=bucket_name)
except ClientError:
location = {'LocationConstraint': REGION}
client.create_bucket(Bucket=bucket_name, CreateBucketConfiguration=location)
def create_folder(bucket_name: str, folder_name: str):
client = get_s3_client()
client.put_object(
Bucket=bucket_name,
Body='',
Key=folder_name
)
def create_sub_folder(bucket_name: str, folder_name: str, sub_folder_name: str):
client = get_s3_client()
client.put_object(
Bucket=bucket_name,
Body='',
Key=f'{folder_name}{sub_folder_name}'
)
def upload_html_report_to_s3(report_path: str):
s3 = get_s3_resource()
current_path = os.getcwd()
os.chdir('/tmp')
shutil.make_archive('report', 'zip', report_path)
s3.Bucket(REPORTS_BUCKET).upload_file('report.zip', f'report_{str(datetime.now())}.zip')
os.chdir(current_path)
def upload_report_history_to_s3():
s3 = get_s3_resource()
current_path = os.getcwd()
os.chdir(TMP_REPORTS_ALLURE_HISTORY_FOLDER)
for file in os.listdir(TMP_REPORTS_ALLURE_HISTORY_FOLDER):
if file.endswith('.json'):
s3.Bucket(REPORTS_BUCKET).upload_file(file, f'{HISTORY_FOLDER}{file}')
os.chdir(current_path)
def download_folder_from_bucket(bucket, dist, local='/tmp'):
s3 = get_s3_resource()
paginator = s3.meta.client.get_paginator('list_objects')
for result in paginator.paginate(Bucket=bucket, Delimiter='/', Prefix=dist):
if result.get('CommonPrefixes') is not None:
for subdir in result.get('CommonPrefixes'):
download_folder_from_bucket(subdir.get('Prefix'), bucket, local)
for file in result.get('Contents', []):
destination_pathname = os.path.join(local, file.get('Key'))
if not os.path.exists(os.path.dirname(destination_pathname)):
os.makedirs(os.path.dirname(destination_pathname))
if not file.get('Key').endswith('/'):
s3.meta.client.download_file(bucket, file.get('Key'), destination_pathname)
For that handler, we also need a serverless file. There’s one additional policy AWSLambdaExecute and some actions that are required to invoke another lambda.
test_list/serverless.yml
service: lambda-test-list
app: lambda-test-list
provider:
name: aws
runtime: python3.6
region: eu-central-1
memorySize: 512
timeout: 900
iamManagedPolicies:
- "arn:aws:iam::aws:policy/CloudWatchLogsFullAccess"
- "arn:aws:iam::aws:policy/AmazonS3FullAccess"
- "arn:aws:iam::aws:policy/AWSLambdaExecute"
iamRoleStatements:
- Effect: Allow
Action:
- lambda:InvokeAsync
- lambda:InvokeFunction
Resource:
- arn:aws:lambda:eu-central-1:*:*
functions:
lambda_test_list:
handler: handler.lambda_test_list
events:
- http:
path: lambda_test_list
method: get
layers:
- ${cf:lambda-tests-layer-dev.FeaturesLayerExport}
- ${cf:lambda-selenium-layer-dev.AllureLayerExport}
And the last part of this lambda - the handler. In the beginning, we need to get a list of all test cases. Then if the action is run_tests , we get the tags from the event. In order to save reports or screenshots, we must have a bucket and folders created. The invoke_test function will be executed concurrently by the PoolExecutor. This function invokes a lambda, which runs a test with a given feature name. Then it checks the result and adds it to the statistics so that we know how many tests failed and which ones.
In the end, we want to generate one Allure report. In order to do that, we need to download all .json reports, which were uploaded to the S3 bucket after each test. If we care about trends, we can also download data from the history folder. With the allure generate command and proper parameters, we are able to create a really good looking HTML report. But we can’t see it at this point. We’ll upload that report into the S3 bucket with a newly created history folder so that in the next test execution, we can compare the results. If there are no errors, our lambda will return some statistics and links after the process will end.
test_list/handler.py
def lambda_test_list(event, context):
test_cases = get_test_cases_list()
if event['action'] == 'run_tests':
tags = event['tags']
create_bucket(bucket_name=REPORTS_BUCKET)
create_folder(bucket_name=REPORTS_BUCKET, folder_name=SCREENSHOTS_FOLDER)
create_sub_folder(
bucket_name=REPORTS_BUCKET, folder_name=SCREENSHOTS_FOLDER, sub_folder_name=f'{CURRENT_DATE}/'
)
remove_s3_folder(folder_name=REPORTS_FOLDER)
create_folder(bucket_name=REPORTS_BUCKET, folder_name=REPORTS_FOLDER)
client = boto3.client(
'lambda',
region_name=REGION,
config=Config(read_timeout=900, connect_timeout=900, max_pool_connections=500)
)
stats = {'passed': 0, 'failed': 0, 'passed_tc': [], 'failed_tc': []}
def invoke_test(tc_name):
response = client.invoke(
FunctionName='lambda-test-runner-dev-lambda_runner',
InvocationType='RequestResponse',
LogType='Tail',
Payload=f'{{"tc_name": "{tc_name}", "tags": "{tags}"}}'
)
result_payload = json.loads(response['Payload'].read())
result_body = json.loads(result_payload['body'])
test_passed = bool(result_body['test_result'])
if test_passed:
stats['passed'] += 1
stats['passed_tc'].append(tc_name)
else:
stats['failed'] += 1
stats['failed_tc'].append(tc_name)
with PoolExecutor(max_workers=500) as executor:
for _ in executor.map(invoke_test, test_cases):
pass
try:
download_folder_from_bucket(bucket=REPORTS_BUCKET, dist=REPORTS_FOLDER)
download_folder_from_bucket(bucket=REPORTS_BUCKET, dist=HISTORY_FOLDER, local=TMP_REPORTS_FOLDER)
command_generate_allure_report = [
f'/opt/allure-2.10.0/bin/allure generate --clean {TMP_REPORTS_FOLDER} -o {TMP_REPORTS_ALLURE_FOLDER}'
]
subprocess.call(command_generate_allure_report, shell=True)
upload_html_report_to_s3(report_path=TMP_REPORTS_ALLURE_FOLDER)
upload_report_history_to_s3()
remove_s3_folder(REPORTS_FOLDER)
subprocess.call('rm -rf /tmp/*', shell=True)
except Exception as e:
print(f'Error when generating report: {e}')
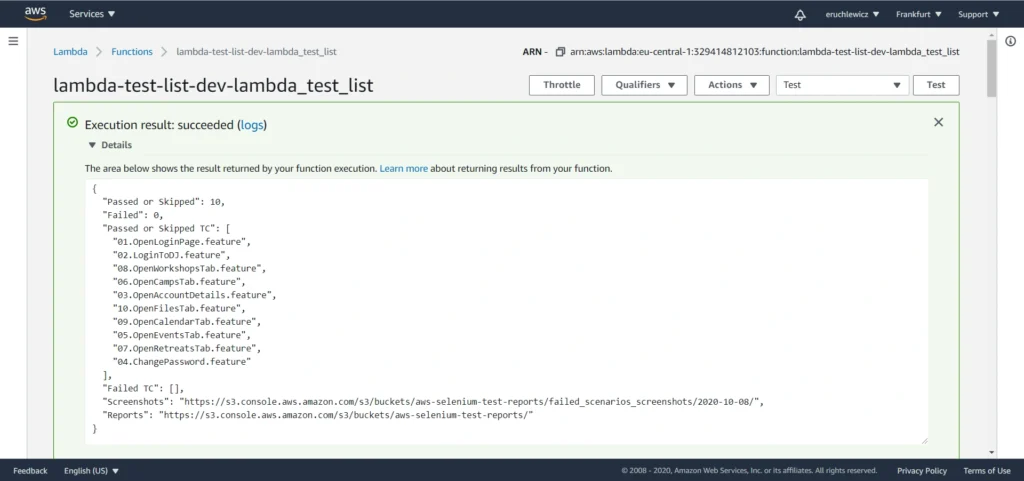
return {
'Passed': stats['passed'],
'Failed': stats['failed'],
'Passed TC': stats['passed_tc'],
'Failed TC': stats['failed_tc'],
'Screenshots': f'https://s3.console.aws.amazon.com/s3/buckets/{REPORTS_BUCKET}/'
f'{SCREENSHOTS_FOLDER}{CURRENT_DATE}/',
'Reports': f'https://s3.console.aws.amazon.com/s3/buckets/{REPORTS_BUCKET}/'
}
else:
return test_cases
Once we have it all set, we need to deploy our code. This shouldn’t be difficult. Let’s open a command prompt in the selenium_layer directory and execute the serverless deploy command. When it’s finished, do the same thing in the ‘tests’ directory, lambda directory, and finally in the test_list directory. The order of deployment is important because they are dependent on each other.
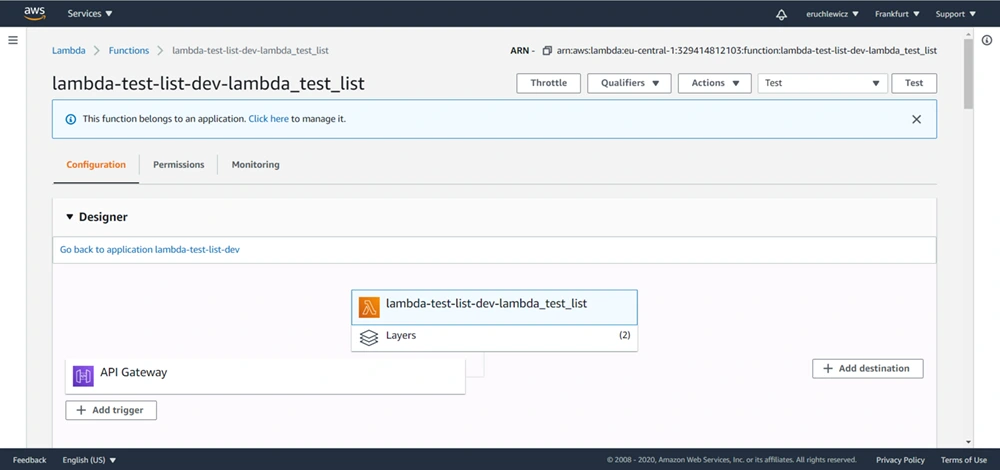
When everything is set, let’s navigate to our test-list-lambda in the AWS console.
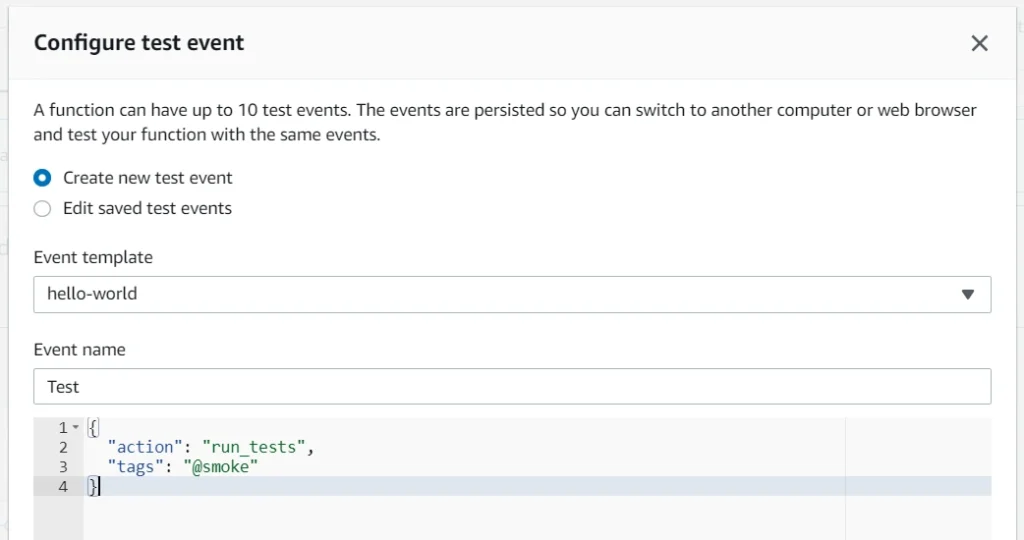
We need to create a new event. I already have three, the Test one is what we’re looking for. Click on the Configure test events option.
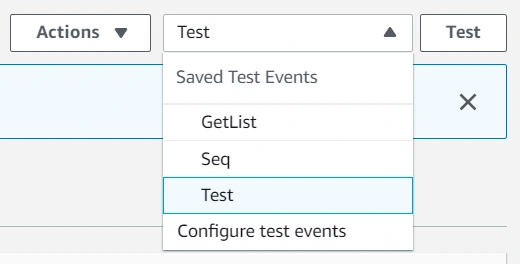
Then select an event template, an event name, and fill JSON. In the future, you can add more tags separated with a single space. Click Create to save that event.
The last step is to click the Test button and wait for the results. In our case, it took almost one minute. The longest part of our solution is generating the Allure report when all tests are finished.
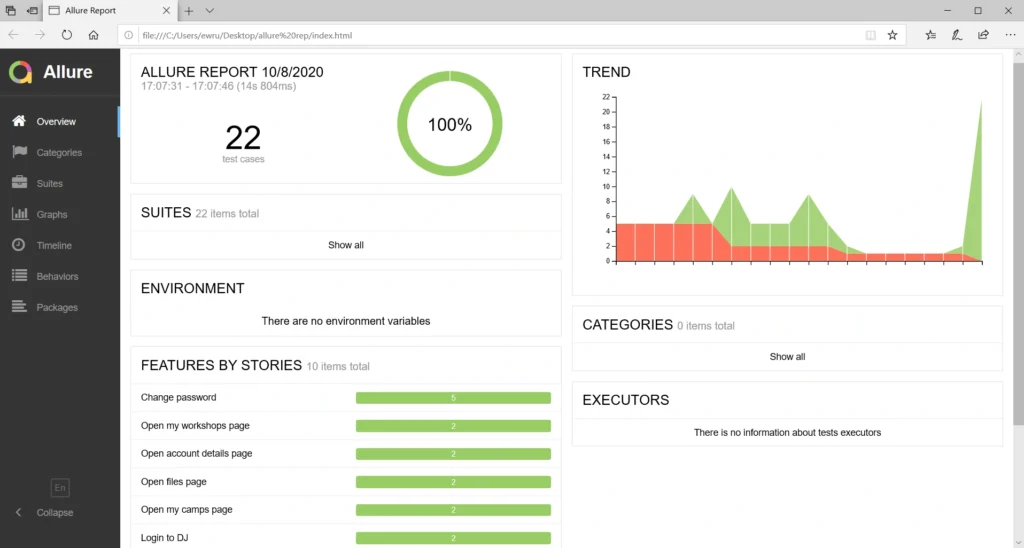
When you navigate to the reports bucket and download the latest one, you need to unpack the .zip file locally and open the index.html file in the browser. Unfortunately, most of the browsers won’t handle it that easily. If you have Allure installed, you can use the allure serve <path> command. It creates a local Jetty server instance, serves the generated report, and opens it in the default browser. But there’s also a workaround - Microsoft Edge. Just right-click on the index.html file and open it with that browser. It works!
Statistics
Everybody knows that time is money. Let’s check how much we can save. Here we have a division into the duration of the tests themselves and the entire process.
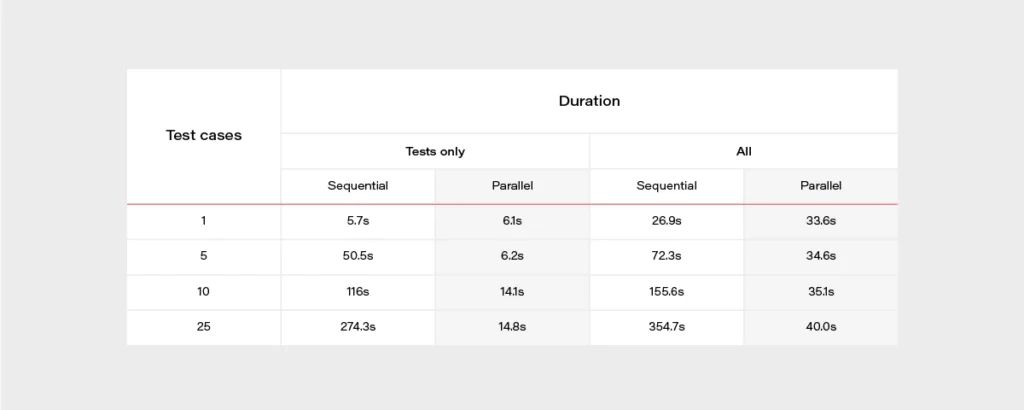
It’s really easy to find out that parallel tests are much faster. When having a set of 500 test cases, the difference is huge. It can take about 2 hours when running in a sequential approach or 2 minutes in parallel. The chart below may give a better overview.
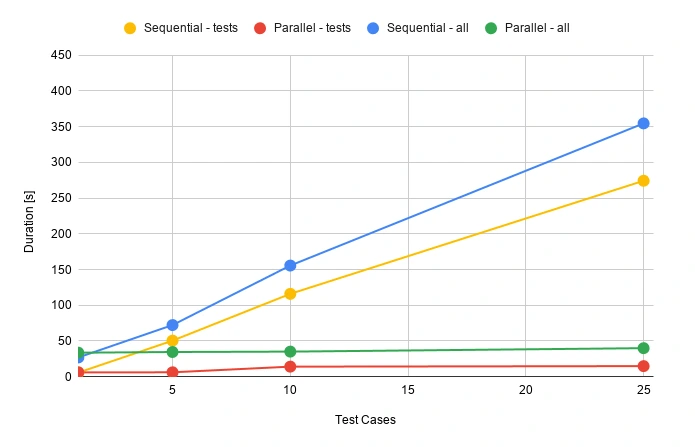
During the release, there’s usually not that much time for doing regression tests. Same with running tests that take several hours to complete. Parallel testing may speed up the whole release process.
Well, but what is the price for that convenience? Actually not that high.
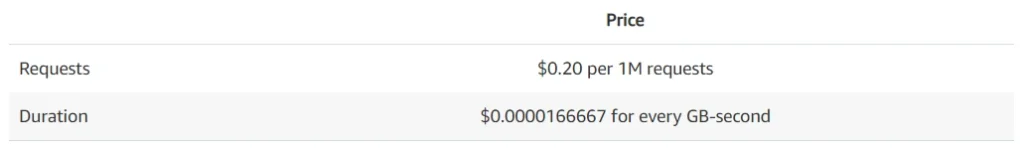
Let’s assume that we have 100 feature files, and it takes 30 seconds for each one to execute. We can set a 512MB memory size for our lambda function. Tests will be executed daily in the development environment and occasionally before releases. We can assume 50 executions of each test monthly.
Total compute (seconds) = 100 * 50 * (30s) = 150,000 seconds
Total compute (GB-s) = 150,000 * 512MB/1024 = 75,000 GB-s
Monthly compute charges = 75,000 * $0.00001667 = $1.25
Monthly request charges = 100 * 50 * $0.2/M = $0.01
Total = $1.26
It looks very promising. If you have more tests or they last longer, you can double this price. It’s still extremely low!
AWS Lambda handlers - summary
We went through quite an extended Selenium test configuration with Behave and Allure and made it work in the parallel process using AWS Lambda to achieve the shortest time waiting for results. Everything is ready to be used with your own app, just add some tests! Of course, there is still room for improvement - reports are now available in the AWS S3 bucket but could be attached to emails or served so that anybody can display them in a browser with a URL. You can also think of CI/CD practices. It's good to have continuous testing in the continuous integration process, e.g., when pushing some new changes to the main or release branch in your GIT repository in order to find all bugs as soon as possible. Hopefully, this article will help you with creating your custom testing process and speed up your work.
Sources
Interested in our services?
Reach out for tailored solutions and expert guidance.