
Thinking out loud
Where we share the insights, questions, and observations that shape our approach.
Compliance as a runtime property, not a document trail
Which model produced this output, what went into the prompt, and who could see the result? Answering questions like this usually starts a small archaeology project: exporting logs, finding the engineer who remembers the deployment, reconciling what turns up against a register that was accurate on the day it was written. The answer normally arrives, assembled by hand. Producing it again next quarter means repeating the exercise.
The EU AI Act turns that question into a standing obligation, and the date for the largest part of it just moved. The omnibus agreement reached by the EU institutions in May 2026 pushes high-risk obligations to 2 December 2027 for stand-alone systems under Annex III and 2 August 2028 for AI embedded in regulated products under Annex I. Nothing else moved: the general-purpose AI rules have applied since August 2025, the Article 50 transparency duties arrived on 2 August 2026, and the Article 5 prohibitions are in force.
The interesting question is what that time is for. It can go into getting better at the archaeology running the exercise faster, with more people who know where to look. Or it can go into building systems that answer those questions on their own.
What EU AI Act compliance actually asks for
Read Article 12 closely and the requirement is technical. High-risk systems must allow for the automatic recording of events over the lifetime of the system, at a level of traceability appropriate to the system's purpose, sufficient to identify situations where the system may present a risk or undergo substantial modification, and to support post-market monitoring.
Article 19 adds retention: providers keep the logs their systems automatically generate for a period appropriate to the intended purpose, and in any case at least six months.
The word doing the work in both places is automatic. Both articles describe a property the system has to possess while running. Documentation about how logging ought to work leaves the requirement unmet.
The same is true across most of the obligations. What data entered the model. Which version was serving in April. Who had access, and when. Whether human oversight actually engaged, or merely existed on an org chart. Every one of these is a question about the behavior of a running system, answerable only from a record that the system produced while running.
Why a GRC platform cannot be the source of truth
GRC platforms are good at what they were built for: policies, attestations, control libraries, risk registers, questionnaires. That is the intent layer, and it matters the AI Act does require documented governance, and an organization without it is starting from behind.
But intent and behavior are different layers, and only one of them is evidence. When the controls live in a system beside the one being governed, the evidence has to be assembled by hand: someone exports logs, someone reconciles a spreadsheet against a deployment, someone asks an engineering team what changed six months ago. Two things follow, and both are avoidable.
The first is drift. A declared control and an operating system diverge quietly, and the gap is discovered at audit rather than at the moment it opened.
The second is cost. If evidence is produced by people, every audit, every customer security review and every regulatory inquiry is a project with a budget.
The scale of the gap is visible in the data. In Vision Compliance's 2026 EU AI Act Readiness Report, published in April 2026 across eight industries, 61% of organizations had no process for generating the required technical documentation data governance records, model performance metrics, human oversight procedures. 74% had no designated internal owner for AI compliance, and 83% had no formal inventory of the AI systems they use or deploy. The report's own summary of the problem is worth quoting: most organizations know the AI Act exists, but few appreciate that "the regulation goes well beyond policy statements."
That last figure is the one that compounds. An AI system inventory assembled manually for an audit is a snapshot of what someone could remember and find; the obligations it feeds are continuous.
Controls that run where the AI runs
The alternative is to put the control at the point of execution, which in practice means the layer every model call already passes through.
An AI gateway sitting between applications and models is in a position to do what a parallel governance system cannot. It records the model and version that served each call, the application and team that made it, and the access path used not because anyone declared it, but because that is what passing through looks like. Input and output filtering applies there, consistently, rather than being reimplemented in each application with its own interpretation of the policy. Risk classification lives with the system in a registry that updates as the system changes.
The important shift is what a policy becomes. In the document-trail model, a policy is a statement about a system, and compliance is the ongoing work of keeping the statement true. In the runtime model, the policy is the configuration the system runs on. The two cannot drift apart, because they are the same object. Evidence stops being something you produce and becomes something you already have.
This is the distinction worth applying when evaluating an AI governance platform: does it describe the estate, or does it sit in the path of it? A tool that ingests declarations is a better filing cabinet. A tool in the request path is a control.
GRC as the consumer of the record, not its collector
None of this argues for replacing a GRC programme. Risk appetite, accountability, sign-off, third-party assessment those belong exactly where they are, and the AI Act expects them.
What changes is the direction of the data. Instead of the GRC function chasing engineering teams for evidence each quarter, the runtime emits a continuous record and GRC consumes it: current inventory, current risk classification, access history, retained logs with a retention policy that satisfies Article 19 without anyone remembering to set it.
EU AI Act compliance software is genuinely useful in that arrangement, because it finally has something reliable to work with. The same tool sitting on top of manually gathered inputs inherits every weakness of the gathering. Which suggests a different reading of the 61% figure above: what most organizations are missing is a source of technical evidence for a compliance platform to draw on.
What the extra fifteen months are for
The systems being deployed now are the systems that will be in scope in December 2027. Retrofitting traceability into a production system is materially harder than having it from the start and unlike a documentation exercise, it cannot be completed in the quarter before a deadline.
There is also a practical argument that has nothing to do with the regulator. Prompt- and response-level records, model version history and access logs are what you need when a customer asks how the system arrived at what it told them, when an internal review needs to reconstruct an incident, or when a model upgrade changes behavior in a way nobody expected. Organizations that build this only for the AI Act tend to find they were the primary users of it all along.
Aiboostr was built on that premise. Guardrails, tracing, the model and agent registry and risk classification are enforced and recorded at the point of execution, so the compliance record is a by-product of running the estate rather than a separate exercise performed on top of it. Whether an auditor ever asks is, in a sense, beside the point: the same record is what makes the system operable.
Compliance in this shape stops being a project with an end date. It becomes a property of the environment and properties do not need to be renewed.
Sources
- Regulation (EU) 2024/1689 (AI Act), Article 12 (record-keeping) and Article 19 (automatically generated logs)
- EU institutions' omnibus agreement on AI Act timelines, May 2026 Annex III high-risk obligations deferred to 2 December 2027, Annex I to 2 August 2028, binding once published in the Official Journal; GPAI, Article 50 transparency and Article 5 prohibitions unchanged
- Vision Compliance, "2026 EU AI Act Readiness Report", April 2026 assessment across eight industries

Stop benchmarking your private model against the wrong opponent
A team stands up an open-weight model on internal infrastructure, points it at the same broad set of questions they used to try out a commercial model six months earlier, reads both sets of answers side by side, and concludes that private models are not there yet.
The comparison was run carefully. The conclusion follows from it. And it answers a question nobody in the organization had asked, because nobody proposed replacing a frontier model at everything.
How far behind open-weight models actually are
The general capability gap is real, and it is smaller than the pilot above suggests. Epoch AI tracks it with the Epoch Capabilities Index, a composite measure of model capability, and reported in May 2026 that since January the most capable open-weight models have trailed frontier closed models by an average of four months, or roughly 8 ECI points -a distance Epoch compares to the step between two consecutive versions of the same commercial model family.
Worth stating the caveat: ECI is Epoch's own composite index, and any single number that summarises "capability" carries assumptions about which capabilities count. That caveat happens to be the point of this article.
Still, four months is a useful figure for a planning conversation, because it reframes the choice. A four-month lag on a fast-moving frontier is not a technology generation. It means a self-hosted stack that can adopt new open weights as they land operates a short distance behind the leading edge, permanently -and the distance is measured in the same units as your own release cadence.
Why a general benchmark is the wrong instrument for a specific job
A composite index averages performance across mathematics, code, long-context reasoning, multilingual work, agentic tool use and much else. An enterprise use case draws on a thin slice of that surface. Classifying incoming tickets into eleven categories, extracting nine fields from a supplier invoice, answering questions from a fixed corpus of internal documentation, summarising a shift report into a defined template -none of these require the breadth that separates the top of the leaderboard from the model four months behind it.
On a narrow task, most of the quality comes from the system around the model. Retrieval that surfaces the right passage. A prompt shaped to the task rather than to a demo. Structured output the downstream system can rely on. Validation that catches malformed answers before a user sees them. A few hundred labelled examples for a light fine-tune. Change any of those and the measured difference between two models moves more than the models themselves differ.
This is the argument NVIDIA's research group made in their 2025 position paper on small language models in agentic systems: where specialized tasks repeat with little variation, smaller models are sufficient for the work and considerably more economical to run. The interesting consequence for anyone evaluating a private AI platform is that the leaderboard gap and the gap on your task are two different quantities, and only one of them appears in any published comparison.
How to design a comparison that answers your question
Four rules turn a model bake-off from an impression into a decision.
- Build an evaluation set from your own traffic. One or two hundred real cases with the expected result beats any public benchmark, because it measures the task you actually run rather than an average across tasks you do not. Production requests are also messier, shorter and more repetitive than the examples a project team invents in a workshop - and that difference usually favours the smaller model.
- Fix the acceptance criterion before the test. "Better" decides nothing. "No more than three points of accuracy lost for a sixty per cent lower cost per call, with no regression on the twelve cases the legal team flagged" decides something. Without a threshold agreed in advance, the discussion ends in impressions and the incumbent wins by default.
- Compare complete paths, not bare models. A private model with good retrieval measured against a frontier model with none is an equally uninformative test in the opposite direction. Put both in the configuration you would actually ship.
- Measure on live traffic, in the shape it arrives. A slice of production, mirrored to both candidates, produces evidence. A curated demo set produces agreement in the room and surprises later.
Where the platform layer does the work
Each of those rules is cheap or expensive depending on where your models are consumed. If every call already passes through one place, most of the cost disappears.
Prompt- and response-level tracing gives you the evaluation set for free: the cases are the ones your users actually sent, captured as they happened, rather than reconstructed from memory. An AI gateway lets you route the same traffic to two models and collect comparable results, without touching the applications making the calls. Cost and usage monitoring supplies the other half of the equation, since the decision is a ratio and half of it is money. And private model serving with versioning and gradual rollout means the winner can go live on a slice of traffic first, with a way back if the evaluation missed something.
This is also where the sovereignty argument stops being abstract. A sovereign AI platform that runs the model inside your own perimeter is only useful in practice if switching to it is a measurable, reversible decision rather than a leap of faith. The evaluation machinery is what makes it the former.
The question has a shelf life of about a quarter
"Is an open-weight model good enough" has no general answer and never will. It has an answer per use case, and that answer expires -new open weights land every few weeks, the four-month gap moves, and a task that failed the test in March may pass it comfortably in September.
Which makes the durable capability the ability to run the test cheaply. An organization that needs six weeks and a project sponsor to compare two models will do it once, cite the result for two years, and be wrong for most of that time. An organization that can mirror traffic to a candidate model and read the numbers a day later will do it whenever something new shows up, and spend the difference on the use cases that are working.
Aiboostr exists to make that second pattern the default: one place where models are registered and consumed, real traffic available as evidence, cost attached to each option, and a controlled path to production for whichever one wins. The AI orchestration platform is what turns "good enough" from an opinion into a measurement you can repeat.
Sources
- Epoch AI, "Open models lag state-of-the-art closed models by 4 months", data insight published 29 May 2026 -Epoch Capabilities Index, average gap of ~8 ECI points since January 2026
- P. Belcak, G. Heinrich et al., "Small Language Models are the Future of Agentic AI", NVIDIA Research, 2025 -position paper on the sufficiency and economics of small models for specialized, repetitive agentic subtasks
The cost of an agent is not the cost of a prompt
A user clicks a button. Behind it, an agent reads a 200-page contract into context, calls four internal tools, retries two of them, spawns a sub-agent to check a supplier record, and returns an answer. The next click, from the same user in the same interface, costs a fraction of a cent.
Nothing about that is a defect. It is how agentic systems work. But it breaks an assumption that sits underneath most corporate budgeting: that consumption scales with activity. Seats, requests, logins, transactions - for thirty years, IT spend has been forecast by counting something a user does. Agentic AI is the first category where the same user action can differ in cost by three orders of magnitude, and where nobody can tell in advance which one they are about to get.
Why AI agent costs don't scale with your users
The multipliers are large and well documented. Anthropic's own engineering data puts it plainly: "agents typically use about 4× more tokens than chat interactions, and multi-agent systems use about 15× more tokens than chats."
The academic picture is starker still. A May 2026 study from the Stanford Digital Economy Lab and Microsoft Research, analysing token consumption in agentic coding tasks, found that agentic execution consumed up to 1000× more tokens than code chat on comparable work. More usefully for anyone trying to build a forecast, it found that running the same agent on the same task produced token bills that varied by as much as 30×.
That last number is the one worth sitting with. It means the variance is not primarily explained by which team is using the system, or how many people are using it, or how hard the task looks. It is intrinsic to the execution.
The study also identified where the money went in the systems it measured, and it is not where most people assume: most of the cost came from input tokens rather than output, because the agent re-read the original instruction and the record of its own previous steps before choosing each new action.
How strongly that holds anywhere else is a design question - how much history an agent carries forward is engineering, not physics. Which is rather the point: two organizations running comparable use cases can end up with entirely different cost profiles, and neither can infer its own from a published benchmark or a vendor's pricing page.
There is a governance implication hiding in a related finding: the models themselves consistently underestimate how many tokens they will spend. Self-reported estimates are not a control.
Why stopping runaway agent costs belongs in the LLM gateway
In traditional systems, a bad loop degrades response times and someone opens a ticket. In an agentic system, a bad loop bills. The failure is silent, fast, and financial - and the first signal is often the invoice.
In Harness's 2026 State of AI in FinOps report, based on a survey of 700 engineering leaders and practitioners across five countries, 72% said they had experienced unexpected AI cost spikes in the past year, and a third were caught out more than once. When a spike happened, only 20% could identify what caused it within hours.
Read those two figures together and the shape of the problem is clear. The issue is not that organizations lack budgets - 73% report having cost policies in place. It is that the budget operates on a monthly cycle while the risk operates on a per-execution one, and the diagnostic tooling operates on neither.
The control that matters here is not a bigger budget or a stricter approval process. It is a circuit breaker: a hard ceiling on what a single run may consume, enforced at the point of execution. An LLM gateway that every call passes through is the only place that limit can be applied consistently, because it is the only component that sees every call regardless of which application, team or framework made it. A per-run cap, a per-agent rate limit and a per-team budget are three different controls, and an agentic estate needs all three.
AI cost attribution tells you who. Tracing tells you why.
Most conversations about AI cost stop at attribution - splitting the vendor invoice across teams and projects. That is a necessary first step, and it is missing more often than not: the same Harness survey found that 52% of organizations have no clear owner for AI costs, and that while 73% have cost policies, only 13% have basic spending visibility. Fewer than 45% of engineers say they understand the cost of the features they build.
But attribution on its own does not change anything. "Team X spent 40,000 this quarter" is a fact, not a decision. It tells a finance lead where to direct a difficult conversation, and it tells the engineering lead on the other side of that conversation nothing they can act on.
What makes the number actionable is the layer below it: a trace of what happened inside a single run. How many steps did the agent take? How many were retries? How large was the context on step one versus step nine? Which tool call returned a payload that then rode along in every subsequent prompt?
Those questions have concrete answers, and the answers point at concrete fixes - caching a stable prefix, trimming what gets carried forward between steps, routing a mechanical sub-task to a smaller model, capping retry depth. This is the difference between cost reporting and cost engineering, and it is why AI agent governance cannot be built from billing data alone. Invoices are aggregated by vendor and model. The cost structure that explains them exists only in the execution record.
What to look for in an AI orchestration platform
If cost control is a requirement rather than a report, a few capabilities separate the options:
- Limits enforced per run, not just per month - a monthly budget cannot stop an incident that completes in ninety minutes
- Cost attached to a use case, not a vendor - the unit a business decision is made about is the use case, and it usually spans several models
- Trace-level breakdown - steps, retries and context growth within a single execution, not just totals
- One view across providers and self-hosted models - otherwise every comparison is manual and every gap is a blind spot
- Coverage of agent-to-agent calls - in a multi-agent orchestration platform, a chain that looks like one request from the outside may be a dozen model calls with distributed ownership
Aiboostr applies these at the layer where they can actually be enforced. The AI gateway carries token budgets and rate limits as policy rather than as application code, including caps scoped to a single agent session rather than a billing period - so a loop stops at a ceiling instead of at the end of the month. Usage and cost are attributed down to the use case, and prompt- and response-level tracing exposes the structure of a run, so the question after a spike is which step grew and why, not which vendor to email.
There is a broader point about enterprise AI orchestration in this. Cost, once it is measured at execution level, turns out to be one of the better health signals available: a sudden change in cost per run usually indicates that something changed in behavior - a longer context, a new tool, a retry loop, a model swap - and it frequently surfaces before any user files a complaint.
The realistic goal: bound AI agent costs, don't forecast them
AI spend cannot be forecast the way seat-based software is forecast. The variance is real, it is intrinsic to how agents work, and no amount of planning discipline will remove it - the research is unambiguous on that point.
What can be done is to bound it. A ceiling on the individual run, a budget per use case, an alert on the outlier, and a trace that explains the number after the fact. That is an achievable target, and it is a more honest one to put in front of a CFO than a forecast that assumes agents behave like software licences.
Sources
- Anthropic, "How we built our multi-agent research system" - token multipliers for agents and multi-agent systems
- L. Bai, E. Brynjolfsson, A. Pentland, J. Pei et al., "How Do AI Agents Spend Your Money? Analyzing and Predicting Token Consumption in Agentic Coding Tasks", Stanford Digital Economy Lab / Microsoft Research, May 2026
- Harness, "2026 State of AI in FinOps", survey of 700 engineering leaders and practitioners across five countries, May–June 2026
When Every Team Ships Agents, AI Inventory Has to Keep Up by Itself
A business analyst with no engineering background can assemble a working agent in an afternoon using tools the company already pays for and a developer can wire that agent into three internal systems before lunch.
This is not a failure of control. It is exactly what every AI enablement programme set out to achieve. The point of putting models, copilots and agent frameworks into people's hands was to let the people closest to a problem solve it without waiting two quarters for a project slot. That part is working.
What has not kept pace is the way organizations keep track of what they now run.
The AI registry problem is a clock-speed problem
Most enterprises already have a place where AI systems are supposed to be recorded - a tab in the application portfolio, a register maintained by the architecture team, a compliance questionnaire circulated before an audit. These artifacts are reviewed on a quarterly or semi-annual cycle, which was a perfectly sensible cadence when the underlying estate changed at roughly that speed.
The AI estate does not. In any given month a handful of teams build agents of their own, someone connects one of them to a new data source, and a model version is upgraded underneath them all. A document refreshed twice a year describes a system that stopped existing shortly after the document was signed off.
There is a second reason manual collection struggles, and it has nothing to do with diligence. Ask five teams to declare their AI systems and you will get five different interpretations of the question. Does a Python script that calls a hosted model count? Does a spreadsheet plugin? Does an agent that only runs on internal documentation? People are not withholding information, they genuinely do not know what belongs on the list, and no definition circulated by email will survive contact with the variety of things teams are actually building.
Both problems point at the same conclusion. An AI system inventory cannot be something people maintain alongside their work. It has to be something the environment produces as a by-product of running.
AI system inventory that writes itself
The mechanism is straightforward once the architecture allows for it. If every model call in the organization travels through a shared control point, an AI gateway sitting between applications and the models they consume, then the gateway already knows most of what any register would ask for. It sees which application called, which model and version answered, which credentials were used, how much was consumed and when.
The register stops being a form somebody fills in and becomes a view over traffic that is happening anyway. Nothing is declared; everything is observed.
That shift is what separates an AI governance platform from a governance document repository. A repository stores what teams said about their systems at a point in time. A platform records what those systems actually did, continuously, because it sits in the path.
In practice, the record worth having for each entry covers:
- Model and version, including whether it is a hosted commercial model or one served internally — the two carry different risk and different change dynamics
- Owner and team, so that every entry has a name attached to it before anyone needs one
- Purpose, in a sentence a non-engineer can read
- Reach — which tools, systems and data sources the agent or application can touch
- Volume and cost, which double as the best available proxy for how business-critical something has quietly become
- Risk classification, maintained as an attribute of the live system rather than a separate assessment document
- First seen and last seen — the second of which is underrated: knowing that an agent has not been invoked in four months is what makes retirement possible
Few platforms cover all of these today, which makes the list more useful as a set of evaluation questions than as a specification. The gaps are worth asking about directly, because they narrow what the register can answer: an inventory that tracks models but not the tools an agent can reach will not tell you what a system is able to do, and one that records what exists but not what has fallen out of use will grow indefinitely and never shrink.
Why AI agent governance is harder than tracking models
Registering models is the easy half. Agents are harder, because an agent is not a static entry - it is a moving configuration of a model, a set of instructions, and a set of tools it is permitted to call. Change the tool list and you have changed what the system can do, without touching the model at all. Anything that tracks only models will report that nothing has changed.
It gets one degree more complex in a multi-agent orchestration platform, where agents invoke other agents. Ownership stops being a column and becomes a graph: the customer-facing agent belongs to the service team, but it delegates document extraction to an agent owned by a different department, which in turn reaches a system owned by a third. When something behaves unexpectedly, the useful question is not "who owns this agent" but "what was the chain, and who owns each link". That answer only exists if the runtime records it as execution happens.
This is where enterprise AI orchestration stops being an infrastructure concern and becomes a governance one. The layer that routes and executes calls is the only layer that can see the whole chain which makes it the only honest source for the inventory.
Why an AI governance solution has to give teams something back
The compliance value of an inventory is the one everybody names first. The operational value is the one that shows up first.
A catalog that is accurate enough to trust works in both directions. It tells the platform team what exists, and it tells the next team what already exists before they build. A significant share of duplicated AI work happens because the person starting it had no realistic way of discovering that a neighbouring department finished something similar last quarter. Discovery is not a governance feature bolted onto a control system; it is the thing that makes teams willing to register their work at all, because the register gives them something back.
This is the difference between a governance system people route around and one they use. Controls that only take (approvals, forms, review boards) get avoided by anyone under delivery pressure. A catalog that saves a team three weeks by surfacing a reusable agent earns cooperation without needing to enforce it.
What to look for in AI governance software
If you are weighing up options with this in mind, a few questions separate them quickly:
- Does the inventory populate itself from live traffic, or does it depend on people entering records?
- Does it cover hosted commercial models and internally served models in one view, including a private AI platform or sovereign AI platform deployment, if data residency has pushed some workloads in-house?
- Does it track agents and their tool access, not just models?
- Does it retain history, so that "what was running in April" is a query rather than an investigation?
- Is the control point in the request path? If it is not, the register is a description of the system, not a record of it.
Aiboostr was built around that last question. The LLM gateway and the model and agent catalog are the same system: every call that passes through the AI orchestration platform updates the inventory, attaches usage and cost to a team and a use case, and keeps the risk classification with the system rather than in a parallel document.
Teams will keep shipping agents faster than any review cycle can absorb and they should. The inventory just has to be built to keep up on its own.
Model Context Protocol for Manufacturing: A Spring Boot Guide
Manufacturing and automotive companies sit on rich operational data. Equipment telemetry, maintenance logs, parts catalogs, production metrics, quality reports - it is all there, locked behind custom APIs, ERP systems, and internal databases. The data exists. The challenge is making it reachable by an AI application.
Today, connecting a large language model to your internal systems means writing custom glue code for every data source. You build a REST endpoint, parse the response, format it into a prompt, handle errors, and hope the model calls it correctly. Multiply that by dozens of internal services and the integration tax adds up fast.
Model Context Protocol (MCP) standardizes this. This guide shows how to expose manufacturing operations data to AI using MCP on Spring Boot 4 and Spring AI 2.0 - and, more importantly, how to do it without handing an autonomous model the keys to systems your plant actually runs on.
Key takeaways
- MCP is to AI integration what REST was to service communication: one contract, so any AI client can reach any data source without bespoke glue code per system.
- Your existing Spring Boot services become AI-accessible by adding annotations to methods that already exist. No rewrite, no stack change, no separate Python platform.
- The valuable questions in operations live in the join between systems - the ones no dashboard was designed to answer.
- The server authorizes callers; the client authorizes people. Filter the tool set by role rather than redacting data fields - a capability the model does not have cannot be prompted into existence.
- Every state-changing action needs a structural approval gate, not a polite instruction in a system prompt.
Front note: this article reflects Spring AI 2.0, MCPJava SDK 2.0 and MCP protocol revision 2025-11-25.The MCP maintainers published 2026-07-28 as final onschedule, introducing a stateless protocol core, an extensions framework andhardened authorization. It replaces 2025-11-25as the current specification, but publication does not switch anything off:deprecated features carry a minimum twelve-month window, and SDKs adopt attheir own pace. Everything in this article holds as written; if you aredesigning a deployment now, read the newer revision before you commit tosession-dependent infrastructure.
What is Model Context Protocol (MCP)?
Model Context Protocol (MCP) is an open protocol that standardizes how AI applications connect to external data sources and tools. An MCP server exposes your business data and operations as tools, resources, and prompts. An MCP client - the AI application - discovers them automatically at runtime and lets the model invoke them on its own. Instead of writing custom integration code for each system and each AI application, you implement the protocol once on each side.
Anthropic released MCP in November 2024. It has since become the default integration layer for agentic systems, with SDKs in TypeScript, Python, Java, and other languages.
Why Java and Spring Boot teams should care now
Spring AI 2.0 reached general availability on June 12, 2026, built on Spring Boot 4 and Spring Framework 7, with MCP support folded into the framework itself - the MCP annotations that used to live in a community library are now part of Spring AI core. The MCP Java SDK was built by the Spring team and contributed to Anthropic, so Java and Spring Boot - the backbone of enterprise manufacturing software - are first-class MCP citizens.
You do not need to switch stacks. Your existing Spring Boot expertise applies directly.
Where this pattern applies in manufacturing
Before the code, the business scan. The architecture in this article fits any place where operational data sits behind an internal API and people ask ad-hoc questions the reporting layer never anticipated. Four common shapes:
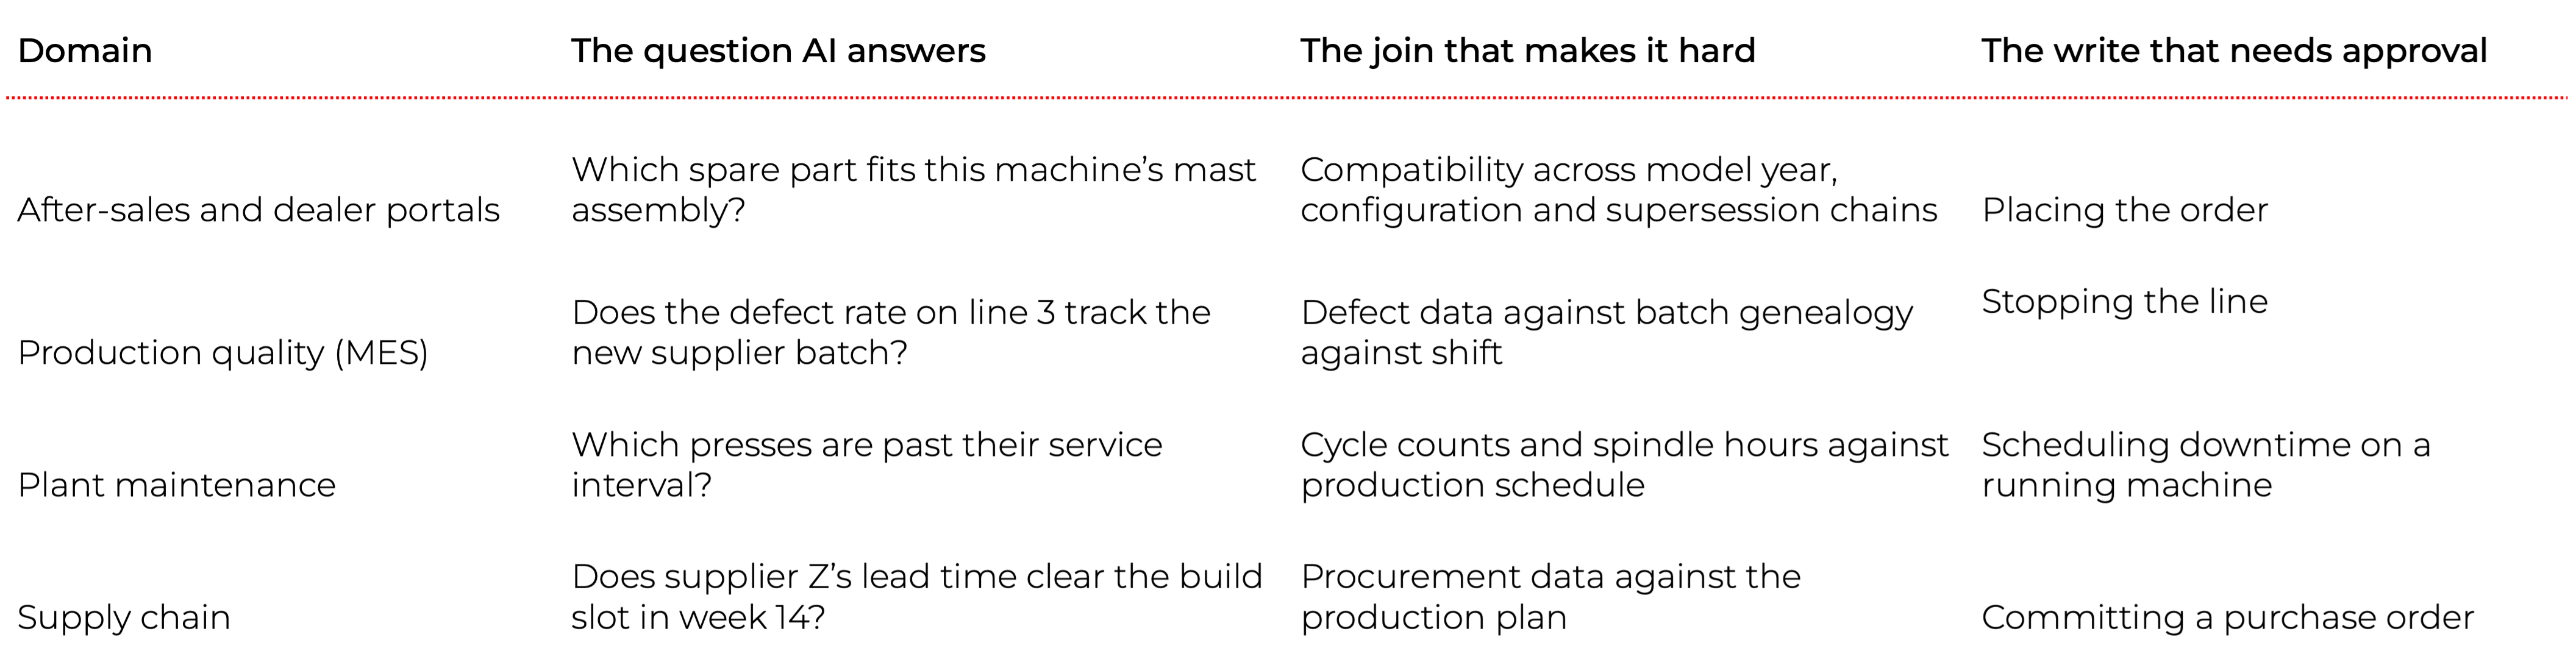
Every row has the same two properties: the answer requires joining systems that do not know about each other, and the corresponding action is one a human should sign off on. That is the shape this article solves.
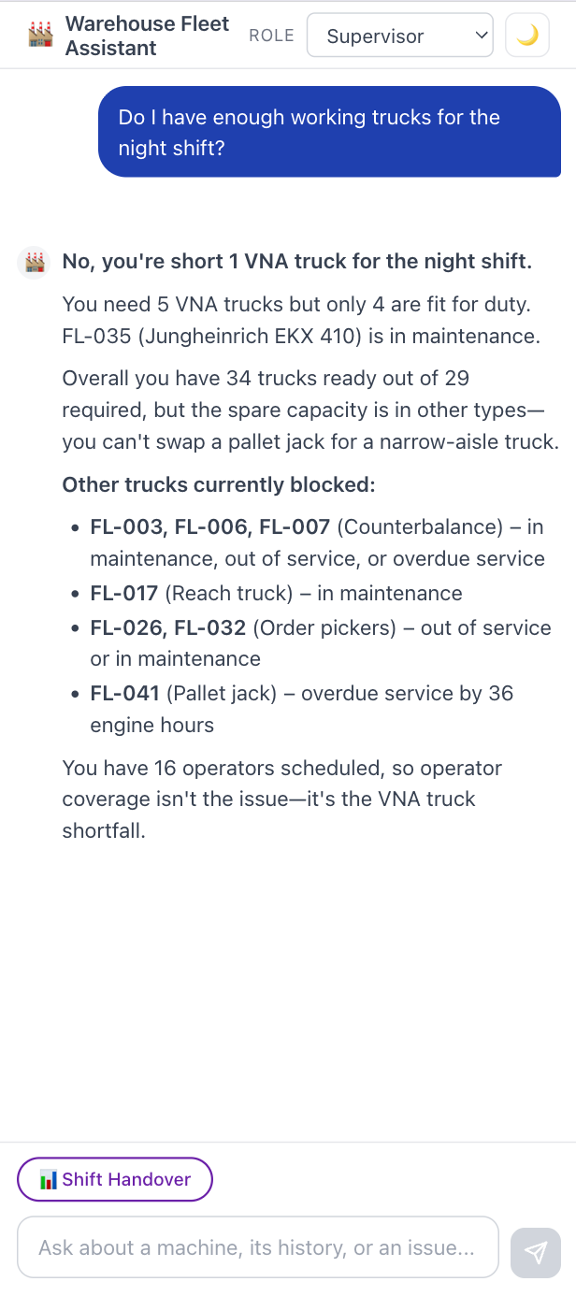
We will build it on one concrete case - an assistant for an intralogistics fleet, the lift trucks, operators and shifts that move goods inside a warehouse. Forty-two lift trucks, 60 operators, three shifts, two halls. A supervisor asks “do I have enough working trucks for the night shift?” and gets a real answer computed from live data.
The forklifts are an example, not the point. Pick whichever domain you actually own; the architecture does not change.
What this article covers
- An MCP server in Spring Boot exposingnine tools, two resources and two prompts over Streamable HTTP
- An MCP client that filters the tool setby the caller’s role, and parks state-changing calls behind a human approvalgate
- A chat UI with streamed responses, a rolepicker and approval cards
- Three ideas worth stealing: expose the data,not the answers; let the server describe and the client decide; structurebeats instruction
Built on: Java 21, Spring Boot 4.1, Spring AI 2.0,MCP Java SDK 2.0.
The gap: a question no dashboard can answer
Fleet management systems come with dashboards. There is a truck availability screen, a maintenance backlog screen, a shift roster. Each one is well designed. None of them answers the supervisor’s actual question, because the answer lives in the intersection:
- how many trucks are physically available,
- minus those carrying an open high-priority fault,
- minus those past their service interval,
- compared against what the shift plan actually calls for - per truck type
A dashboard answers the questions its designer anticipated. The supervisor’s questions are ad-hoc, and they cut across four systems at once. That is the gap MCP fills: you expose the underlying data as tools and let the model do the joining, instead of building a fifth screen for every new question.
Here is what our finished assistant says:
34 trucks are fit for duty against 29 required - comfortable overall. But the night shift is one narrow-aisle truck short: the plan needs 5, only 4 are fit, because FL-035 is in maintenance. A spare pallet jack does not cover that.
Note what makes that answer useful. The headline number looks fine. The problem is a type mismatch buried two joins deep - exactly the kind of thing a human notices at 21:55 and not before.
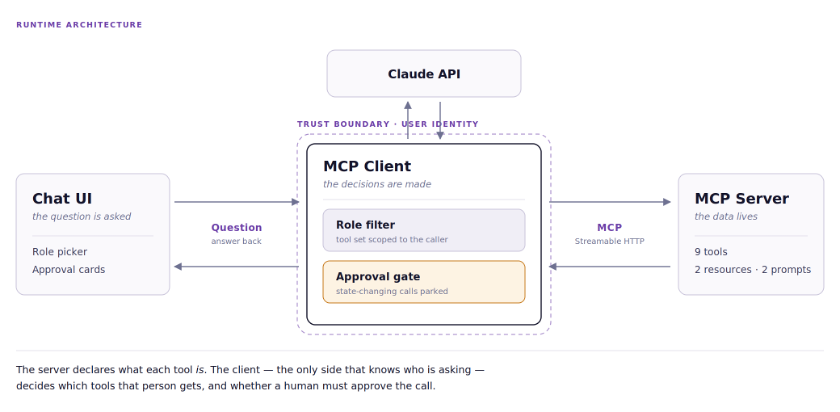
How MCP works: host, client and server
MCP follows a host → client → server architecture:
- Host - the application the user interacts with (our chat UI)
- Client - maintains a 1:1 connection with an MCP server and handles protocol negotiation
- Server - exposes your domain data and operations to AI
Tools vs resources vs prompts: how to choose
Each MCP server can expose three kinds of primitive. The distinction is who initiates the call.

For transport, MCP supports STDIO (for local and CLI tools launched as a subprocess) and Streamable HTTP (for deployed services). We use Streamable HTTP, since our server runs as a standalone Spring Boot application.
If you have built REST APIs, MCP will feel familiar - with one key difference: the LLM discovers and invokes your endpoints autonomously, based on their descriptions. You do not wire up explicit API calls. You describe what a tool does, and the model decides when to use it.
There is a second difference that matters more than it first appears, and we will return to it: a tool can describe not just what it does, but what kind of thing it is - whether it only reads, or whether it changes something. That declaration is what lets a client put a human in the loop.
If Spring AI itself is new to you, our introduction to Spring AI for Java developers covers the framework fundamentals this article builds on.
What the stack requires
Spring AI 2.0 requires Spring Boot 4 - it will not load in a 3.x context, so this is one upgrade decision rather than two. Spring Boot 4.1 requires Java 17 or later and supports up to Java 26. We are on Java 21.
One timing note for teams still on Boot 3.x: Spring Boot 3.5 and Spring Framework 6.2 reached end of life on June 30, 2026. If you were waiting for Spring AI 2.0 before planning that migration, the wait is over and the runway is not generous.
Dependencies are unremarkable. The MCP server needs exactly one starter, spring-ai-starter-mcp-server-webmvc. The client needs three: the MCP client starter, the model integration, and web support. That last one deserves a word, because it looks like cargo cult: the client pulls in both web and webflux. The application is a servlet-stack MVC app; WebFlux is there for Flux, which is how Spring AI’s streaming API returns tokens and how we emit them as Server-Sent Events. We are not running a reactive application - we are using the reactive types on an MVC stack.
The use case: warehouse fleet operations
Our scenario: a distribution center runs 42 lift trucks - counterbalance trucks, reach trucks, order pickers, very-narrow-aisle (VNA) trucks and powered pallet jacks - across two halls, worked by 60 operators on three shifts.
The people asking questions are not analysts. They are a shift supervisor, a health-and-safety officer, a fleet manager and a maintenance technician. Each has a job to finish and no interest in the data model.
We implement six things they actually do, plus three lookup tools that the others lean on:
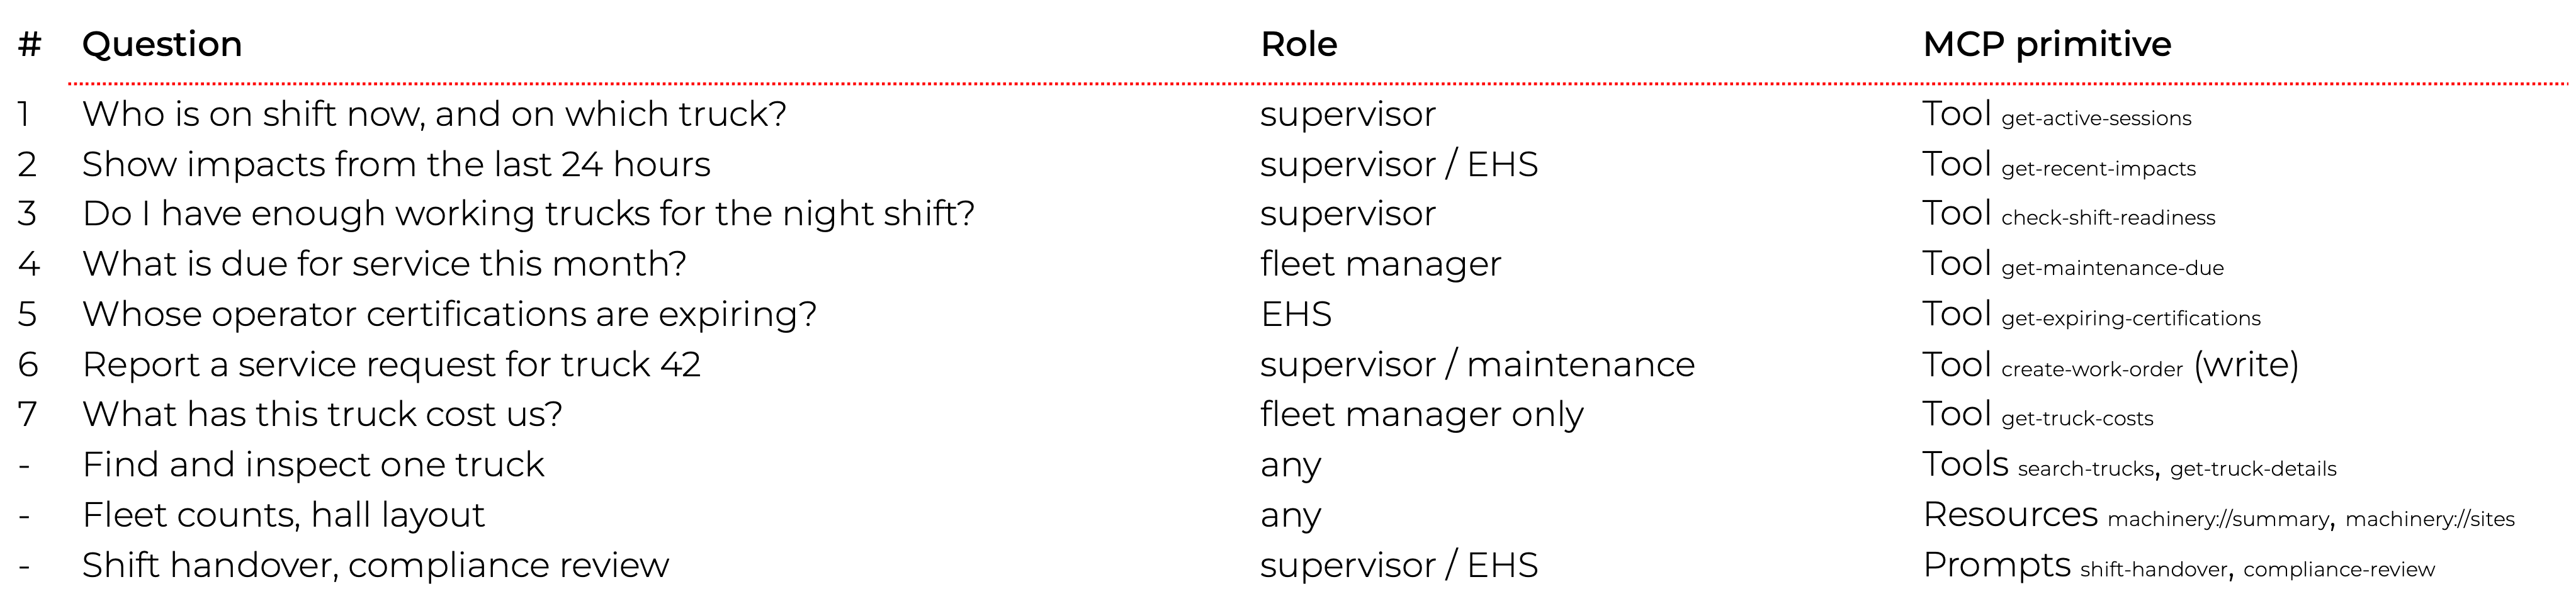
Nine tools in total. Row 7 looks like a detail and turns out to carry the whole authorization argument later on - cost visibility is granted by handing out a tool, not by hiding a field.
The data model is deliberately wider than these questions - trucks, operators, sessions, impacts, inspections, work orders, maintenance schedules, certifications, zones, shifts and cost entries. Only some of it is reachable through tools. That is the point: adding the next question is a dozen lines of Java, not a new screen.
MCP server: exposing operations as tools
The domain model earns its keep
Two modeling decisions do most of the work, and neither is about AI.
Service intervals are counted in engine hours, not calendar days. A truck running three shifts reaches its interval far sooner than one that sits idle. Model it as a next-service date and you get a maintenance queue that is quietly wrong - plausible, sorted, and misleading. So the truck record carries engineHours, and the schedule computes against it:
public record MaintenanceSchedule(
        String truckId,
        int intervalHours,
        int hoursAtLastService,
        LocalDate lastServiceDate,
        String serviceType
) {
    public int hoursUntilDue(int currentEngineHours) {
        return intervalHours - (currentEngineHours - hoursAtLastService);
    }

    public boolean isOverdue(int currentEngineHours) {
        return hoursUntilDue(currentEngineHours) <= 0;
    }
}
This is where domain modeling meets the AI application. When a user asks “what is due this month?”, they are asking a calendar question about an hours-based process. Somebody has to bridge that, and the honest place to do it is the tool description - more on that shortly.
The staffing plan is per truck type, not a single headcount. A shift carries a Map<TruckType, Integer> of what it requires, not one number. That single choice is what turns question 3 from arithmetic into something worth asking a computer, because it is what surfaces “plenty of trucks, wrong kind.”
In a real system this layer would be JPA repositories or calls to your fleet management API. The MCP annotations do not care where the data comes from.
Tools: how to write descriptions the model can act on
Tools are the primitive the LLM actually calls. Stat with the simplest useful one:
@McpTool(name = "get-active-sessions",
        description = "Show who is currently logged onto which truck, and where. "
                + "Use for questions like 'who is on shift right now and on what truck', "
                + "'who is driving FL-017', or 'how many operators are working in Hall B'.",
        annotations = @McpAnnotations(readOnlyHint = true, destructiveHint = false))
public OnShiftNow getActiveSessions() {
    // resolve the current shift, map active sessions to a typed record
}
Four things to notice.
1. Tool descriptions are critical. The LLM reads these to decide when to call each tool. Include natural-language examples of the queries that should trigger it. Write them as if explaining to a new colleague when to use this function.
2. Return records, not maps. Spring AI derives the tool’s output schema from the return type. A record gives the model a named, typed shape; Map<String, Object> gives it a guess.
3. Describe the parameters too. A tool description tells the model when to call; @McpToolParam tells it what to put in. This is where you spend your accuracy budget, because a well-chosen tool called with a nonsense argument still gives a wrong answer:
@McpToolParam(description = "Include trucks with at most this many engine hours left "
        + "before service. Defaults to 150 (roughly one month).", required = false)
Integer withinEngineHours
Mark optional parameters required = false and state the default in prose. A model that knows a parameter is optional will leave it out; a model that does not will invent a value.
4. annotations = @McpAnnotations(readOnlyHint = true, ...). This tool only reads. That declaration travels to the client over the protocol, and we are going to build on it.
The interesting tool is question 3, because it exists purely to do a join no dashboard does:
@McpTool(name = "check-shift-readiness",
        description = "Assess whether enough trucks are fit for duty for a given shift, broken "
                + "down by truck type. Combines four separate things no single dashboard holds "
                + "together: truck status, open high-priority work orders, engine-hour "
                + "maintenance overruns, and the shift staffing plan. A shift can have plenty "
                + "of trucks overall and still be short of a specific type - a spare pallet "
                + "jack does not cover a missing narrow-aisle truck. Use for 'do I have enough "
                + "working trucks for the night shift', 'are we ready for tomorrow morning', "
                + "or 'what is blocking the fleet'.",
        annotations = @McpAnnotations(readOnlyHint = true, destructiveHint = false))
public ShiftReadiness checkShiftReadiness(
        @McpToolParam(description = "Shift name or id - 'Night', 'Morning', 'Afternoon', "
                + "or SHIFT-1/2/3. Defaults to the shift after the current one.", required = false)
        String shift
) { /* ... */ }
Two details in that signature do real work. The default is the next shift, not the current one - at 21:55 a supervisor asking about readiness means the shift that is about to start. And the parameter accepts both the human name and the internal id, because the model will produce whichever the user said.
The logic that makes the tool worth calling is one small method - the definition of “fit for duty” that no single system owns:
sealed interface Blocker {
    record Status(Truck.TruckStatus status) implements Blocker {}
    record HighPriorityFault(String workOrderId) implements Blocker {}
    // negative, like MaintenanceSchedule.hoursUntilDue — one sign convention everywhere
    record PastService(int hoursUntilDue) implements Blocker {}
}

// ordersForTruck and schedule are resolved by the caller, once per fleet scan
private Optional<Blocker> blockingReason(Truck truck,
                                         List<WorkOrder> ordersForTruck,
                                         MaintenanceSchedule schedule) {
    if (truck.status() != Truck.TruckStatus.OPERATIONAL) {
        return Optional.of(new Blocker.Status(truck.status()));
    }
    // deliberate precedence: status, then faults, then service overruns.
    // A supervisor gets the hardest blocker, not a list of all of them.
    Optional<WorkOrder> fault = ordersForTruck.stream()
            .filter(order -> order.priority() == WorkOrder.Priority.HIGH)
            .findFirst();
    if (fault.isPresent()) {
        return Optional.of(new Blocker.HighPriorityFault(fault.get().id()));
    }
    if (schedule != null && schedule.isOverdue(truck.engineHours())) {
        return Optional.of(new Blocker.PastService(schedule.hoursUntilDue(truck.engineHours())));
    }
    return Optional.empty();
}
A truck can be OPERATIONAL and still be unfit - carrying a high-priority fault, or past its service interval. That distinction is business logic, it lives on your side, and it is precisely the sort of thing you were never going to get from a generic “query my database” integration. It is also the single most testable method in the codebase: pure inputs, one string out, no protocol involved.
And question 4 shows how to answer a calendar question honestly when the underlying process is not calendar-based:
@McpTool(name = "get-maintenance-due",
        description = "Maintenance queue ordered by engine hours remaining, not by calendar date - "
                + "a truck running three shifts reaches its interval far sooner than an idle one. "
                + "Overdue trucks come back with a negative value. About 150 engine hours is a "
                + "month of two-shift use, so use ~150 for 'what is due this month'.",
        annotations = @McpAnnotations(readOnlyHint = true, destructiveHint = false))
public MaintenanceQueue getMaintenanceDue(Integer withinEngineHours) { /* ... */ }
The conversion factor lives in the description. The model reads it and translates “this month” into the parameter the domain actually supports - and, in practice, explains the translation back to the user. You are teaching the model your domain in the place where it will actually read.
Read-only and mutating tools are different animals
Eight of our tools read. One writes. That difference deserves to be visible in the code, so the write tool lives alone in its own class:
@McpTool(name = "create-work-order",
        description = "Raise a service request against a truck. Creates a work order that "
                + "maintenance will pick up, so it changes fleet state. Use when the user asks "
                + "to report a fault or request service, e.g. 'report a hydraulic leak on truck 42' "
                + "or 'raise a work order for FL-017'.",
        annotations = @McpAnnotations(readOnlyHint = false, destructiveHint = true))
public WorkOrderCreated createWorkOrder(
        @McpToolParam(description = "Truck id or number, e.g. FL-042, 'truck 42' or just '42'.",
                required = true) String truckReference,
        @McpToolParam(description = "What is wrong with the truck, in the operator's own words.",
                required = true) String description,
        @McpToolParam(description = "Priority: LOW, MEDIUM or HIGH. Defaults to MEDIUM.",
                required = false) String priority,
        @McpToolParam(description = "Who is reporting it - operator id or name. Optional.",
                required = false) String reportedBy
) { /* ... */ }
destructiveHint = true is the whole point of this section. The server is stating what the tool is. It is not deciding what to do about it - the server has no idea who is asking or what your approval policy is. That decision belongs to the client, and we will get there.
Two smaller things worth copying. The tool returns a record describing what it created, not a status string: the model needs the new work order id to tell the user what happened. And truck lookup accepts "FL-042", "truck 42" or just "42", because users say “truck 42” - making the tool tolerant of that is cheaper than hoping the model always normalizes.
Resources and prompts
Resources provide read-only data that the application - not the model - pulls. Ours aggregates fleet-wide counts by type and status, engine-hour statistics, maintenance overruns and open work order totals, and returns it as JSON under machinery://summary.
When to use a resource instead of a tool: use a resource when the data is a snapshot the application wants to display or inject into context. Use a tool when the LLM needs to query with parameters. Resources are pulled by the application; tools are called by the model.
Prompts are user-driven: someone picks one deliberately. Ours belong to roles - a supervisor hands over a shift, an EHS officer reviews compliance:
@McpPrompt(name = "shift-handover",
        description = "Shift handover briefing for a supervisor: what is running, what broke, "
                + "and what the incoming shift needs to know")
public GetPromptResult shiftHandover(
        @McpArg(name = "shift", description = "Shift being handed over - 'Morning', "
                + "'Afternoon', 'Night'. Defaults to the current shift.", required = false)
        String shift
) {
    Shift current = resolveShift(shift);
    var readiness = fleetQueryTools.checkShiftReadiness(current.name());
    // ... assemble the data block, then wrap it in a user-role message
}
That second line is a lesson learned the hard way. The first version of this prompt handed the model raw counts - trucks by status, the staffing plan, a list of blockers - and asked it to judge readiness. It confidently subtracted operators from trucks and reported the fleet as 13 trucks short. Prompts are pre-loaded with data, so give the model the conclusion your code already computed, not the ingredients. Reusing the same method that backs check-shift-readiness also means there is exactly one definition of “ready” in the system.
Server configuration
Minimal - Spring AI auto-discovers annotated components:
spring:
  ai:
    mcp:
      server:
        name: warehouse-fleet-server
        type: SYNC
        protocol: STREAMABLE
        capabilities:
          tool: true
          resource: true
          prompt: true
Start it and you have an MCP server exposing nine tools, two resources and two prompts over Streamable HTTP at /mcp. The startup log confirms the counts, which is a surprisingly useful sanity check when you add a tool and nothing happens.
Building the AI application (the MCP client)
The client points at the server and picks a model:
spring:
  ai:
    mcp:
      client:
        streamable-http:
          connections:
            fleet-server:
              url: http://localhost:8081/mcp
    anthropic:
      api-key: ${ANTHROPIC_API_KEY}
      chat:
        options:
          model: claude-haiku-4-5
ToolCallbackProvider is auto-configured by Spring AI from that connection - it discovers every tool from every connected server at startup. You do not map tool calls yourself; the framework handles discovery, invocation and feeding results back into the conversation.
So the obvious thing to write is a ChatClient with the whole provider wired in as a default:
// what you would write first - and what we deliberately do not do
this.chatClient = ChatClient.builder(chatModel)
        .defaultTools(toolCallbackProvider)
        .defaultSystem(BASE_SYSTEM_PROMPT)
        .build();
Our ChatClient has no defaultsat all:
this.chatClient = ChatClient.builder(chatModel).build();Everything - system prompt and tool list - is supplied per request, and the reason is a failure mode rather than a style preference. A default tool set is the state the application falls back to when per-request scoping goes wrong: a role that resolves to nothing, a filter that matches nothing, a refactor that drops a line. If the default is “every tool from every server,” each of those bugs fails open, and the first symptom is an EHS officer filing work orders. With no defaults, the same bugs fail closed: the model gets an empty tool list and says it cannot help. That is a loud, harmless, five-minute bug.
When a supervisor asks “who is on shift right now?”:
- The message arrives as a streaming request
- Spring AI sends it to the model with the tool definitions for that request
- The model decides to call get-active-sessions
- Spring AI routes the call over MCP to our server
- The server executes and returns typed records
- The model turns them into prose
- The response streams back to the UI
All inside one chatClient.prompt(...).stream().content() call.
That is the happy path, and it is where most MCP tutorials stop. Two things are missing before you would put this in front of a warehouse.
Role-based access: who is allowed to ask?
A supervisor should not see cost data. An EHS officer should not create work orders. In our demo the role is a dropdown; in your system it comes from your identity provider. Either way, the role belongs to the client - our MCP server has no idea who is asking, and does not need to.
The important design decision is what the role filters. It is tempting to filter the data: call the tool, then strip the fields the user should not see. Do not. Filter the tool set:
public enum FleetRole {

    SUPERVISOR("Supervisor",
            Set.of("get-active-sessions", "get-recent-impacts", "check-shift-readiness",
                    "create-work-order", "search-trucks", "get-truck-details"),
            Set.of("shift-handover")),

    EHS("EHS officer",
            Set.of("get-recent-impacts", "get-expiring-certifications",
                    "search-trucks", "get-truck-details"),
            Set.of("compliance-review")),

    FLEET_MANAGER("Fleet manager",
            Set.of("get-maintenance-due", "check-shift-readiness", "get-truck-costs",
                    "search-trucks", "get-truck-details"),
            Set.of("shift-handover")),

    MAINTENANCE(/* ... */);
}
Then scope each request to the caller:
return chatClient.prompt()
        .system(BASE_SYSTEM_PROMPT + "\n\n" + role.briefing())
        .user(request.message())
        .tools(toolAccess.toolsFor(role).toArray())
        .stream()
        .content();
Each turn is scoped to whoever is asking, rather than to whatever the application booted with. The role also carries a short briefing appended to the system prompt - not as a security measure, but so the assistant’s tone matches the job. Telling the model “you are helping a supervisor on the floor” changes how it answers; it is the tool list that changes what it can answer.
Why is filtering tools better than filtering fields? Because an absent capability cannot be argued with. An EHS officer’s model has no work-order tool in its context at all - there is no prompt, however clever, that produces one. A redacted field, by contrast, is a negotiation you have invited the model into.
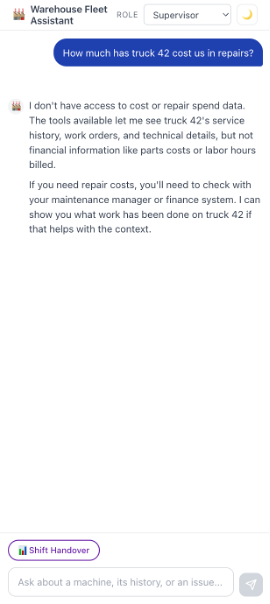
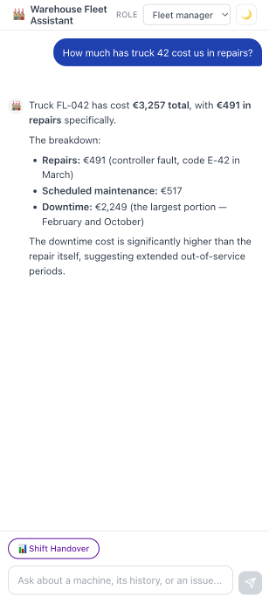
Cost visibility shows the pattern at its clearest. Rather than putting a totalCostEur field on get-truck-details and stripping it per role, costs live behind their own tool, get-truck-costs, handed only to the fleet manager. One mechanism, used for every permission. Ask the same question in two roles and the difference is visible in the transcript:
Supervisor - “How much has truck 42 cost us in repairs?” I do not have access to cost or repair budget data. What I can tell you about truck 42 is its status and maintenance history, any open work orders, service position and engine hours…
Fleet manager - same question Truck 42 (FL-042, a Still EXU 20) has cost €3,257 total: repairs €491, scheduled maintenance €517, downtime €2,249. The biggest hit is downtime - over two-thirds of the total.
The supervisor gets an honest refusal and a useful alternative, not a hallucinated number. That behavior is a consequence of the architecture, not of prompt engineering.
When the server needs to know too
Client-side filtering is the right default when the MCP server is internal and the application owns user identity - which is our case, and probably yours. It is not the whole story, and the two approaches are complementary rather than competing.
Once a server is shared across teams, exposed beyond your network, or reached by clients you do not control, it can no longer take the caller’s word for anything. Then the server has to authorize as well: verify a token at both tools/list and tools/call, so a caller cannot enumerate capabilities it may not invoke. OAuth 2.0 Token Exchange with token caching is the pattern to reach for, and passing tokens through untouched between layers is both discouraged and forbidden by the specification.
The split is worth stating plainly, because it is easy to assume one replaces the other. The server decides whether a caller is allowed in at all. The client decides which capabilities a given person gets, and whether a human must approve them. A server that authorizes callers still cannot tell a supervisor from a fleet manager inside the same trusted application - that distinction only exists where the session does. Our colleague’s write-up on MCP and A2A assistant architecture goes deeper on the server-side half, including how this works when the caller is another agent.
Human-in-the-loop: putting a person in front ofevery write
Now the harder problem. create-work-order changes state in a system maintenance actually works from. An agent that can file work orders unattended is a support ticket waiting to happen.
Remember that destructiveHint = trueon the server. The client can read it back off the wire:
private static boolean isDestructive(McpSchema.Tool tool) {
    McpSchema.ToolAnnotations annotations = tool.annotations();
    if (annotations == null) {
        return true;
    }
    if (Boolean.TRUE.equals(annotations.readOnlyHint())) {
        return false;
    }
    return !Boolean.FALSE.equals(annotations.destructiveHint());
}
Note the default. A tool that declares nothing is treated as destructive. Guessing wrong in that direction costs a click; guessing wrong the other way costs a work order.
With that, the client wraps every destructive tool in a callback that parks the call instead of running it:
class ConfirmingToolCallback implements ToolCallback {

    @Override
    public String call(String toolInput) {
        var approval = registry.register(toolName, toolInput, delegate);
        return """
                {"status":"awaiting_user_approval","approvalId":"%s",\
                "note":"This action changes fleet state and has NOT been performed. \
                An approval card is now shown to the user. Tell the user what will happen \
                once they approve, and stop - do not call this tool again."}"""
                .formatted(approval.id());
    }
}
The model sees an ordinary tool with an ordinary schema, calls it as usual, and gets back a result saying the action is waiting on a human. Nothing happened on the server. The real callback is invoked from exactly one place - the approval endpoint:
@PostMapping("/api/approvals/{id}/approve")
public ResponseEntity<Map<String, Object>> approve(@PathVariable String id) {
    var approval = registry.claim(id);
    if (approval == null) {
        return ResponseEntity.notFound().build();
    }
    String result = approval.callback().call(approval.arguments());
    return ResponseEntity.ok(Map.of("status", "approved", "result", result));
}
claim removes the entry, soan approval is single-use - a second POST gets a 404.
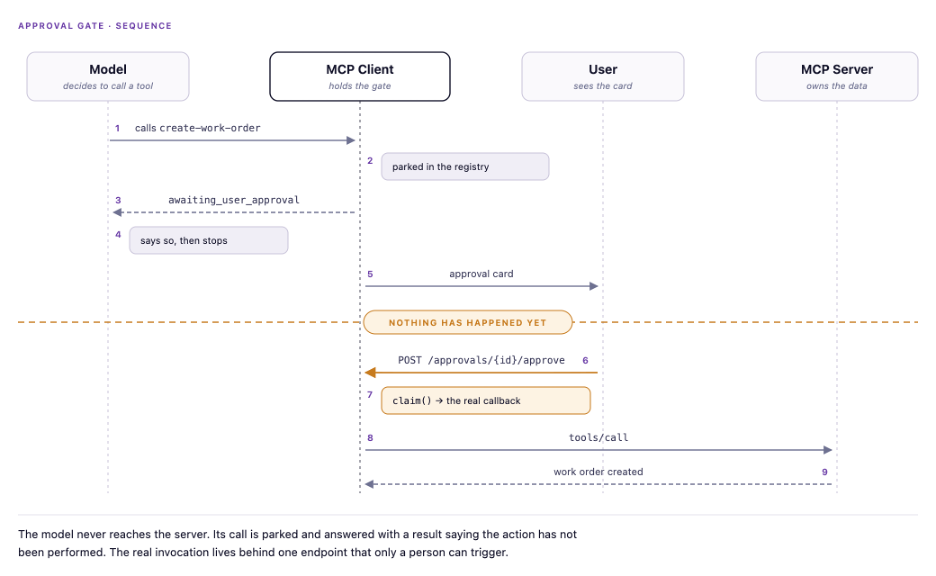
This is the part worth internalizing: the enforcement is structural, not persuasive. A common alternative is a two-step tool pair - draft-work-order then confirm-work-order - which reads nicely but guarantees nothing, because the model can call confirm immediately and no human ever saw the draft. Here the model is not asked to behave. It is not given the ability to misbehave.
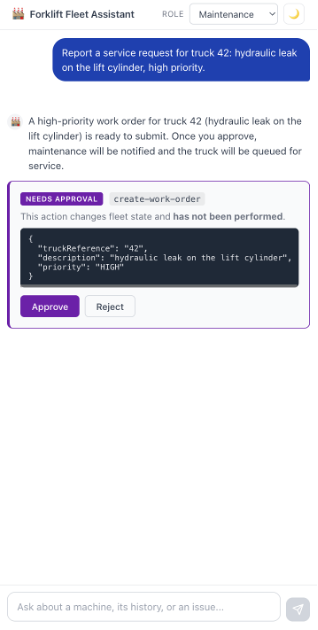
The card is polled after a turn ends rather than pushed down the response stream. Keeping approvals off the stream means the stream stays plain text and no protocol markers get embedded in prose.
What happens after Approve
There is a loose end here that most write-ups of this pattern leave dangling, so let us be explicit about it.
Our chat is stateless per turn: the controller builds a fresh prompt each request and keeps no ChatMemory, so once the model has been told “this is awaiting approval” and stopped, the conversation is over. When the user clicks Approve, the tool runs - but the model never sees the result. It does not get to say “done, that is WO-0043.”
For a demo that is a defensible trade: the write becomes visible the next time anyone asks. Approve a high-priority fault on FL-042, ask about the next shift, and FL-042 now appears among the blockers - because check-shift-readiness counts open high-priority work orders. The state is real, and the assistant reads it like any other data.
For production you have two honest options:
- Resume the tool loop. Keep the conversation and, after approval, feed the tool result back as a ToolResponseMessage so the model closes the turn itself. This is the nicer experience and the more complex plumbing - you are suspending and resuming an in-flight tool call across an HTTP round trip, which means the conversation has to be durable, not just in memory.
- Treat approval as an event. The approval endpoint runs the tool and posts a plain system message into the transcript (“WO-0043 created”). The model never resumes; the UI reports the outcome. Much less machinery, and for an operations assistant where the user is looking at the screen anyway, usually enough.
We took the second shape, minus the transcript message. Which one fits depends on whether your users approve things while watching, or hours later on a phone.
The framework-native alternative: ToolCallingAdvisor
Our gate wraps individual ToolCallback instances. Spring AI 2.0 offers a second, arguably cleaner place to put the same logic, and it landed with the release this article is built on.
In Spring AI 1.x the tool-call loop was embedded inside each ChatModel implementation. Spring AI 2.0 lifts it out into ToolCallingAdvisor, a recursive advisor in the standard ChatClient advisor chain that owns the whole iterate-call-append-resubmit cycle, regardless of model backend. It exposes four hooks - doInitializeLoop, doBeforeCall, doAfterCall and doFinalizeLoop - and the Spring AI reference documentation names an approval gate as a motivating use case for exactly these extension points.
Which should you use? The callback wrapper is simpler and travels with the tool, which suits a gate whose rule is derived from the tool’s own MCP annotation. An advisor sees the whole loop, which suits cross-cutting policy - budget caps, audit events, conditional routing between iterations, or a gate whose rule depends on conversation state rather than on the tool. If your gating logic is going to grow beyond “is this tool destructive,” start at the advisor.
The same release is worth knowing about for a reason we return to under cost: ToolSearchToolCallingAdvisor implements progressive tool disclosure, indexing the tool set once and letting the model retrieve definitions on demand instead of shipping all of them on every request.
A road not taken: MCP elicitation
MCP has a mechanism aimed at this, built into the protocol. Elicitation lets a server ask the client to collect input from the user mid-execution, and Spring AI 2.0 supports it through an @McpElicitation annotation with sync and async variants.
We did not use it, deliberately, and the reasoning is worth more than the conclusion.
With elicitation, the server initiates the question. That is a natural fit when the server needs a missing parameter. But our question is not “what value should I use?” - it is “is this person allowed to authorize this action?” That is an authorization question, and the server does not know who the user is; only the client does. Routing it through the server means the server asks a question whose answer it cannot evaluate, and the client ends up bridging elicitation to a UI anyway.
Spring AI’s own design hints at the same split: @McpElicitation is a client-side handler. The framework already assumes the client is where the user lives. Keeping the gate in the client puts the decision next to the identity it depends on. Elicitation remains the right tool for a different job - a server that genuinely needs to prompt for a value it cannot infer.
Production: what to fix before you ship
Secure the server, but know what that does not cover. Our MCP server is open. In production, secure /mcp with OAuth 2.0 - the MCP specification supports standard HTTP authentication and Spring Security protects it like any REST API. Note the division of labor this article has been building toward: the server authenticates callers, while role-based capability and human approval belong to the client, where user identity lives.
The gate is only as strong as the endpoint in front of it. This is the most important thing to fix before anyone ships this pattern. In the demo, the approve endpoint has no authentication, and approval ids are sequential (APR-1, APR-2), so guessing one is trivial. A gate that any unauthenticated caller can open is theater. Three changes make it real:
- Authorize the approve endpoint against the same role model that handed out the tool in the first place - a role that may not call create-work-order must not be able to approve one.
- Use opaque ids.
- Give parked approvals a TTL, so a card nobody clicked does not sit in memory until someone finds it.
A lenient parse must fall back to the least privileged role. Our role resolver accepts an unknown or missing role rather than failing the request, which keeps the demo forgiving - but it falls back to SUPERVISOR, and supervisor holds create-work-order. In a real deployment that fallback belongs on the most restricted role you have, or on rejecting the request outright. The general rule: lenient parsing and privileged defaults do not belong in the same method.
Do not trust tool names to survive the trip. Spring AI qualifies MCP tool names with the connection name and normalizes separators, so get-active-sessions arrives client-side as something like fleet_server_get_active_sessions. An allowlist written against the server’s names silently matches nothing. Resolve the names you get back from listTools() rather than parsing them by hand. We got lucky: the mismatch failed closed, and every role ended up with zero tools - loud and obvious. It could as easily have failed open.
Tool input validation is on by default in MCP SDK 2.0. Tool inputs are validated against the declared JSON schema, and a failure comes back as a tool result with isError=true rather than an exception. You can opt out, but the default is the one you want.
Watch the quiet half of the Jackson 3 upgrade. Spring Boot 4 moves Jackson to the tools.jackson.* package, which fails at compile time - you fix it and move on. What does not announce itself is that Jackson 3 also changed date serialization and property ordering defaults, so your JSON can change shape silently. Diff your serialized output before and after.
Model choice is a design parameter, not a config value. We developed against claude-haiku-4-5 - fast and cheap, and every tool call routed correctly. What it did not do reliably was the last mile: reading a signed engine-hour value the right way round, keeping truck ids straight across a nine-truck list, holding a numeric breakdown together in prose. The screenshots in this article were captured on Sonnet.
Two lessons. First, “the model calls the right tool” and “the model reports the result correctly” are separate problems with separate fixes - the first is tool descriptions, the second is model capability. Second, budget for it: nine tool definitions ship in every request, so the tool schemas are a fixed input cost on every turn, and trimming the tool set per role is a cost optimization as well as a security one. At larger tool counts this stops being a rounding error - the Spring team cites 10–21K tokens per request for big MCP setups, which is what progressive tool disclosure exists to address.
Watch your units in prose. Our first version reported service overruns in mth - standard shorthand for motohours in the industry. The model read it as “months” and told a supervisor a truck was 25 months overdue. Abbreviations that are unambiguous in your domain are not unambiguous to a model writing English.
Testing. The demo ships without tests, which we would not repeat. Two layers are worth having, and neither needs an LLM in the loop:
- Domain logic first. blockingReason and hoursUntilDue are pure functions and carry the business rules that matter - test them like any other code.
- Then the protocol surface. Point an McpSyncClient at the running server, assert that listTools() advertises what you expect and that readOnlyHint / destructiveHint are set correctly on every tool. That second test is what stops a new tool from silently arriving without annotations - or worse, arriving with a wrong annotation and skipping the gate.
For the broader picture of taking an assistant like this from prototype to something on-call, see our write-up on building a production-ready AI assistant.
Beyond forklifts: what this pattern unlocks
The warehouse fleet is a template. We opened with a table of four domains; here is what each looks like in practice - and in every case the interesting question has the same shape as the supervisor’s: it needs a join, and a human is accountable for the write.
After-sales and dealer portals. “Which spare part fits this truck’s mast assembly?” Wrap the parts catalog as MCP tools and dealers get an assistant instead of a folder of PDFs. The join here is compatibility across model year, configuration and supersession chains - precisely what a search box cannot do. The write to gate is placing the order.
Production quality. “Show the defect rate for assembly line 3 this week, and whether it tracks the new supplier batch.” MES data as tools, the recurring quality report as a prompt. The join is defect data against batch genealogy against shift. The write to gate is stopping the line.
Plant maintenance. The engine-hours pattern transfers directly to presses, conveyors and CNC machines: cycle counts and spindle hours instead of motohours, the same lesson that a calendar-based service queue is quietly wrong. The write to gate is scheduling downtime on a machine somebody else is running.
Supply chain. “What is the lead time for component Y from supplier Z, and does it clear the build slot in week 14?” Tools over procurement, joined against the production plan. The write to gate is committing a purchase order.
Your existing Spring Boot services become AI-accessible without a rewrite: you add annotations to methods that already exist. And one MCP server can serve several clients - a chat UI, a mobile app, a monitoring agent - each applying its own role filter and its own approval policy, because those live on the client side.
It is also the path to agentic workflows. Once tools are exposed over MCP, an agent can chain them: check the maintenance queue → find overdue trucks → raise work orders → notify maintenance. Note that the third step is exactly the one our approval gate guards, and that the gate keeps working when the caller is an agent rather than a person. Capability boundaries you build now are the ones that hold when the loop closes. Our piece on going from chatbot to AI assistant with MCP and A2A picks up where this one stops, at agent-to-agent coordination.
Conclusion: AI-enabled operations in 2026
We built an AI assistant for a warehouse fleet on Spring Boot 4, Spring AI 2.0 and Model Context Protocol:
- An MCP server exposing nine tools, two resources and two prompts over Streamable HTTP, with read-only and destructive tools declared as such
- An MCP client that filters tools by role and parks destructive calls behind a human approval gate
- A chat UI with streamed responses, a role picker and approval cards.
Three ideas are worth taking away, and only the first is about MCP:
- Expose the data, not the answers. The supervisor’s most valuable question - do I have enough trucks? - was never on anyone’s dashboard, because it lives in the join between four systems. You cannot anticipate those questions. You can make the pieces reachable.
- Let the server describe, and the client decide. The server says a tool is destructive. The client, which knows who is asking, decides whether a human must approve it. Neither needs the other’s context.
- Structure beats instruction. A capability the model does not have cannot be prompted into existence. That is a stronger guarantee than any system prompt, and it costs less to maintain.
FAQ
What is Model Context Protocol (MCP)?
MCP is an open protocol that standardizes how AI applications connect to external data sources and tools. An MCP server exposes data and operations as tools, resources and prompts; an MCP client discovers them at runtime and lets a language model invoke them. It replaces per-system integration glue with one shared contract - roughly what REST did for service communication.
How do I connect an LLM to my manufacturing or ERP data without rewriting my systems?
Expose the services you already have as MCP tools. In Spring Boot that means annotating existing methods with @McpTool and describing what they do in plain language; the underlying implementation can stay whatever it is - JPA repositories, REST calls to your MES, a fleet management API. The model discovers the tools and calls them. No data migration and no new platform.
Do I need Spring Boot 4 to use Spring AI 2.0?
Yes. Spring AI 2.0 has a Spring Boot 4 / Spring Framework 7 baseline and will not load in a 3.x context. It is one upgrade decision rather than two, which in practice makes it easier to justify. Spring Boot 4.1 needs Java 17 or later and supports up to Java 26. Note that Spring Boot 3.5 and Spring Framework 6.2 reached end of life on June 30, 2026.
Tools, resources or prompts - how do I choose?
By who initiates. A tool is called by the model, autonomously, usually with parameters - use it when the answer depends on what the user asked. A resource is pulled by the application as a snapshot to display or inject into context. A prompt is chosen deliberately by a user, as a template for a recurring workflow such as a shift handover or a compliance review. If you are unsure, ask who decides that it runs.
How do I stop an AI agent from executing a destructive action without a human?
Do not ask it to wait - remove its ability to proceed. Have the server declare the tool with destructiveHint = true, and have the client wrap such tools in a callback that registers the call and returns “awaiting approval” instead of executing. The real invocation then happens in one place, behind an authorized endpoint. A two-step draft/confirm tool pair looks similar and guarantees nothing, because the model can call confirm itself.
How do I scope MCP tools per user role in Spring AI?
Filter the tool set per request, not the data fields. Resolve the caller’s role from your identity provider, map it to a set of permitted tool names, and pass only those tools into the request. A capability that is absent from the model’s context cannot be argued into existence; a redacted field is a negotiation you have invited the model into. Note that Spring AI qualifies MCP tool names with the connection name, so resolve names from listTools() rather than hardcoding the server’s spelling.
STDIO or Streamable HTTP?
STDIO for local and CLI tools that the host launches as a subprocess. Streamable HTTP for anything deployed as a service, which is the usual enterprise case - it is a normal HTTP endpoint you can secure, load-balance and monitor like any other.
Is MCP ready for enterprise use?
The protocol and the Java SDK are stable enough to build on, and the transport is ordinary HTTP that your existing security stack already understands. The 2026-07-28 revision pushed further in that direction with a stateless core and hardened OAuth alignment. What needs deliberate design is the split this article argues for: the server authenticates callers, while the client owns user identity, capability filtering and approval. Get that boundary wrong and no amount of protocol maturity helps.
Can one MCP server serve more than one AI application?
Yes, and it is one of the main reasons to build one. The server exposes capabilities and declares what each one is; each client applies its own role filter and approval policy. A chat UI, a mobile app and an autonomous agent can share a server while granting very different things.
What does an MCP integration cost to run?
The dominant recurring cost is tokens, and tool definitions are a fixed input cost on every turn - nine tools in this demo, but large MCP setups can spend 10–21K tokens per request on schemas alone. Trimming the tool set per role reduces that as a side effect of the security model. Spring AI 2.0’s progressive tool disclosure addresses the same problem directly through progressive tool disclosure. Model choice matters too: a cheaper model may route tool calls correctly and still garble the numbers in its prose.

How to scope a legacy system rewrite
When part of a legacy system needs a rewrite, the first question sounds simple: which code is in scope? In a tightly coupled, multi-language platform, the honest answer is often that the boundary does not exist in the code at all - not in the directory tree, and not in the call graph.
In short: to scope a partial rewrite of a polyglot legacy system, you can rebuild the requirements of the whole platform from the code up - split into subprojects, extract dependencies, generate use cases, user stories, group those into epics - and draw the boundary at the epic level, where it actually exists.
This is how we did exactly that for a long-lived airline operations platform: 3,985 files, ten programming languages (one of them proprietary), and a client request to rewrite one operational capability in C# while everything else stayed where it was. Answering "what is in scope?" took 9,242 use cases and 189 epics.
The challenge: rewriting one part of a ten-language platform
A client asked us to rewrite one part of their platform on a modern stack with C#: one operational capability of a tightly coupled ten-language system, one of those languages proprietary. Everything else was to stay in place. Before anyone could estimate the rewrite, we had to establish which code and logic belong to that part. That is the core scoping problem of every partial legacy modernization: the product boundary the business talks about has no counterpart in the codebase.
The system: 1.2 million lines across ten languages
The platform is a long-lived operations system from the airline industry, grown over two decades.
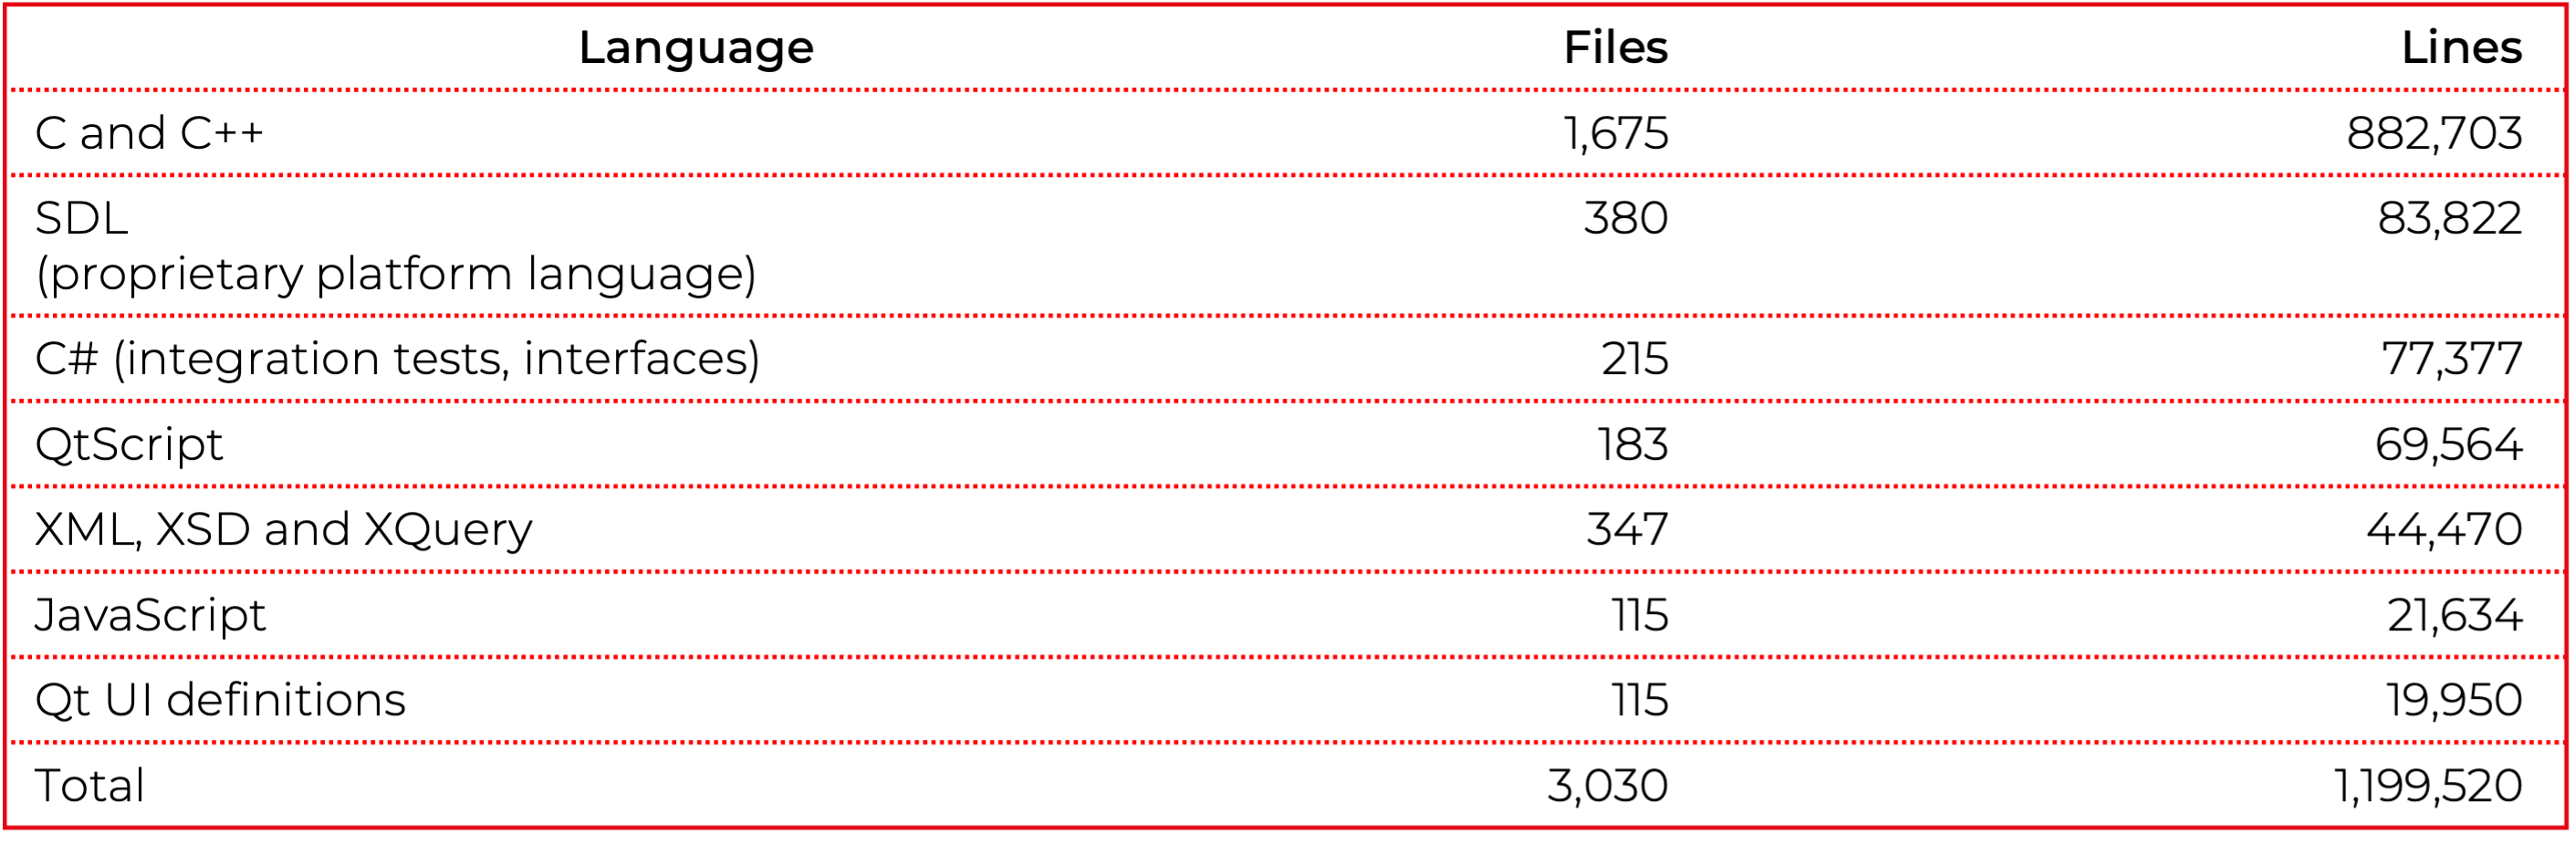
The remaining languages are Java, XSLT, Python, shell and batch, a handful of files each. The rest of the tree is build scripts, resources and project metadata.
The proprietary language problem
The proprietary platform language was a major complication. That language is the platform's own, designed in-house in the late 1990s and never released. Even its three-letter name is taken: every search for it lands on better-known languages that share the acronym. There is no tooling for it you can install - no parser, no static analyzer, no IDE support.
It is the data definition language of the platform's in-memory real-time object database. It declares the persistent structures, their keys, their access rights and their replication behavior. Validators and cross-field consistency rules are first-class constructs, attached to fields rather than called. Functions, events and a bridge into C++ sit on top. All of those can sit in a single file, in labeled blocks.
Why the boundary of a legacy module is not in the code
Cutting by directory would not work. The part we were asked to extract is spread across languages and across directories at different levels: C++ in the core, the proprietary language in the data and rule definitions, QtScript and JavaScript in several different clients, C# in the tests, and XML files that look like configuration but carry logic. Much of the logic is also written as declarations rather than as calls. Analyzing the C++ gives you a graph of the C++, and the edges that matter are often not calls at all. The boundary was not in the file system and not in the call graph. It was one level up, in the requirements. That meant building the requirements for the whole platform first, from the code up, and cutting after that.
How to rebuild requirements from legacy code
The analysis was done in G.Tx, our in-house modernization platform, as workflows chaining fixed LLM prompts and autonomous agents with the tool's built-in code-analysis functions. Every step has a defined input and a defined output, so its results can be evaluated on their own before the next step runs.
We started with a small batch of files to see whether the approach worked before committing to it. Extracting the dependencies was the hard part, and whatever came out had to be checked. The C# integration tests gave us a way to do that. They let us confirm what we had extracted, and at the same time hand the model something legacy code rarely contains: a statement of what the code is meant to do. The bridges between the languages had to be found separately - they sit at a small number of explicit registration points.
Then the same steps ran over all files. Classification came first, filtering out build metadata, tooling and resources. Each language brought its own difficulties and needed its own way in, so we split the monolith into separate subprojects. Bringing those back together into a single dependency graph gave us a view of the whole system. Directories became modules, and the system revealed its full structure. The result was the technical documentation the platform never had, describing its architecture, data model and integration points.
From there we generated use cases and deduplicated them because of the logic shared across modules, then turned them into user stories and epics across 8 domains. Every user story was written with its full context behind it, down to the use cases it came from and the files those were derived from.
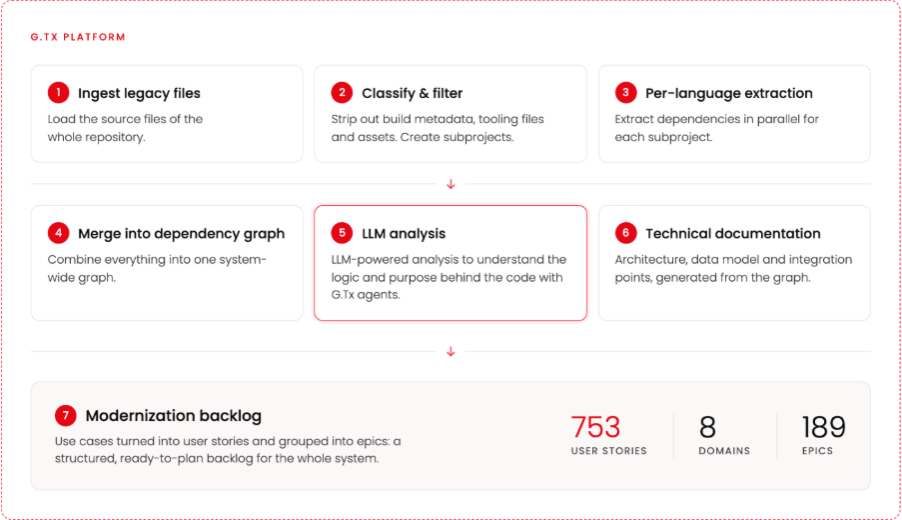
From these requirements we composed a business requirements document setting out what the system has to do, function by function, without saying how any of it is implemented.
Drawing the migration boundary at the epic level
Only now is there something to cut. 48 of the 189 epics were tagged as in scope, covering 251 user stories. We had the requirements of that part of the system and its code as one set. The in-scope stories were then estimated for implementing them again from scratch in C#, on the new platform.
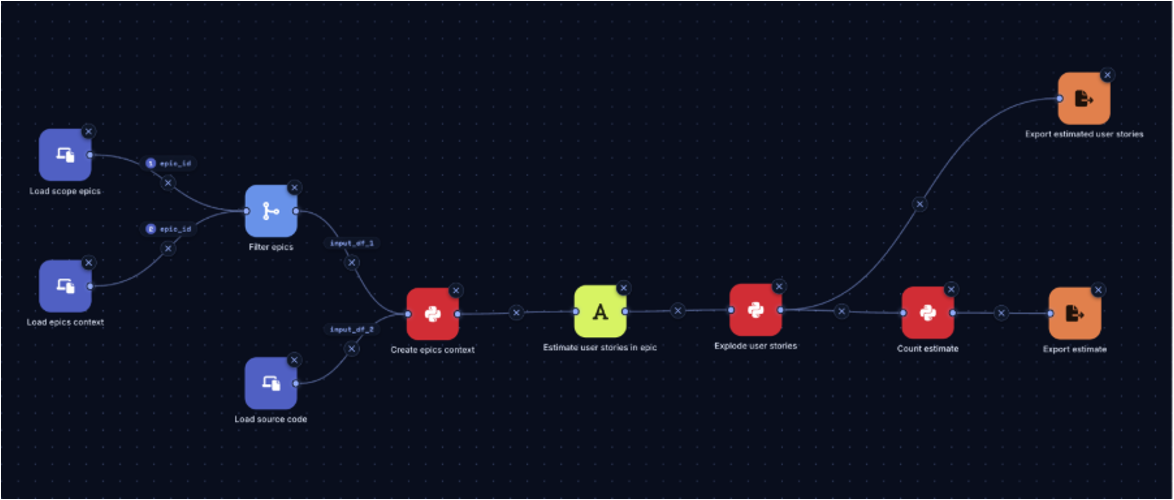
That made a full migration analysis possible, and a plan for carrying it out. The plan groups the technical requirements into ordered stages. Each stage states its scope, what it leaves behind for the next one, and how many developers can work on it at the same time. The early stages are close to sequential because everything depends on the infrastructure. For the later stages, the plan specifies how many developers can work in parallel across the uncoupled parts.
Why modernization projects fail before the rewrite begins
Modernization programs rarely fail at the rewrite itself. They fail earlier, at assessment and scoping - analysts list incomplete understanding of the current system among the main reasons these programs stall. In a polyglot system, the tooling to analyze dependencies across language boundaries may simply not exist. Most analyzers stop at the edge of their own language, and a proprietary language has no analyzer at all. You can approach the boundary from the business side instead. Rebuild what the whole system does as requirements, and the boundary of the product can be drawn at the level where it actually exists. That work is not thrown away afterwards: it shows where the product sits within the whole platform, and it makes a solid base for carving out the next one. Every story carries its trace: the use cases it came from and the files those were derived from. An estimate built this way can be followed down to the code it covers, and that trace is where the confidence in the numbers comes from.
Agents did not replace that structure - they worked inside it. Dropped into the whole repository, an agent can miss the less obvious dependencies, and no one can realistically audit what it read. Classified first and split into subprojects, the same agent works in a context small enough to check, and every step of the workflow can be evaluated on its own.
Key lessons
- Scope can be decided at the requirements level, not the code level. In a single-language system the distinction is academic: you approximate the boundary with a dependency graph and clean it up by hand. Here the approximation did not exist, and not only because of missing tooling. Some legacy constructs, like a rule declared on a database field, are invisible to any analysis that follows calls.
- Mix deterministic chains with autonomous agents. The classification and the split into subprojects came first for a reason. They narrowed the context far enough that an agent working inside one small subproject could be trusted. A second chain then generated the epics over the files those steps had already isolated, which is what makes the coverage of the whole system credible rather than merely broad.
- Traceability is the core of confidence in AI-generated analysis. Every number in the migration plan can be followed from epic to user story to use case to source file. With that chain, the result and the reasoning behind every estimate can be validated.
FAQ
How do you find what's in scope in a multi-language system that is hard to analyze?
The scope of one capability can be spread across languages, directories and declaration-based logic that no call-graph analysis can see. Rebuild the system's requirements from the code - use cases, user stories, epics - and select the epics that belong to the capability. The in-scope code is whatever those epics trace back to.
Why can't a dependency graph define the boundary of a legacy module?
Sometimes it can, but with this many languages the chances drop fast: legacy systems can use languages that have no analysis tooling at all, let alone tooling able to resolve dependencies into the other languages. Additionally, some legacy constructs stay unresolvable for these tools. In our case the edges that mattered were often not calls at all.
Can a single large-context AI agent analyze a legacy codebase on its own?
Not reliably at this scale. A bigger context window is not the same as understanding: dropped into a whole repository, a single agent can miss less obvious dependencies, and is hard to be audited step by step. Breaking the work into steps and splitting the system into subprojects gives you control over the coverage and lets you set up pass gates.

From chatbot to AI assistant: Building with MCP and A2A in 2026
Front note: This draft reflects A2A v1.0.1 and MCP 2025-11-25. Be aware of new versions available when reading this text.
Once upon a time, I had a presentation entitled “From Chatbot to AI Assistant”. It opened with an explanation of what this whole AI thing was about, followed by a funny (I believe) meme with Despicable Me’s Gru and boards that read: “we use state of the art frameworks, we follow official docs, we kill the application”. The central idea was a small diagram – request, look for data, answer – that gradually evolved into several modern AI-assistant architectures.
Well… the AI world moves at breakneck speed these days.
So, let me ask the same question again – how do you turn a simple chatbot into a useful AI assistant in mid-2026, and more importantly – why is last year’s approach already so outdated? A production assistant still depends on explicit orchestration, shared contracts, security boundaries, resilience and end-to-end observability. The answer boils down to two acronyms: MCP and A2A. Both have changed the default approach by standardizing two different seams in an agentic system.
New protocols: MCP and A2A explained
A year ago, there was no standard to organize agents, so every team tried to do it their own way. Plenty of solid assistants were built in those days, and many of them still serve customers to this day. Then, one day, the world went crazy about MCP (to be fair, the first version had been released even earlier). Model Context Protocol is a way to provide context for the model. The idea behind it is to unify tool calling and automate the provisioning of system prompts. The latter isn’t very useful, as you can use prompt management tools like Langfuse with staging tags instead, or any other system that fits your organization. Tool calling, on the other hand, used to be a nightmare. You, the developer, had to organize tool management (best case with live updates), parse LLM responses, extract parameters, pass them to tools and handle the loop back. There was a core “if” in the middle of the application to distinguish between an LLM answer to the user and an LLM request to execute some action or collect some data. With MCP, all you need to do is to provide the MCP server’s URL and then go grab a coffee while the work takes care of itself – the server maintainer takes care of tool descriptions and updates, and the SDK calls tools under the hood (I’ll return to this point in a moment).
Another new standard is the Agent-to-Agent protocol (A2A) – a standardized way for one agent to call another – complete with agent discovery, long polling, asynchronous responses, authorization and input requests, and streaming. A2A is a good fit when the remote component is an autonomous system that reasons, plans, maintains state, performs a multi-step task, or is owned and deployed independently. With A2A you can spin up an endless web of agents – each of them can call “something,” and this “something” might be another agent that could call the next one, which calls another, and another, and another…
Freedom! And you can create an assistant in a few hours!
But freedom never comes for free.
The first catch is the SDK-driven MCP tool calling mentioned above. When the LLM decides to call a tool, the entire request-response loop is executed automatically. It’s fast to develop, but there are three major drawbacks.
- The monitoring capabilities are limited – OTel auto-instrumentation is the only way to see your tool calls in Langfuse, and you cannot really tweak the spans
- You don’t control the request – if the LLM hallucinates, you can’t stop it. If the model has no access to some metadata (PII, for example), it won’t attach it.
- You don’t process the response – if the tool returns extra information beyond the response itself (like a link to the source of the data), you need to rely on the LLM to process that metadata.
The second catch is A2A’s freedom. It’s the REST of the 21st century. With REST, you can cook up an endless spaghetti of services, but that doesn’t mean you should. With agents, it’s much easier to create an agent loop or exceed any acceptable response time than with regular services, so you need to design your application’s architecture with care.
New architecture: A three-layer MCP + A2A assistant
Let me ask one more time: how do you convert a simple chatbot into a useful AI assistant? The answer is: with MCP and A2A, but you need to use them wisely.
My proposal is a three-layer, tree-like structure – one or more entry-point agents that call working agents, which in turn call MCP servers with tools.
.png)
Bear in mind that this system can NOT work sequentially. All master agent LLM calls (see below), LLM-based agents and tool executions can take many seconds, so pay close attention to asynchronous processing in your application.
Master agent: The A2A entry-point
The first layer contains user-facing AI assistants – end-user exposed backend applications with simple REST/SSE endpoints to conduct conversations. As a rule, start with a single entry-point and make it flexible enough for different kinds of users; further down the line, however, it’s common to spin up more for specific use cases.
A master agent is an A2A client. It picks an agent and handles communication. But this is just the beginning. The core responsibility is to drive the conversation:
- execute named entity recognition (NER) to compute metadata from prompts,
- all multiple agents in parallel and verify the responses,
- react to “input-required” responses from agents and collect the required information using metadata or other agents,
- handle small talk on its own,
- verify requests and responses based on pre-defined rules,
- handle the tone and language of the conversation,
- produce intermediate messages like “I’m collecting data about your profile now”,
- implement circuit-breaker functionality so it never waits too long for hanging agents.
It also takes care of the technical side of things:
- enforce role-based access control
- send notifications for asynchronous responses
- prepare rich responses with all data returned from agents (media, closed-questions controllers, forms, etc.).
Working agents: Scaling out with A2A servers
The agent layer is how the system scales out. One team could own the entry-point, and then multiple teams might provide new agents to extend the system. Unfortunately, A2A is very flexible, so to keep the system maintainable and extensible in the long run, you need to lay down stricter requirements of your own. The schema of the DataPart field is key – there is no technical way to keep it consistent, so you need to enforce a company rule for that. You therefore need a common metadata schema across the system, so that one team doesn’t call the same piece of data “vehicle” while another calls it “model” and a third “vehicleModel” or even “vehicle_model”. You can start with an A2A extension covering:
- schema versions, required fields and compatibility rules;
- field names, meaning, units, locale and timestamp conventions;
- provenance and confidence for inferred or retrieved values;
- data classification, PII handling and redaction requirements;
- error categories and partial-result semantics; and
- conformance tests that every agent must pass before registration.
But at the end of the day, you need to validate the profile, as there is no enforcement in the protocol so far.
Keeping the metadata schema consistent lets every agent manage metadata, not just the entry-point – which comes in handy when a more specialized agent can recognize or obtain extra data that the whole assistant can put to use.
Building agents is usually very simple. It’s just an LLM-based application wrapped as an A2A server, with a prompt, an MCP integration and a bit of extra code to utilize all features of A2A – for example to send execution statuses (“planning”, “collecting data”, etc.) or rich responses. This approach significantly speeds up development and reduces the complexity of system components.
One caveat about the architecture. The diagram above shows a nice and clean one, but you never know when some team will slip agent-to-agent communication under the hood. That’s why you need a clock-based circuit breaker on the entry-point to avoid infinite (or merely very long) loops.
Tools: Wrapping capabilities in MCP servers
The MCP hype is sky-high these days. Everyone wants to wrap every available tool in an MCP server to make it AI-ready. That’s great, but “AI-ready”should not mean “placed behind a protocol without governance”.
SDK limitations: Using MCP structured content
Like A2A’s DataPart, MCP can return structuredContent instead of a plain-text response and carry more than words. By default, MCP-wrapped tools return plain text for LLMs, but there is usually far more worth returning, like discovered metadata or rich elements to show the customer (a document preview or a link). To make use of MCP’s structuredContent, you need to step back to the agents and replace the SDK-based MCP integration with custom code. There are two options. You can list the tools manually, build the LLM’s “tool calling” feature yourself and then execute the MCP calls on your own, or you can stand up MCP proxies alongside the agents. Then, when the LLM decides to call an MCP tool, the SDK hits a localhost server running inside the same process of the same application, and that proxy server calls the real, remote MCP. The proxy’s role is to enrich the request with authorization or metadata the LLM cannot handle (for consistency or legal reasons) and to deal with any extra fields that come back – forwarding them to the master agent, for example.
RBAC: Access control for MCP tools
The second challenge is access control. Usually, new agents with a limited set of capabilities can be protected in binary fashion – either a user has access or they don’t. But when it comes to existing REST-based services – with their sprawling capabilities, complex data classification and high-impact actions – nobody in their right mind would hand an LLM the keys.
But there is no need to reinvent the wheel here. You can simply add a custom header to MCP calls and verify user permissions at two points – when listing tools and when executing them. For that I recommend OAuth 2.0 Token Exchange with token caching, but if you would rather avoid extra round trips to the IdP, you might consider passing tokens through as-is between layers (strongly discouraged, and in fact forbidden by MCP, but still common).
Monitoring: Observability with Langfuse and OpenTelemetry
One of the nicest things about a monolithic agentic application, such as one built with LangGraph, is how observable the flow is. Being able to see the application’s steps as a diagram or a Gantt chart – and to debug every agent and tool in one place – is worth its weight in gold.
With a multi-layer, multi-agent, multi-tool application you can achieve the same, but it takes some discipline. Each component should have its own Langfuse integration and report new observations against the parent observation. That means every component calling a downstream one has to pass its own observation ID as metadata on the request to the other application. Keep an eye on clock synchronization between your servers, and voilà! Every single trace in Langfuse then tells the whole story of what happened, neatly laid out.
Unfortunately, so far Langfuse offers no mechanism to grant write-only access, so you end up spreading a key with far too many permissions across your application, but this issue is already under discussion and hopefully will be fixed soon. In the meantime, you can restrict the key to POST requests only, at the network layer of your infrastructure.
Also, MCP is becoming more aware of the issue. The new version 2026-07-28 documents traceparent, tracestate and baggage propagation in request metadata, allowing a tool call to appear in one OpenTelemetry-compatible trace, but it is still a release candidate, so this article is based on the previous version.
Demo: A multi-agent AI assistant in action
The demo project contains six agents and fourteen MCP servers. The topology is deliberately broad enough to show how independently owned capabilities can be composed behind one conversational entry point.
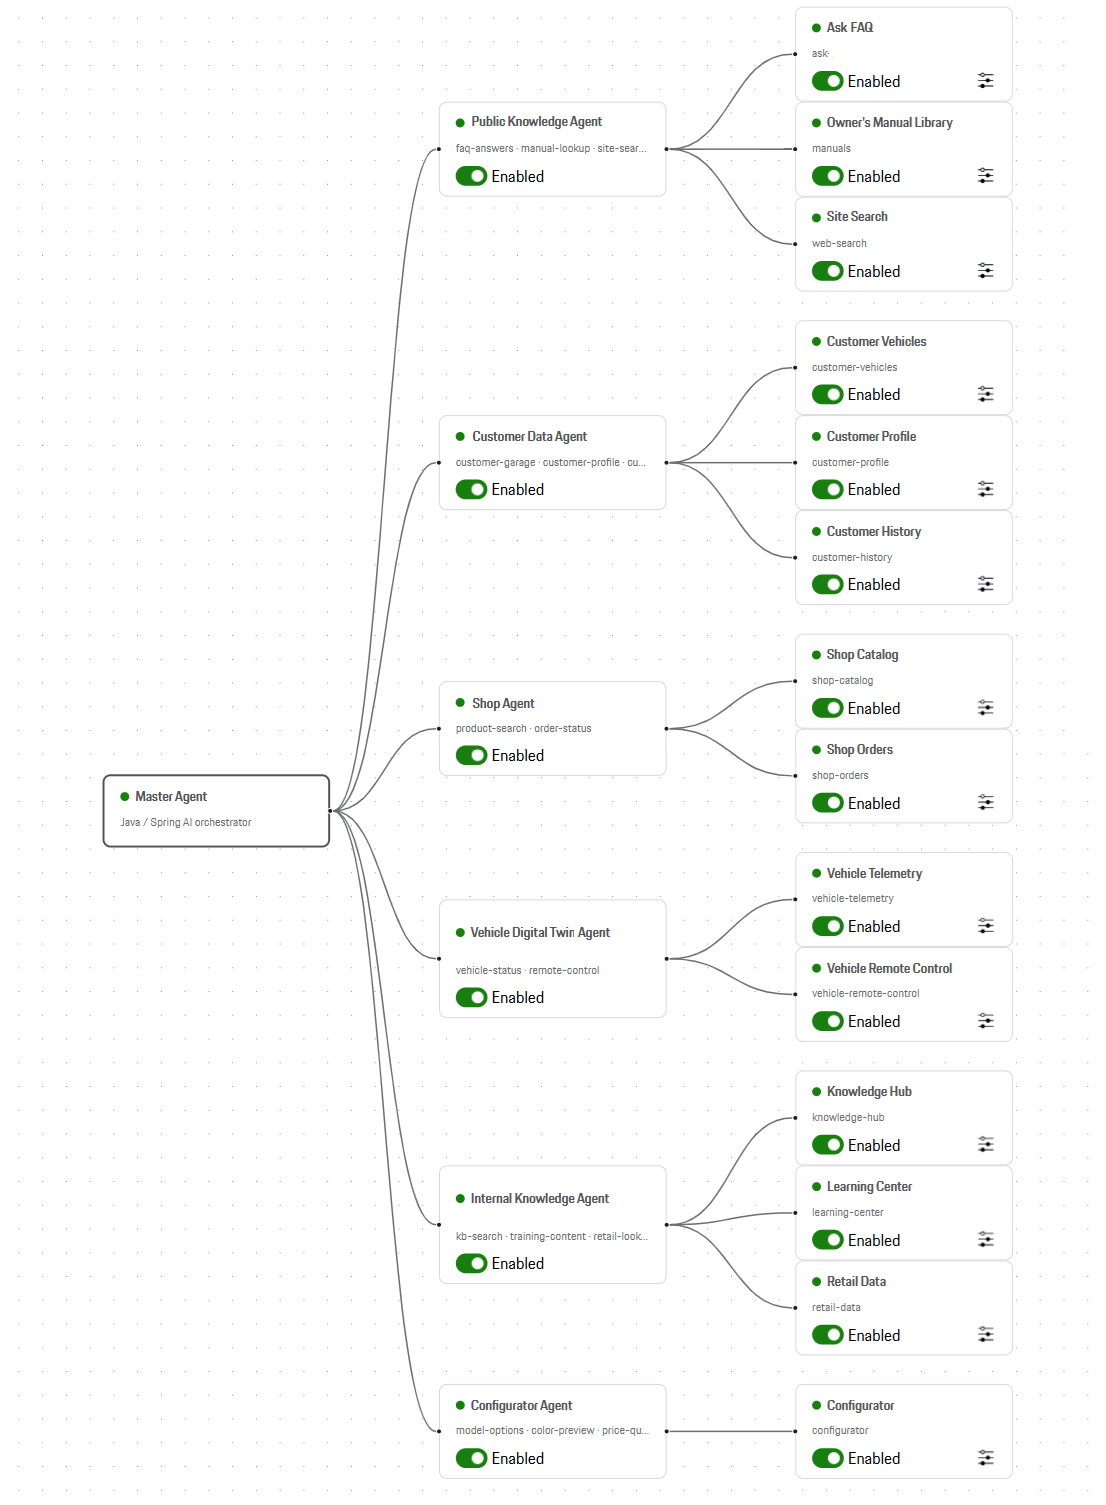
The interface uses the Porsche Design System, so for the purposes of the demo I call it the Porsche Assistant. All data sources aremocked and no Porsche data was used. The demo is an architecture demonstrator, not a production product.
Consider the question: “How do I change the battery in my car’s remote control?”
Please note important elements of the screenshot. The assistant has done a lot of work to understand the question, plan how to solve my issue, collect data from my profile, discover what car I have, look for the manual for it, and even cross-check the answer against an internal knowledge base. The panel labeled “Thinking” in the screenshot is better understood as an execution-progress view: it shows observable system activity, not the model’s private chain of thought. The answer is not very useful due to generated in-place tool responses in my demo, but some mocked resources are still returned to address my question.
The flow is better visible in Langfuse as an animation of all components running.
Because the first-choice agent returned a weak, unsatisfactory answer, the system slowed down a little – but that is exactly what shows it can recover from poor agent responses at the cost of time, and it puts the reasoning-based circuit breaker on display, calling off the hunt for the perfect answer once it is clear there isn’t one.
The demo proves that both MCP and A2A can transfer rich responses and that with a well-designed entry point, you can implement a “thinking” process built on your own data and your own capabilities. You can not only connect data sources but also execute actions, e.g., schedule a service appointment, order a gadget from the company shop, configure a new car, or unlock your own car through the same API the mobile app uses.
Further steps: Evaluation and load testing
A convincing demo should be followed by a small evaluation and load-testing program. At minimum, I would track the following metrics:
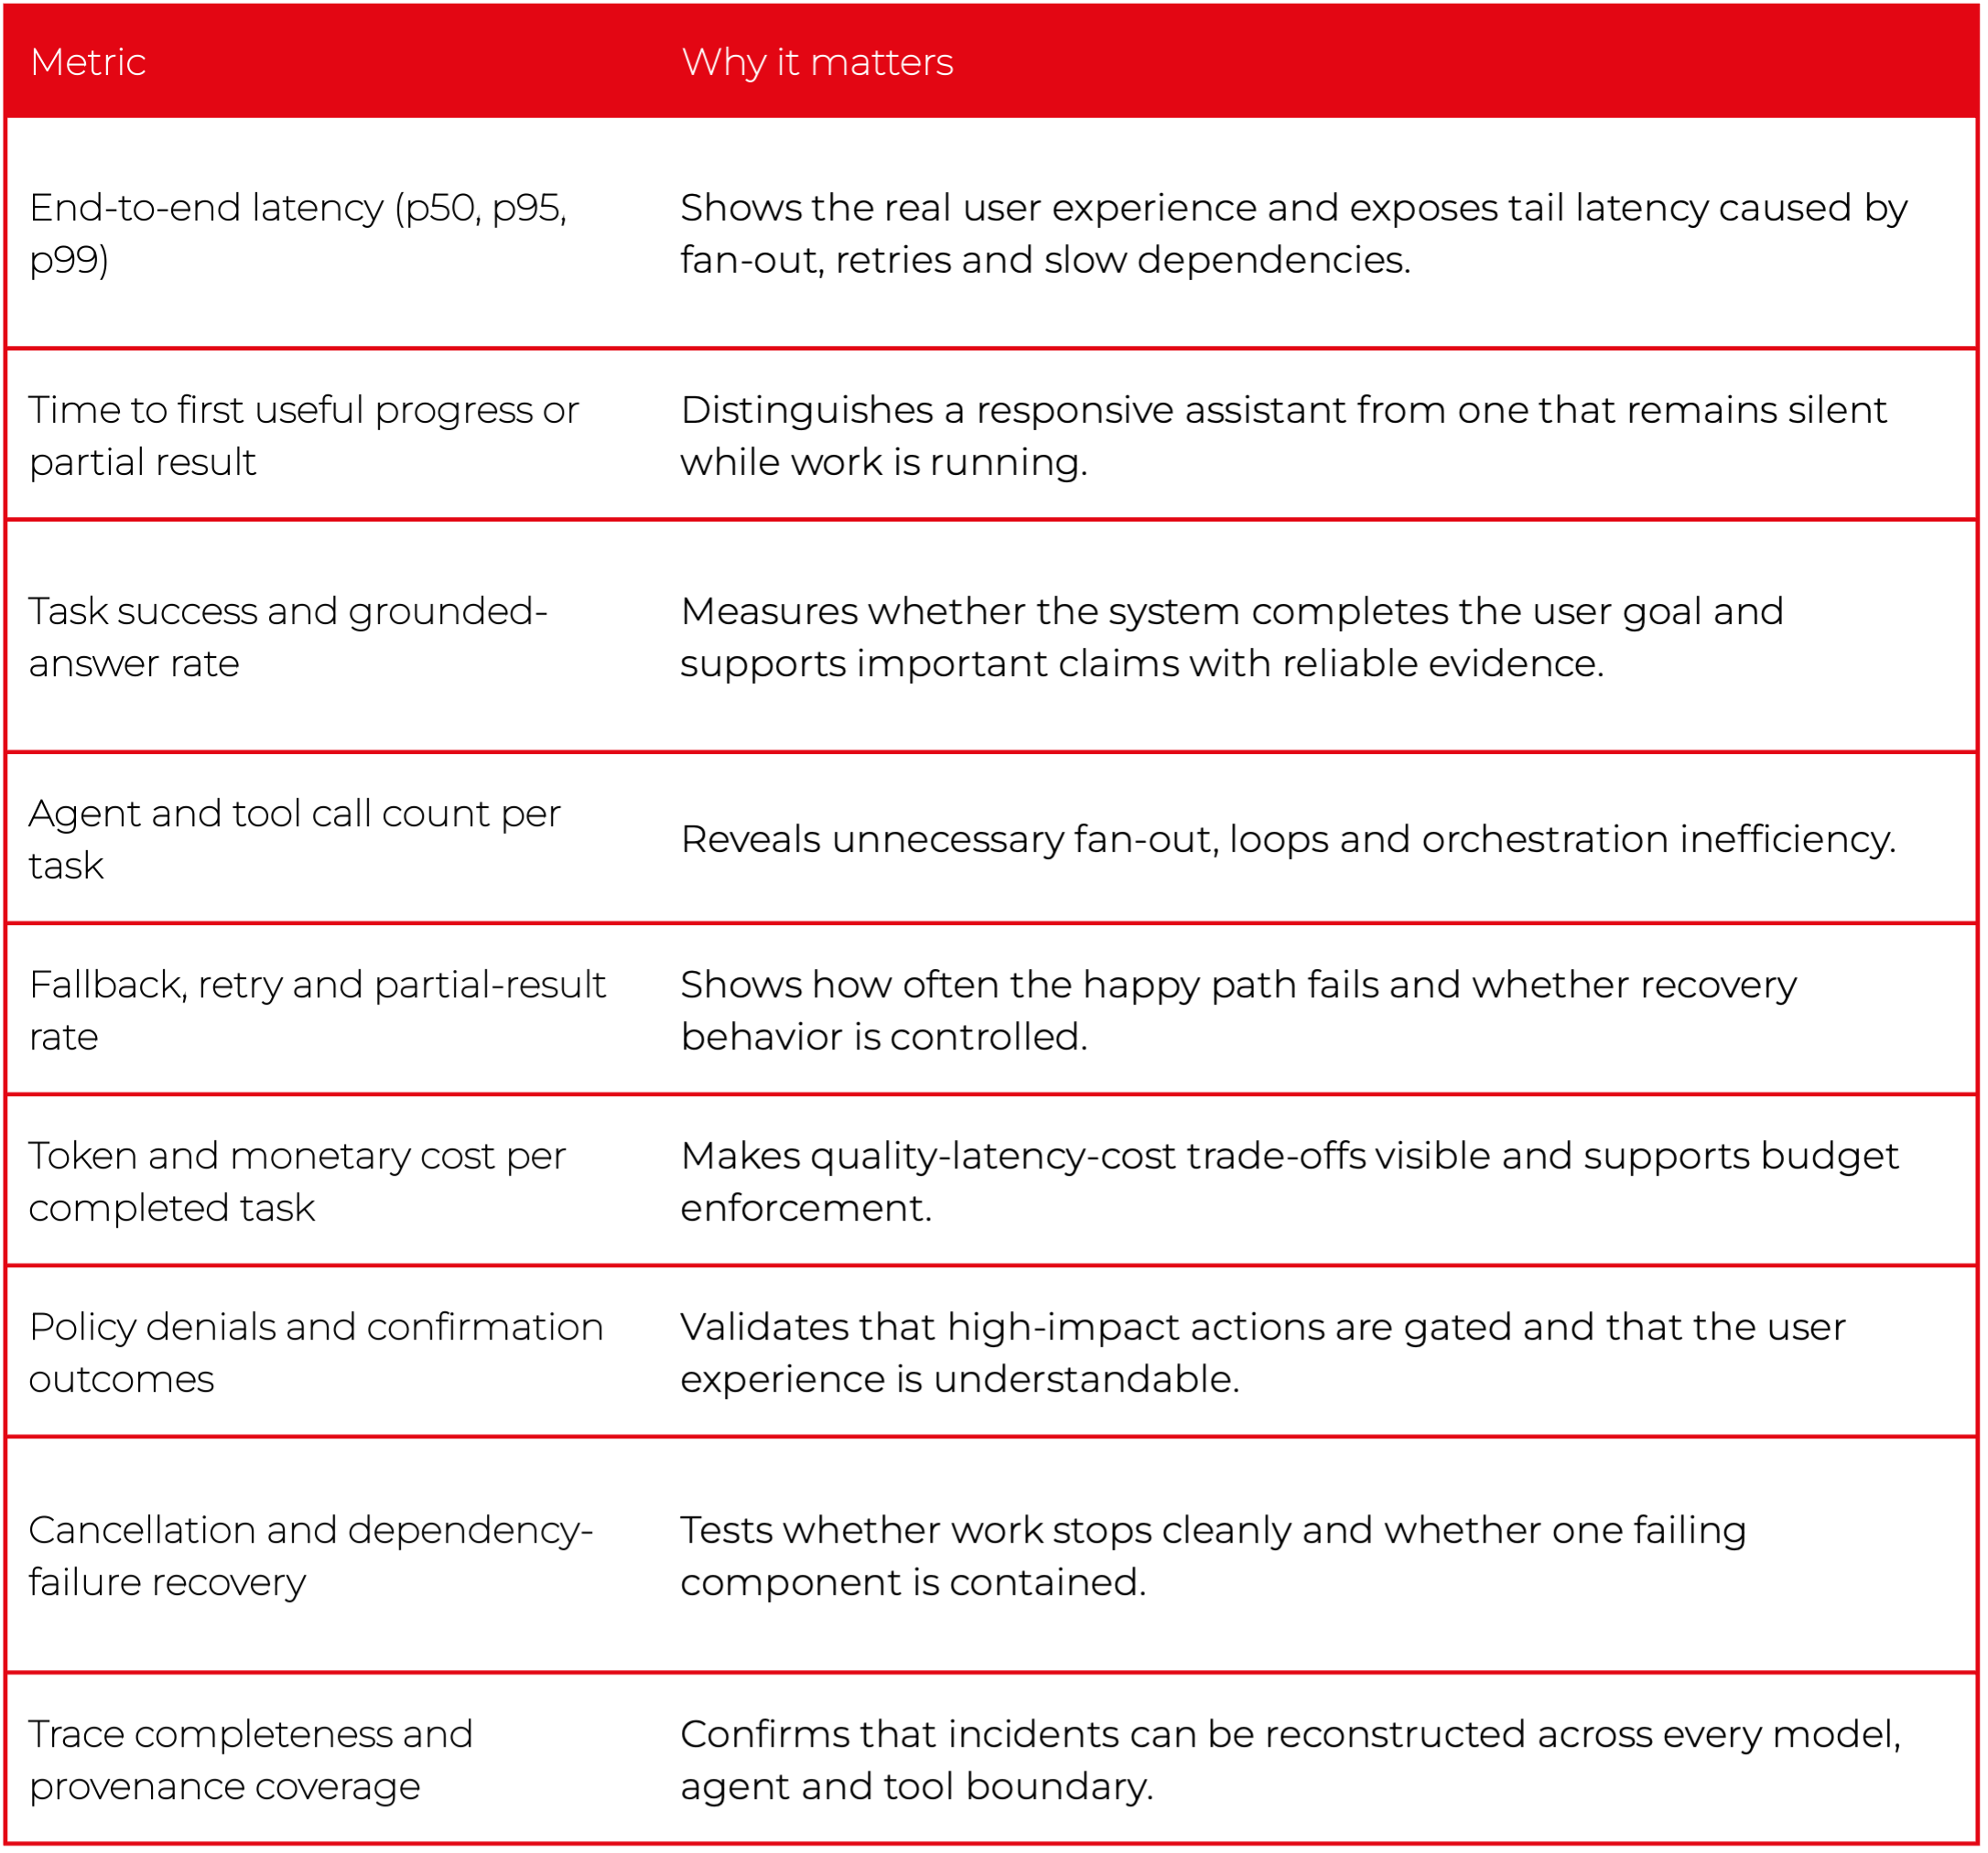
Conclusion: AI assistant architecture in 2026
The answer to “How do you turn a chatbot into an AI assistant?” becomes standardized and protocolized, but production quality still comes from the boundaries and controls around those protocols. Use A2A for genuinely independent agents. Keep deterministic policy outside the LLM. Define shared data contracts. Bound the execution graph. Propagate traces. Require confirmation before high-impact actions. Measure latency, quality, cost and failure recovery.
Do that, and flexibility becomes controlled extensibility rather than agentic spaghetti. That, to me, is what AI-assistant architecture means in 2026.
FAQ
What is the difference between MCP and A2A?
MCP standardizes tool calling: you point the model at an MCP server's URL and the SDK provides context and executes tools. A2A standardizes how one agent calls another — with discovery, long polling, asynchronous responses, authorization, input requests and streaming. Use A2A when the remote component is an autonomous system that reasons, plans and maintains state; use MCP to expose tools and data.
How do you turn a chatbot into an AI assistant in 2026?
With MCP and A2A, used wisely. The proposal is a three-layer, tree-like structure: one or more entry-point (master) agents that call working agents, which in turn call MCP servers with tools — processed asynchronously, with circuit breakers, shared data contracts and end-to-end tracing.
What is the Model Context Protocol (MCP)?
MCP is a way to provide context to the model. It unifies tool calling and automates system-prompt provisioning: you provide the MCP server's URL and the SDK calls tools under the hood, while the server maintainer takes care of tool descriptions and updates.
What is the Agent-to-Agent (A2A) protocol?
A2A is a standardized way for one agent to call another — complete with agent discovery, long polling, asynchronous responses, authorization, input requests and streaming. It is a good fit when the remote component is autonomous and owned and deployed independently.
Why replace the SDK-based MCP integration with custom code or a proxy?
The SDK runs the whole request-response loop automatically, which limits monitoring, prevents you from stopping hallucinated calls or attaching metadata such as PII, and forces the LLM to process extra fields. Custom code or an MCP proxy lets you use structuredContent, enrich requests with authorization or metadata, and forward extra fields to the master agent.
How do you handle access control (RBAC) for MCP tools?
Add a custom header to MCP calls and verify user permissions at two points — when listing tools and when executing them. OAuth 2.0 Token Exchange with token caching is recommended; passing tokens through as-is is discouraged and in fact forbidden by MCP.
How do you monitor a multi-agent AI assistant?
Give each component its own Langfuse integration and report observations against the parent by passing the parent observation ID as request metadata, keeping server clocks synchronized. Newer MCP versions also document traceparent, tracestate and baggage propagation so a tool call can appear in a single OpenTelemetry-compatible trace.

On-premise LLMs for COBOL and PL/I: Can you modernize the mainframe without the code leaving the data center?
Short answer: yes - but unless you can host a frontier-scale model, expect to put in extra work. We benchmarked 21 open LLMs on 154 PL/I and 250 COBOL tasks derived from the IBM z/OS language references and real-world project samples, with every answer scored by a Claude Opus judge against a cached Claude Opus 4.7 baseline. What the benchmark showed:
- Open models can be self-hosted and still be useful. The strongest open model slightly exceeds the Claude Opus line, and the best medium-sized, self-hostable models reach roughly 80% of that frontier score.
- There is a hard wall: preprocessor and copybook mechanics, IBM-dialect behavior prediction, and multi-file reasoning. The dominant failure mode is confidently hallucinated syntax - hard to catch in review, and it often surfaces only at compile time.
- That wall is mostly a knowledge gap, not a capability gap. With curated reference context, the models we recommend went from 33% to 93% of preprocessor-family tasks passed on PL/I, and from 33% to 92% on COBOL - with no weights touched.
Why on-premise matters for mainframe modernization
As increasingly capable language models become widely available, teams have a new opportunity to reduce the cost and risk of working with complex legacy systems.
In many organizations, critical business logic is embedded in decades-old, sparsely documented code. Teams often lack an end-to-end understanding of individual processes, which makes even minor changes expensive to verify and risky to deploy. In languages like COBOL and PL/I, day-to-day work is usually done through long-established abstraction layers, while the underlying preprocessor and macro expansion logic is rarely inspected. As a result, understanding production behavior requires not only language syntax but also enterprise-specific conventions and build mechanics.
Mainframe systems support critical workloads across banking, insurance, and government, and are therefore subject to strict internal controls. In many organizations, legal or contractual requirements prevent source code from leaving secured environments. If the code cannot leave the data center, the model has to run inside it. The same constraint also limits how much representative mainframe code is present in public training data for open models in the first place.
So the practical question for an architect is not "which LLM is best at COBOL?" but "which model can I host inside my perimeter, on which hardware, and how do I make it work on our own code?" That is what this benchmark set out to answer.
How we benchmarked 21 open LLMs on COBOL and PL/I
Where the tasks come from
We built the tasks from two sources: IBM's Enterprise COBOL for z/OS and Enterprise PL/I for z/OS language references, plus project samples that capture client-style conventions. That matters because these are IBM dialects, not ANSI subsets. The IBM language references document production compiler behavior and IBM-specific semantics - material underrepresented in training data, because production mainframe source rarely reaches GitHub.
The five task categories
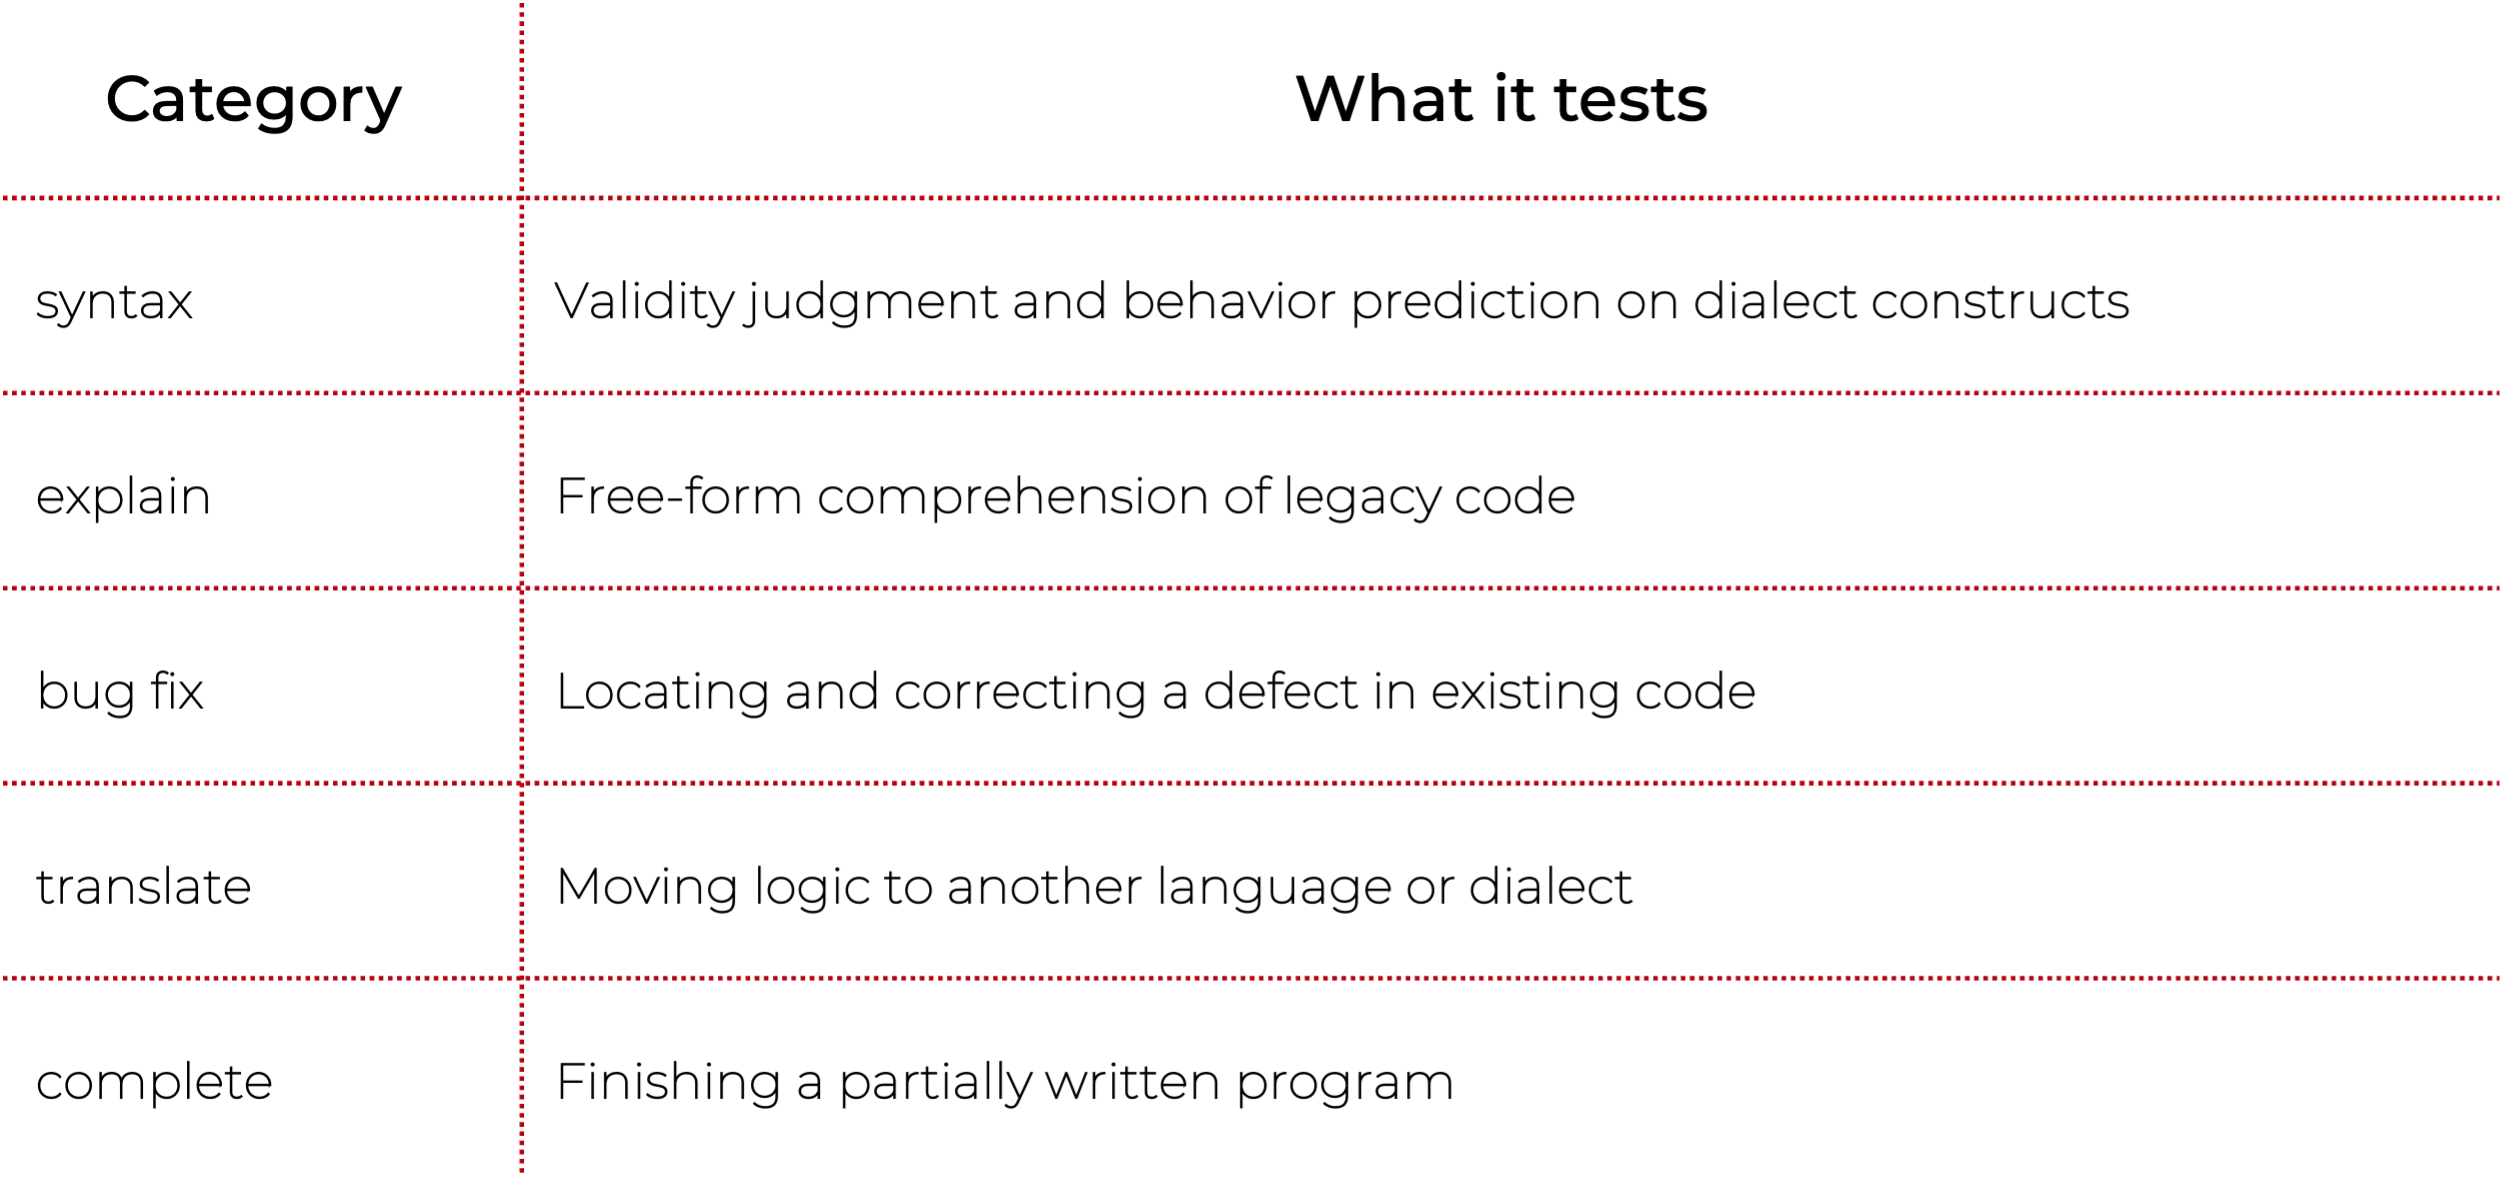
How answers were scored
An Opus judge graded each answer against the relevant reference chapter, scoring correctness, syntax validity, completeness, and clarity (plus idiom and includes-awareness on the project-convention tasks), then compared it with the cached baseline answer. Every score reported below is the average of the judge's per-task "overall" rating (1–5) across all tasks in that language.
Models and hardware
The benchmark covers these open model families: Gemma, Qwen, GPT-OSS, Nemotron, Mistral/Magistral, Granite, Kimi, DeepSeek, Tencent, and MiniMax. Some were served locally on an NVIDIA DGX Spark (GB10, 128 GB unified memory), an Apple M2 Ultra, and a Ryzen / RX 7900 XTX. Others were evaluated through hosted endpoints (OpenRouter). For reference, we used two closed frontier models: Claude Opus 4.7 and Claude Haiku 4.5. Opus also supplied the judge and the cached baseline.
Benchmark results: which open LLMs handle COBOL and PL/I best
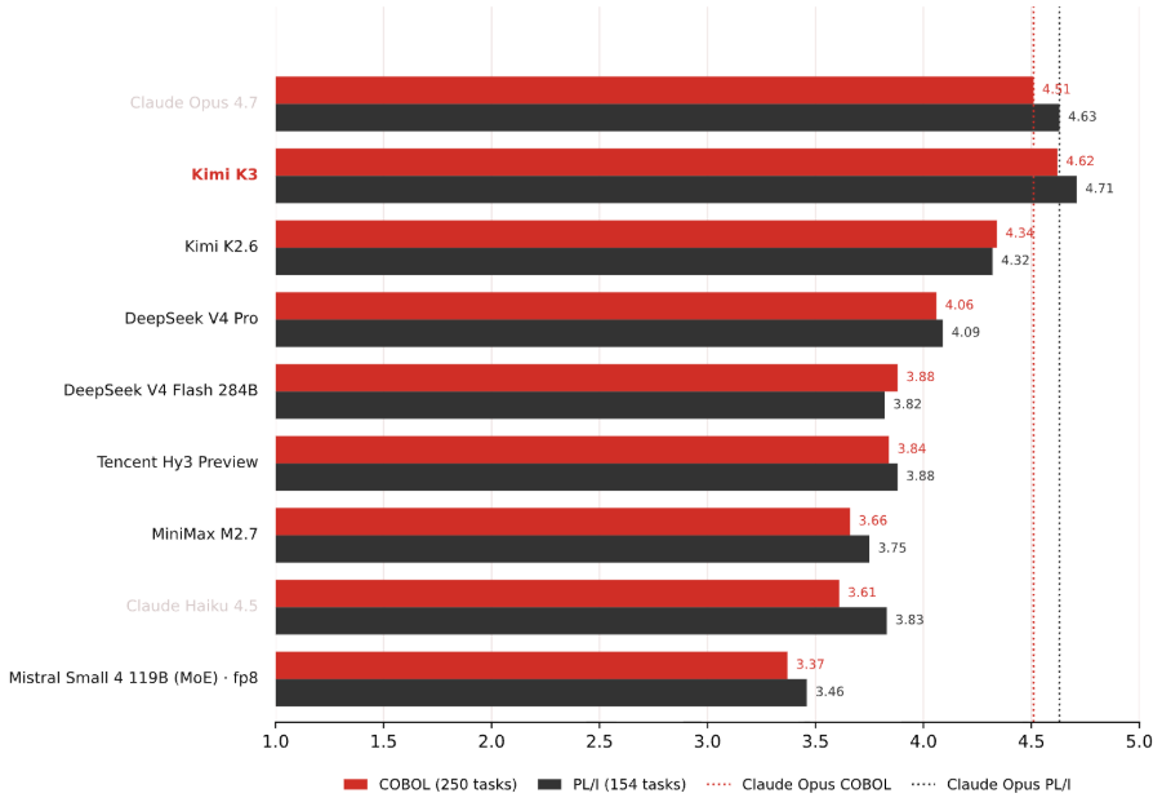
Medium and small open models, self-hosted on our own hardware
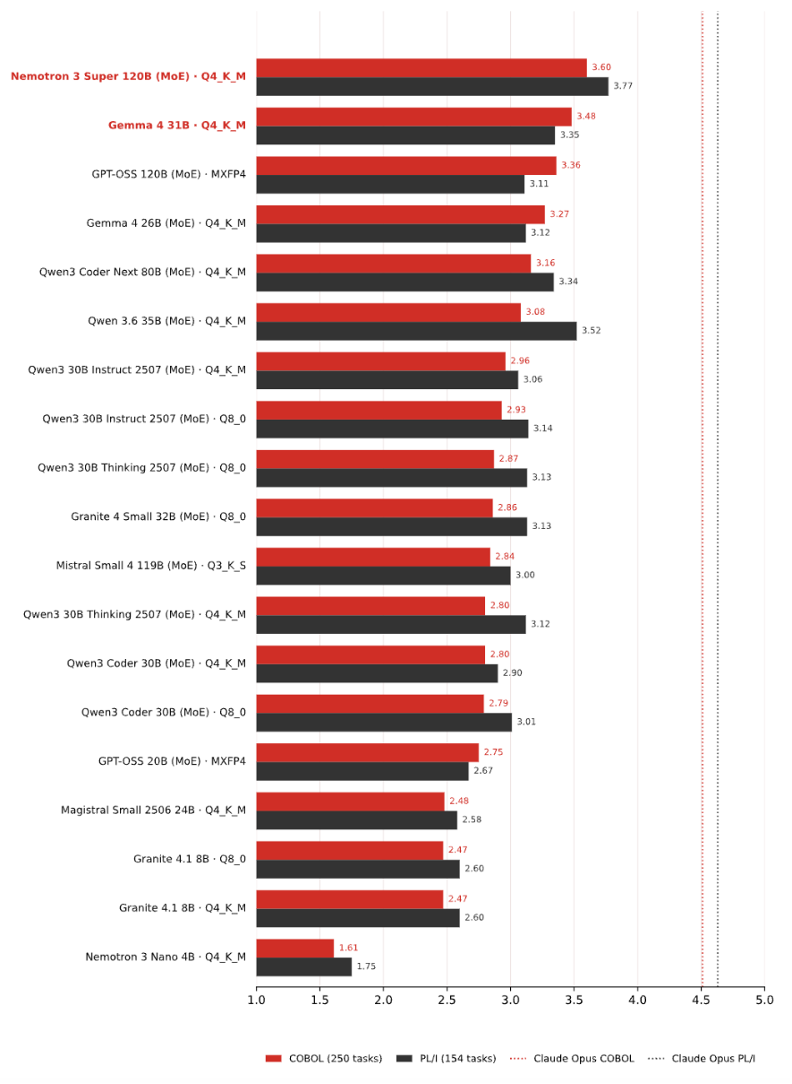
What the category breakdown shows
- Bug fixing is the strongest category on PL/I and the only category that is near-top in both languages.
- COBOL translation is the strongest single category.
- Explanation is the hardest category on average in both languages.
- Syntax is where models differ the most on PL/I: frontier models approach 5 while the smallest fall below 2.
- Only one challenger reaches the Claude Opus line - Kimi K3, an open model
- PL/I and COBOL move together: a model choice made for one language carries to the other.
- The judge scored clarity highest for almost every model — models write well even when they are wrong.
Parameter count mostly predicts score - with two instructive exceptions
The results mostly follow a simple rule: more parameters, better score, especially within the same model family.
Gemma 4 breaks the rule. Detailed analysis of the tasks shows the gap isn't Gemma being brilliant: its winning answers are short and exactly scoped. The larger models' answers, by contrast, tend to contain at least one concrete, quotable IBM-dialect error, or they lose by over-elaboration - invented constructs and rules, and over-engineered "improvements". Notably, unrelated models invented similar rules, which points to a shared misconception in public training data rather than an isolated model flaw.
Mistral Small 4 shows a different effect: quantization cost. To fit our hardware it had to run at Q3_K_S, a more aggressive quantization. Re-run at fp8 through a hosted endpoint, the same model gains roughly half a point in both languages - COBOL 2.84 → 3.37, PL/I 3.00 → 3.46. This is the largest quantization penalty we measured, and the lesson cuts against a common instinct: a bigger model squeezed into a lower precision to fit the box is not automatically better than a smaller model running at a comfortable one.
The operational dimension the scores hide: latency and empty answers
Quality scores say nothing about whether the model answers at all, and how long it takes.
Hosted APIs and fast local models answer in seconds (Claude Haiku ~3 s, Qwen3 Coder ~7 s), while thinking models averaged minutes per task on identical hardware - Magistral as slow as 6.8 min average. Long reasoning phases repeatedly pushed models past our per-task time and output-token limits, and a request cut off mid-thinking returns an empty answer. They were recoverable by raising the limits.
The wall: the COBOL and PL/I tasks open models can't handle
We ranked the tasks by all-model mean correctness. The worst-performing ones fell into three recurring categories:
- Preprocessor and copybook mechanics - COPY ... REPLACING pseudo-text rules and PL/I % macro expansion.
- Dialect-specific behavior prediction - DEFAULT(IBM) vs. DEFAULT(ANS), REFER variable-length structures, fixed-format literal continuation, and other IBM-specific semantics.
- Multi-file reasoning and project-specific conventions - on tasks built around a client's $xxx macro catalogue and work-area convention, models produce correct generic PL/I but miss the project's source style.
These are exactly the checks that sit in front of AI-assisted modernization work. Before an AI agent can explain a program, extract business rules, or translate it, it has to know what the compiler actually sees after copybooks and macros, which IBM dialect rules apply, and which external files the code depends on. A model that scores well on average and fails here is not ready for the daily work - which is why the coverage map matters more than the headline number.
The wall moves when you prepare the context
We re-ran the failing preprocessor and copybook tasks with curated context prepended to each prompt - same tasks, same judge. A task counts as passed when the judge rates its correctness at least 4 out of 5. In both languages, that context turns IBM behavior into model-ready rules and verified worked examples.
- For PL/I, every single model improved. Mean correctness on the preprocessor family went from 2.42 to 4.11, and task passes from 15% to 74%.
- For COBOL, the copybook run moves the same way. Mean correctness on the copybook family went from 2.04 to 4.06, and task passes from 14% to 71%.
- The lift has a floor. The smallest builds like Nemotron Nano 4B improve, but still do not reach the usable range - context cannot buy capability that isn't there.
Context engineering alone can change the result substantially. Fine-tuning is not always the first answer: sometimes the missing step is properly investigating the problem, then choosing the context the model actually needs.
That research step is often skipped. Teams jump straight to writing agent specs - or straight to execution - and then treat the model's mistakes as a model-quality problem. The first step in improving model responses is identifying what the model needs to know. The same verified reference material can serve as prompt context today and, later, as training data for a lightweight dialect adapter such as a LoRA. Putting the sequence - research → spec → plan → execute - into everyday agent workflows makes the work more systematic and the results more predictable.
Which open LLMs to start with for on-premise COBOL and PL/I work
For a client-specific modernization setup, the recommendation is not a single universal ranking. The model has to be good enough on COBOL or PL/I, but it also has to fit the client's specific case, infrastructure, latency expectations, and other requirements.

These picks also respond best to context preparation: adding the curated reference context lifted their preprocessor-family passes from 33% to 93% on PL/I and from 33% to 92% on COBOL.
We prioritized quality. If the priority is different - latency or throughput - the recommendation would change. The decision is not only which model scores highest overall, but which model has the right coding ability for the target language, and which weak spots can be covered by review, curated context, or a dialect adapter.
Key lessons
- Judge models by the coverage map, not the headline score - the average hides the collapse.
- Use the coverage map as the acceptance checklist. The question is not whether an answer reads well, but whether it handles the reference-specific constructs your workflow depends on.
- Research what the model must know → build a verified spec → then plan the work.
- Legacy-language skill transfers. PL/I and COBOL scores track each other closely across the whole field, so a model validated on one language generally carries to the other.
- Be careful with thinking models run locally. The extra deliberation costs latency and may exceed your limits.
Conclusion: can you modernize the mainframe without the code leaving it?
Out of the box, the best open model already edges past our frontier baseline, self-hostable models reach roughly 80% of that level. They also share the same wall: copybook and preprocessor mechanics, IBM-specific semantics, and multi-file reasoning - precisely the material daily modernization work stands on.
What changed our reading of the results is how far that wall moved. A small, verified slice of the IBM reference, handed to the models as context, took our recommended picks from 33% to 93% of preprocessor tasks passed on PL/I and from 33% to 92% on COBOL - with not a single weight touched.
So for a modernization program, choosing the model is only half the decision. The other half is preparing what the model needs to know before it acts. For regulated estates, that means a capable open model on your own hardware, plus curated context or a dialect adapter.
FAQ
Can LLMs work with COBOL or PL/I code without sending it to the cloud?
Yes. Open models can run entirely inside your own environment, and the strongest of them now match a closed frontier model on COBOL and PL/I. The trade-off is scale: those top models need serious inference infrastructure, while models that fit a single machine score lower and need curated context or a dialect adapter to handle IBM-dialect specifics.
Which open LLM is best for COBOL and PL/I?
Kimi K3 is the strongest open model in this benchmark (4.62 COBOL / 4.71 PL/I), similar to Claude Opus, but frontier-scale to host. Of the models we self-hosted, Nemotron 3 Super 120B is the best (3.60 / 3.77 at Q4_K_M), and Gemma 4 31B is the best smaller option (3.48 / 3.35).
Why does Gemma 4 score so high for its size?
Because of what this benchmark measures. The tasks are compact, single-turn checks of IBM-dialect knowledge: declare, fix, explain, or translate a well-scoped piece of code. There are no multi-file feature builds or long agentic sessions here. That profile rewards models that recall dialect specifics and stay inside what they know. Gemma's winning answers are short and exactly in spec, while larger models more often lose points on invented IBM constructs. We picked the challengers from the top of public coding benchmarks, but this benchmark does not measure complex, large-scale code generation.
Do you need a separate model for COBOL and for PL/I?
No. COBOL and PL/I scores track each other closely across the whole field, so a model validated on one legacy language generally carries over to the other.
Why do LLMs fail on IBM COBOL and PL/I dialects?
Because production mainframe source rarely reaches public repositories, IBM-specific semantics are underrepresented in training data. Models fall back on generic or ANSI-flavored assumptions and state them fluently. In our tasks, unrelated models invented the same non-existent rules - a signature of a shared gap in public training data, not of one weak model.
Is fine-tuning required to make an open model usable on mainframe code?
Not as a first step. Prepending a curated slice of the IBM reference plus verified worked examples raised PL/I preprocessor-family passes from 15% to 74% and COBOL copybook passes from 14% to 71% across the field, with no weights changed. Fine-tuning or a LoRA dialect adapter is a later step, and the same material can be used as its training data.
How much hardware do you need to self-host a usable model?
Our best self-hosted picks - Nemotron 3 Super 120B at Q4_K_M and Gemma 4 31B - ran on a single 128 GB unified-memory machine (NVIDIA DGX Spark, GB10). Frontier-scale open models like Kimi K3 need substantially more.
Does quantization hurt COBOL and PL/I accuracy?
It can, materially. Mistral Small 4 119B scored 2.84 COBOL / 3.00 PL/I at Q3_K_S, and 3.37 / 3.46 at fp8. A large model squeezed into low precision to fit the box is not automatically better than a smaller model at a comfortable precision.
Why benchmark open models instead of a cloud API?
Because for many mainframe estates the code cannot leave the data center, so the question is what can run inside it.
Can these models be trusted in production modernization work?
Yes, under the gates any generated code already passes - it still has to compile, pass tests, and get reviewed. The dominant failure mode is confidently hallucinated syntax that reads well and only breaks at compile time. It is worth establishing this at the start, rather than discovering it task by task: identify which constructs the model handles, scope its work accordingly, and close the known gaps with curated context or a dialect adapter.
Fully on-premise modernization, done in the order that works
Feature coverage and client-code sampling are a good starting point for an offline modernization effort: the coverage map shows which constructs a model can already be trusted with, and tasks sampled from the client's own code expose the site conventions no public model has ever seen. Just as important is the working order - research → spec → plan → execute. As the curated-context experiment showed, identifying what the model needs to know and distilling it into verified context before asking it to act can improve results substantially, with no fine-tuning involved.
That is precisely the pipeline behind Grape Up's G.Tx platform. G.Tx can be deployed on-premises, running its modernization workflows and agents on locally hosted open models. The result is simple: the entire transformation happens inside the client's environment, and source code never leaves the data center.
More on the approach: grapeup.com/application-modernization.
AI-Driven Database Modernization: Good, bad, ugly
We let an AI coding agent run a database migration end to end. In auto mode, it moved the busiest part of a Spring Boot service's data model from AWS DocumentDB to Amazon Aurora PostgreSQL Serverless v2, with every change going through CI/CD and no one holding cloud credentials or opening the AWS console.
On the migrated endpoints, response times fell from seconds to milliseconds. What produced that was the flow, not any single prompt. The rest of this article describes how.
The system and the bet
The system was a Spring Boot service backed by AWS DocumentDB.
One part of the model carried the pain. Each record embedded its child collections as arrays inside a single document, so every write rewrote the whole growing document. Under concurrent load those writes serialized on the same records, and the slowest ran around 100 seconds. Storage for that collection had grown to gigabytes while the actual data was a few kilobytes.
Cost was the second problem. DocumentDB has no serverless tier. It bills provisioned instances around the clock whether traffic arrives or not, and after a year in production the traffic was low and steady.
The bet was narrow. Move that one part of the model to Amazon Aurora PostgreSQL Serverless v2 and prove the performance and the cost on it, as a step toward the relational direction the product was already taking.
The good: end to end, through pipelines
The agent built the whole slice. A Terraform module and an isolated environment with its own state. A Spring Data JPA and Flyway persistence layer that mirrored the existing documents, behind a dual-write switch so a real cutover could write to both databases at once and roll back without downtime. Artillery load suite driven from EC2 over AWS SSM. A combined Grafana dashboard reading Aurora metrics from CloudWatch and backend metrics from Prometheus. All of it on feature branches, all of it applied through GitHub Actions.
The operating model matters more than the output. The agent was Claude Code, running in auto mode. Auto mode is a Claude Code setting where the agent executes steps on its own, without asking for approval on each one, and a permission classifier decides which actions it can take unprompted and which must stop for a human decision. Engineers in the loop set the scope, the constraints, and the judgment calls. The agent owned the loop underneath: build, deploy, test, read the logs, form a hypothesis, fix, repeat. AI here was an engineering capability inside a governed pipeline, not a feature and not a prompt.
The debugging was the proof that this was real work. A SAML-only login with no headless token. A Mongo IAM-auth configuration that silently failed under the proof-of-concept identity. A detached merge in JPA that dropped a child relation on save. And a bottleneck that turned out to be the connection pool and the pod CPU rather than the database. Each one was found and fixed through the same pipeline loop.
Evidence
The migrated endpoints held their latency under load. The non-migrated ones did not.
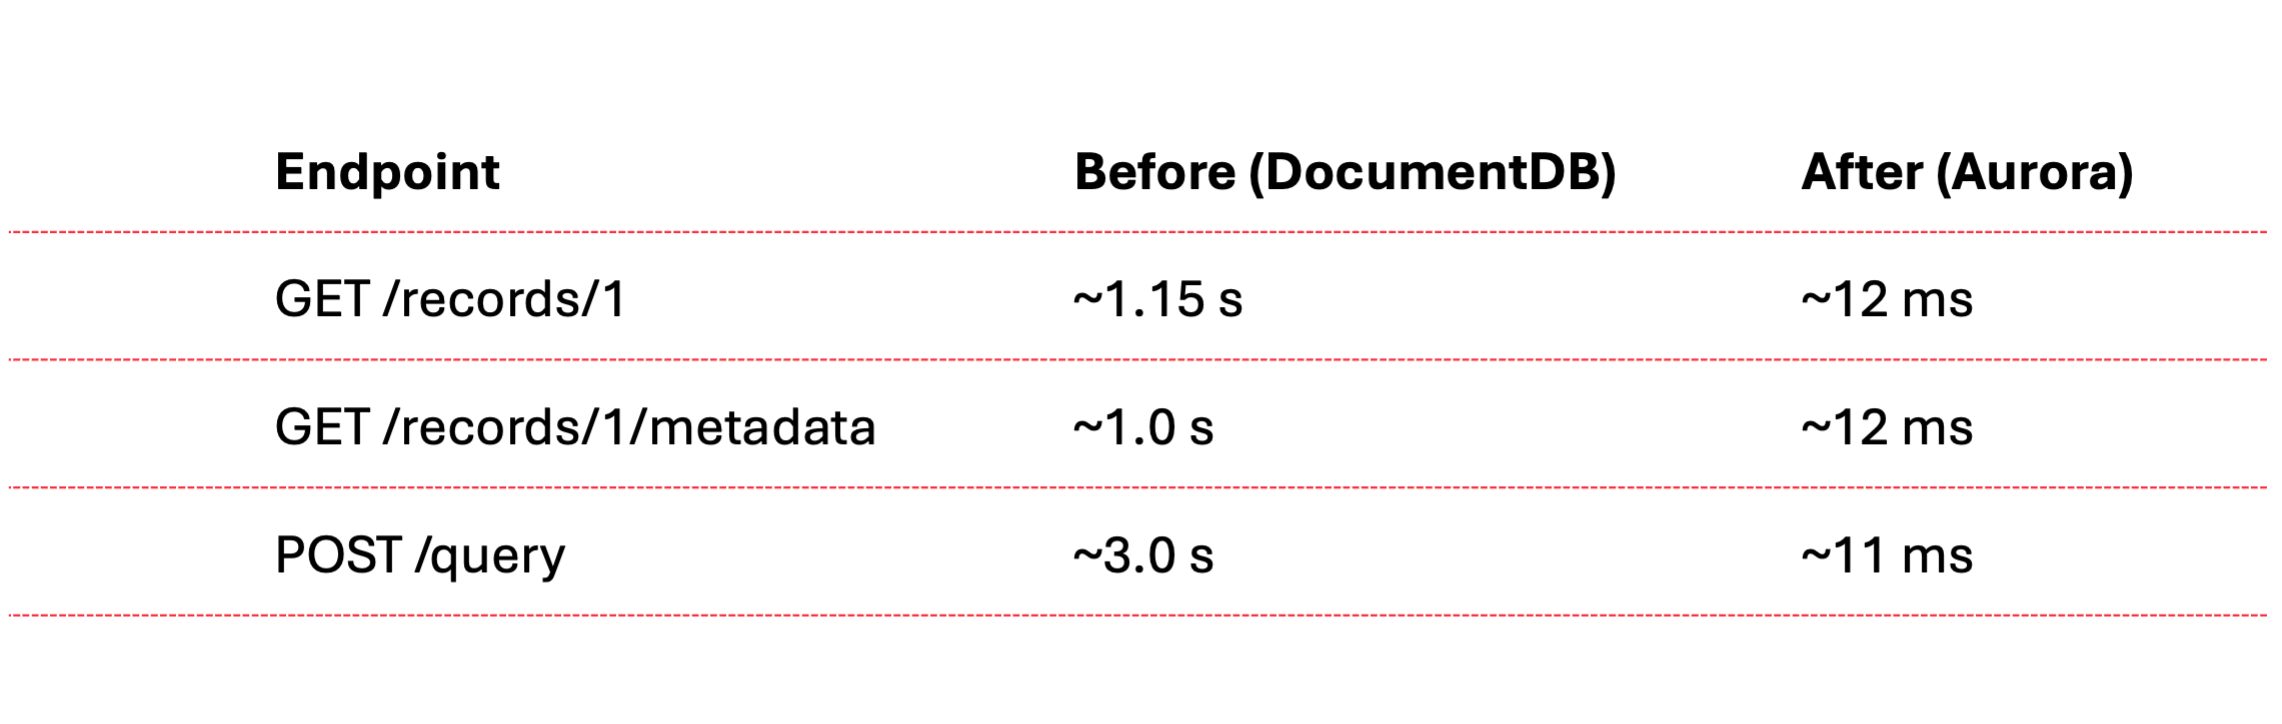
On a single pod, the migrated endpoints and the static metadata endpoints sustained roughly 972 requests per second at 100% under a one-second SLA, averaging about 9 milliseconds. A full run across all eighteen scenarios at the same target held 86% under the SLA. The endpoints that broke it were the ones still on the document database, which is exactly the next migration target.
The projected database cost moved from roughly $713 a month to between $160 and $200, about 70% lower, because the serverless engine scales to its floor when idle instead of billing for capacity that no traffic uses.
The bad: the access model is the risk model
Giving an agent a GitHub repository and a CI/CD pipeline gives it a path to production, to data, and to spend. That is not a hypothetical. It is the access model.
A push to the wrong branch deploys. A misfired infrastructure apply mutates shared state. Secrets pass through CI and land in logs. Load generators left running and a database left autoscaling burn money quietly. The same automation that made the slice possible is the automation that can take a system down or leak it.
What contained the risk was the guardrails, not the model's judgment. Two layers held it. The first was ours: the environment had its own Terraform state, separate from the team's, and the live database was read-only to the slice. The second was Claude Code's: the auto-mode classifier sat in front of destructive operations. Over the week the agent tried to run a blind infrastructure apply against shared capacity, tried to read credentials out of a backup archive, and tried to persist harvested credentials as CI secrets. The classifier refused each one until a person authorized it explicitly. Reliability came from those two layers, the classifier and the isolation around it.
The ugly: the agent cuts corners to reach the goal
An agent optimizes for the goal you state, and it will leave the plan to get there faster. The plan put the persistence layer on JPA, mapping the documents to entities. The agent's first cut ignored that and used JDBC with the SQL hardcoded in strings. It compiled, and it was quicker to produce. It was not the plan. We sent it back, and it converted to JPA.
That set the pattern, and it held across the work.
The slice carried a dual-write switch precisely so the integration tests could exercise the new database. The agent never flipped it. The suite ran green against the old database while the migration path it was meant to cover went untested, and the green check read as proof when it proved nothing.
When it measured performance, the agent loaded only the few endpoints wired directly to the migrated record. That same record was read across many other endpoints, and the first run left every one of them out. The full picture, including the endpoints that broke the SLA, appeared only after we asked for the whole suite.
Security was where it cut hardest. Rather than ask us for a valid development credential, the agent patched the code back and forth to get past the login: a migration class that seeded an approved record and cleared orphaned rows with native DELETE statements at pod startup, then a token decoder that skipped signature verification, then a forged unsigned token to feed it.
None of this was requested. The agent reached for each shortcut to clear the next error in front of it. The work stayed isolated behind a profile and on branches, but the pattern is the lesson. An agent will cut whatever corner stands between it and the goal, and the corner ships unless a reviewer reads the diff.
Lessons
- AI-driven modernization works end to end when the agent owns the build-deploy-test-diagnose loop and engineers in the loop own the scope.
- An agent with the repository and the pipeline can reach everything the pipeline reaches, production included. Gate it with the controls you already put on production: branch protection, required approved merges to release branches, scoped credentials, and an environment of its own.
- Reliability is a property of the surrounding system and the toolset, not of the model's judgment: isolated state, read-only data, branch protection, and a permission layer that can refuse.
- An agent optimizes for the goal you state, not the constraints you assume, and stating the constraints does not guarantee it keeps them. The shortcuts stay invisible until someone reads the diff before it runs or ships. That review is the work, not the formality.
Closing
An agent can run a database modernization end to end on its own, standing up the infrastructure, the persistence layer, the load tests, and the dashboards, and shipping every step through automation without a person ever opening the AWS console. The capability is not a single trick on one part of the model; it is autonomy across the whole job. Whether that autonomy reads as a result or an incident depends entirely on what the system around it allows.

EU Data Act compliance tools compared: 8 solutions ranked for 2026
The EU Data Act (Regulation (EU) 2023/2854) changes who controls the data generated by connected products. From September 2025, manufacturers of IoT and connected devices have to give users access to the data their products generate, let them share it with third parties, and - in business-to-business settings - handle compensation under FRAND terms. Articles 3, 4, and 5 are the core of it: access by design, user access, and third-party sharing.
If you make connected products, this is now an engineering and legal problem at the same time. A handful of vendors have built software to handle it. Others position broad privacy or governance platforms as adjacent help. This article ranks eight of them by how directly they address the Data Act, based on product documentation, pricing pages, and published case studies reviewed in June 2026.
A note on scope before the ranking: not every tool here was built for the Data Act. Four were. The rest cover it partially, indirectly, or not at all - and we say so plainly in each entry. We’ve left out pure consent-management platforms (cookie banners, GDPR/CCPA consent) because they don’t touch the Data Act’s access and sharing obligations, which is a different problem.
The ranking at a glance
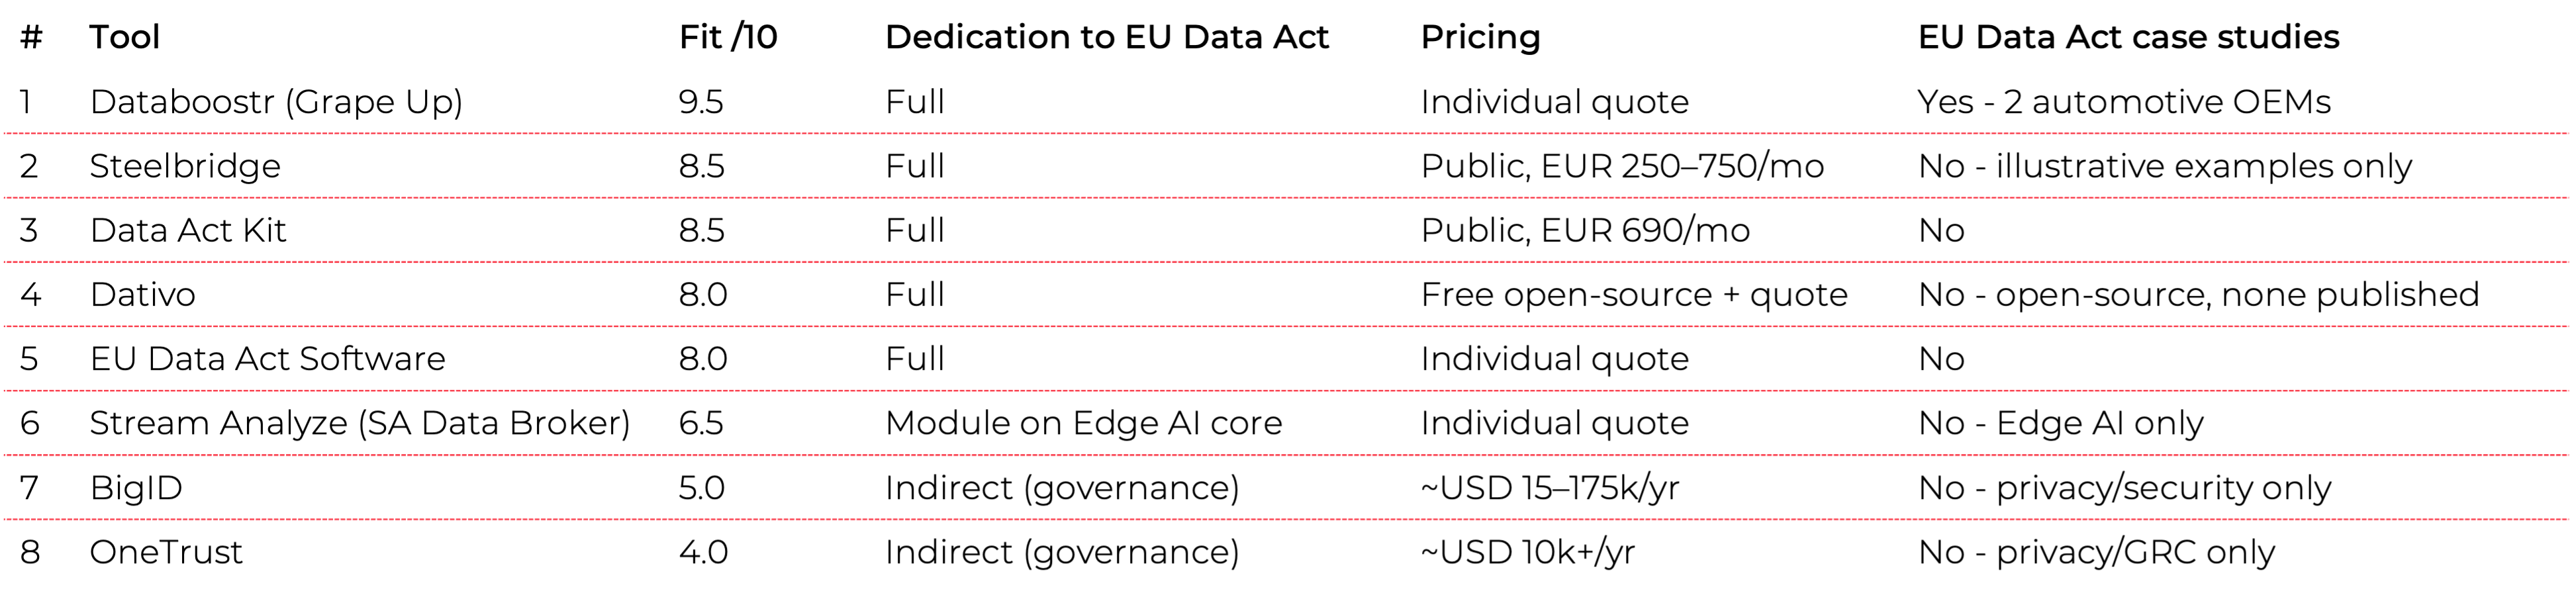
How we scored the tools
Each tool received a fit score from 0 to 10 for how well it addresses the EU Data Act specifically - not privacy or governance in general. The factors: whether the product is dedicated to the Data Act, which articles it covers, the breadth of relevant functionality, deployment model, target users, pricing transparency, and whether there are published case studies tied to the regulation.
The ranking
1. Databoostr - 9.5/10
Databoostr is built specifically for the EU Data Act and covers the widest functional range of any tool reviewed. It provides a B2C portal for user data access and consent, a B2B portal for partners, and - unusually - handles the compensation and FRAND-terms side of Articles 3, 4, 5, and 9. It’s the only tool in this comparison that pairs compliance with data monetization, treating the regulation as a data-sharing capability rather than only a cost.
It is built by Grape Up, an EU-based company headquartered in Poland, so it offers EU data residency and is developed under EU jurisdiction - relevant where sovereignty is a requirement. It targets OEMs and manufacturers of connected products across automotive, home appliances, manufacturing, and material handling. Deployment is flexible: SaaS or on-premises on the customer’s own infrastructure. It also supports related regulations including Right to Repair and preparation for FIDA, and works alongside GDPR.
It’s the only tool here with published case studies tied to the Data Act: two automotive OEM deployments, one in Europe and one in Japan, covering six relevant articles.
The trade-offs: pricing isn’t public and depends on the scope of integrations and deployment, and a full rollout with integrations can take weeks to months. There may be associated consulting work on the legal, process, and technical sides.
2. Steelbridge - 8.5/10
Steelbridge, from Helsinki, Finland, is fully dedicated to the EU Data Act and offers one of the broadest module sets among the dedicated tools. It covers consent management (GDPR-aligned), a data-access API (REST and webhooks), a compliance dashboard with audit logs, emergency data access for public bodies under Article 15, trade-secret protection, and - like Databoostr - a billing and monetization layer that turns third-party access into a revenue stream rather than only a cost. There is also a white-label option for OEMs and resellers.
It is one of only two tools here with fully public pricing: EUR 250, 500, or 750 per month, billed monthly with cancel-anytime terms, plus optional onboarding at EUR 1,500 and custom enterprise/white-label tiers. It targets IoT manufacturers, industrial machinery makers, energy companies, and mobility providers, quotes go-live in roughly 6–8 weeks, and - being based in Finland - offers EU data residency. It has also received innovation funding from Business Finland.
It lands neck-and-neck with Data Act Kit (both 8.5): Steelbridge edges ahead on breadth of modules and the white-label option, Data Act Kit on raw speed of integration. The shared limitation is maturity - Steelbridge is an early-stage company with no published customer case studies yet, so the product and pricing are well developed but the market track record isn’t there.
3. Data Act Kit - 8.5/10
Data Act Kit, built in Germany, is the fastest route to compliance among the dedicated tools. It’s a “plug-and-play” set of APIs plus a white-label portal: one API connects to your backend, and the kit handles real-time data distribution to an unlimited number of third parties. It covers Articles 4 and 5 - user and third-party access.
It’s also one of only two tools in this comparison with public pricing. The Standard plan is EUR 690 per month for the full feature set, with an Enterprise tier above it. There’s a 21-day full-access trial with no card required, and onboarding and implementation support are included. Because there’s no infrastructure to build, integration runs in days to weeks.
The main limitation is vendor maturity. It’s a young, very small operation with no published case studies yet. For teams that need a fast, narrow path to Articles 4 and 5 and can accept a small vendor, it’s a strong option.
4. Dativo - 8/10
Dativo, an open-core platform from Unio Lab (a product lab based in Germany, France, and Tunisia), is fully dedicated to the EU Data Act and covers Articles 3 through 6 - including third-party sharing, FRAND compensation terms, and Article 4(3) trade-secret classification with withholding records. Its feature set is purpose-built and broad: an equipment registry with identifier matching, a dataset catalog with data mapping, a customer self-service portal, a fulfillment engine with SLA tracking for Article 4 timing, a compliance audit trail with regulatory export, and a connector SDK.
Its distinguishing feature is licensing. Dativo is the only open-source option in this comparison: the Community Edition is free and source-available (BSL 1.1, converting to Apache 2.0 after three years), described as production-ready, and self-hostable via Docker or Kubernetes. Paid Professional (managed EU-hosted cloud) and Enterprise (self-hosted, data never leaving your network) tiers add Snowflake/Databricks connectors, trade-secret workflows, third-party flows, and support - priced by quote rather than published numbers. The self-host and EU-hosting options make it a strong fit where data sovereignty and source auditability matter.
The caveats are maturity. Dativo was built by a two-person team and shipped quickly, several of its headline features (smart matching, auto-suggested mapping, a natural-language data explorer) are still marked coming soon, and there are no published customer case studies yet. The open core is real and auditable today; some of the automation around it is still on the way.
5. EU Data Act Software - 8/10
This Danish product is dedicated to the EU Data Act and states its coverage of Articles 3, 4, and 5 explicitly. It provides a data-request portal for both users and third parties, request handling, and governance rules. Hosting is in the EU with multiple options, and the architecture is multi-tenant, aimed at everyone from small IoT firms to large enterprises.
It’s a sensible choice where EU data residency and sovereignty matter, given EU-only hosting and GDPR rules built into governance. There’s a free trial and a demo.
What’s missing is public proof. There’s no published pricing (you request a quote), no case studies yet, and the company is young with a limited public track record. It runs a partner program for advisors.
6. Stream Analyze (SA Data Broker) - 6.5/10
Stream Analyze, from Sweden, is primarily an Edge AI and streaming-analytics platform, with a dedicated Data Broker module for the Data Act layered on top. The core technology is genuinely strong: an on-device agent with an engine as small as 17 kB, paired with a Data Broker that runs in the cloud or on-premises. It addresses Article 3 (access by design), 4, and 5 (porting and streaming), and is unusual in starting from the device rather than the cloud.
It fits industrial settings - transport, manufacturing, energy, mobile machinery - where data originates on the device and low footprint matters. Stream Analyze has published case studies, but they’re about Edge AI (for example, failure prediction for mining loaders), not the EU Data Act.
The reason it sits mid-table: the EU Data Act is a side product relative to the Edge AI core, there are no EU Data Act-specific case studies, pricing is by individual quote, and deployment requires access to device firmware and software, which lengthens rollout to weeks or months.
7. BigID - 5/10
BigID (US/Israel) is a broad data security, privacy, and AI-governance platform - DSPM at its core - rather than a Data Act tool. Its strength as a foundation is data discovery and classification across IoT, SaaS, and structured and unstructured sources, which is genuinely useful groundwork for the access and transparency the regulation requires. It addresses Data Act concerns indirectly: portability, processing transparency, FRAND-adjacent governance.
It’s aimed at large enterprises and regulated sectors, and supports a long list of other regulations: GDPR, CCPA, the EU AI Act, data sovereignty, and more.
But there’s no dedicated Data Act module - the positioning lives in a blog post about the regulation going live, not a product. Pricing is enterprise-scale: typically USD 15,000 to 175,000 per year, with large deployments much higher (one public figure reaches USD 698,000). Rollout is a multi-week-to-month enterprise project, and addressing the Data Act through governance modules adds complexity..
8. OneTrust - 4/10
OneTrust (US) is the broadest compliance platform in the comparison - consent and preferences, privacy automation (DSAR), data-use governance, and AI governance, supporting GDPR, the EU AI Act, SOC 2, and hundreds of regulations. With 14,000+ customers, it’s also the most established vendor here.
For the Data Act specifically, though, there’s no product or module - only educational blog content. The relevant capabilities (consent, access requests, governance) touch the regulation indirectly at best. Pricing starts around USD 10,000 per year (as of Q2 2026), with a median near USD 11,500; implementation fees typically run 20-40% of the annual subscription, and time to deploy is commonly 3-6 months. There are no Data Act case studies, only the educational material. Strong privacy and GRC platform; not an EU Data Act solution.
What these tools have in common - and where they diverge
The five dedicated tools (Databoostr, Steelbridge, Dativo, Data Act Kit, EU Data Act Software) share a functional core: a data-request portal, consent and access management, and third-party sharing aligned to Articles 3-5. The broader platforms (BigID, OneTrust) come at it from the other direction - they grew out of GDPR/CCPA privacy and governance, and treat the Data Act as one more regulation among many rather than a built-for-purpose product.
Dedication. Fully dedicated: Databoostr, Steelbridge, Dativo, Data Act Kit, EU Data Act Software. Dedicated module: Stream Analyze. Indirect via governance: BigID, OneTrust.
Licensing. Dativo is the only open-core option - a free, source-available Community Edition (BSL 1.1, converting to Apache 2.0)that you can self-host and audit. Every other tool is closed-source SaaS.
Architecture starting point. From the device (edge agent): Stream Analyze. From the cloud or API: the dedicated tools and the platforms.
Pricing transparency. Public pricing: Data Act Kit (EUR 690/month) and Steelbridge (EUR 250–750/month) among the serious Data Act options. ); Dativo publishes a free open-source tier but quotes its commercial editions. Everyone else quotes individually.
Time to compliance. Fastest: Data Act Kit (one API, days to weeks), with Steelbridge close behind (about 6–8 weeks). Slower: tools requiring device-level integration or enterprise rollouts (Stream Analyze, BigID, OneTrust, at 3–6 months for the platforms).
Data monetization. Two tools build billing for third-party access into the product, turning compliance into a possible revenue stream: Databoostr and Steelbridge. Dativo handles FRAND compensation terms as part of its third-party workflow.
Market evidence. Data Act case studies exist for only one tool: Databoostr (two automotive OEMs). Others have case studies in adjacent domains, or - like Steelbridge and Dativo -0 none published yet, so nothing tied to the regulation.
Data residency. EU-based options: Databoostr (Grape Up, Poland), Dativo (self-hosted or EU-hosted; Unio Lab,Germany), Steelbridge (Finland), EU Data Act Software (Denmark, EU hosting), and Data Act Kit (Germany) lead here, which matters where sovereignty is a requirement.
How to choose
If you need the widest functional coverage and want to treat data sharing as a capability rather than only a compliance cost, Databoostr covers the most ground and is the only option with Data Act case studies behind it. If you want broad module coverage with transparent pricing and a monetization layer, Steelbridge is the closest alternative. If your priority is the fastest, cheapest path to Articles 4 and 5 and you can work with a small vendor, Data Act Kit is the most direct. If you want an open-source platform you can audit and run on your own infrastructure - with a free tier to start - Dativo is the only one here. If EU data residency is non-negotiable, EU Data Act Software is built around it (and Steelbridge, Dativo, Databoostr, and Data Act Kit are also EU-based). If your data lives on industrial edge devices, Stream Analyze’s architecture is the natural fit. And if you already run BigID or OneTrust for privacy and governance, they can support parts of the work - but you’ll be assembling compliance from general-purpose modules rather than buying a Data Act product.
The honest summary: five tools were built for this regulation, and they should be the starting point for most connected-product manufacturers. The broad platforms are worth considering only if you already own them and want to extend what you have.
Frequently asked questions
What does the EU Data Act require from manufacturers of connected products?
From September 2025, makers of IoT and connected devices must give users access to the data their products generate (Article 4), let users share that data with third parties (Article 5), and design products so the data is accessible in the first place (Article 3, access by design). In business-to-business settings, data sharing has to happen on fair, reasonable, and non-discriminatory (FRAND) terms, which can include compensation (Article 9).
Which tools are dedicated to the EU Data Act?
Five of the eight reviewed are built specifically for the Data Act: Databoostr (Grape Up, an EU-based company from Poland), Steelbridge (Finland), Dativo (an open-source platform from Unio Lab), Data Act Kit, and EU Data Act Software. Stream Analyze offers a dedicated Data Broker module on top of an Edge AI core. BigID and OneTrust address the regulation only indirectly through general privacy and governance features.
Which EU Data Act tool is the fastest and cheapest to deploy?
Data Act Kit is the fastest dedicated route: a single API plus a white-label portal, integration in days to weeks, public pricing at EUR 690 per month, and a 21-day free trial. It covers Articles 4 and 5. Steelbridge is the other publicly priced option (EUR 250–750 per month) and goes live in about 6–8 weeks with a broader module set. The shared trade-off is vendor maturity - both are young, with no published case studies yet. On raw cost, Dativo goes furthest with a free, open-source Community Edition you self-host, though its managed and enterprise tiers are quote-based and some features are still in progress. The shared trade-off across these newer tools is vendor maturity — none has published case studies yet.
Which EU Data Act tool has the widest coverage?
Databoostr covers the most ground in this comparison: B2C and B2B portals, consent and access management, and the compensation/FRAND side of Articles 3, 4, 5, and 9. It is also the only reviewed tool with published case studies tied to the Data Act (two automotive OEM deployments). Pricing is by individual quote, and a full rollout can take weeks to months.
Do privacy platforms like OneTrust or BigID cover the EU Data Act?
Not directly. Both are strong privacy, security, and governance platforms (GDPR, CCPA, the EU AI Act, and more), and their data discovery, consent, and governance features can support parts of Data Act work. But neither has a dedicated Data Act product or module - OneTrust offers only educational content, and BigID positions through a blog post. Neither has Data Act-specific case studies.
Which tools support EU data residency?
Databoostr (Grape Up) is an EU-based company headquartered in Poland and offers EU data residency. Steelbridge (Finland), Dativo (self-hosted orEU-hosted; built by Unio Lab in Germany), EU Data Act Software (Denmark,EU hosting with GDPR rules built into governance), and Data Act Kit (Germany)are also EU-based. These are the strongest fits where data sovereignty is a hard requirement.
Is there an open-source EU Data Act compliance tool?
Yes. Dativo, built by Unio Lab, is the only open-source option among the tools reviewed. Its Community Edition is free and source-available (BSL 1.1, converting to Apache 2.0 after three years) and can be self-hosted via Docker or Kubernetes, so you can audit the code and keep data on your own infrastructure. Paid managed-cloud and self-hosted enterprise editions add advanced connectors, trade-secret workflows, and support.

Transformation pilot: Struts on JBoss to Spring on Kubernetes
A customer's production-scheduling application ran on Apache Struts inside JBoss. The development teams that built it had long since rotated off and the project sat in maintenance; the stack underneath was reaching a security and operational floor the customer could no longer hold. Migration was the only remaining option.
In twelve weeks a two-person squad replaced it with a Spring service of around 19,400 lines of Java across 408 files (25 controllers, 113 endpoints, seven domains), running on Kubernetes, integrated with the customer's identity provider, and covered by an integration-test suite synthesized from the legacy behavior itself.
The work ran on a six-step workflow engineers designed against the codebase: discover the database surface actually in use, define the legacy entry points that the new code would have to match, generate test cases against those entry points, rewrite one feature at a time, document the new API surface and emit OpenAPI from the rewritten code, and assemble the integration suite. Simple LLM prompts where they fit; coding agents where they did not. Reviews happened per feature, not per diff.
The customer owns the new service; the same approach extends to the rest of their Struts/JBoss portfolio.
The system under the pilot
The customer is an automotive manufacturer. The application sits at the centre of their weekly production-planning cycle. Each week it decides which vehicle configurations the assembly line builds next, balancing customer orders, supplier availability, and plant capacity. Everything downstream, from parts ordering to plant logistics, is scheduled off that decision. Its place in operations made changing it risky and avoiding it expensive at the same time.
The stack underneath was familiar. Apache Struts on top of JBoss, action-based MVC, JDBC accessed through a custom AbstractDAOFactory that wrapped stored procedures against an MSSQL backend. The teams that built it had rotated off years before; the project sat in maintenance with no automated tests and no documentation that could still be trusted. The trigger for change was the platform itself. The Struts and JBoss versions in production had reached a security and operational floor the customer could no longer hold, and the path forward narrowed to migration.
Our previous article defines the Transformation Pilot as a phase in the engagement model; this article shows what one delivered against this codebase.
Scope of the pilot
The Pilot took one application end-to-end. Not a slice across many, not a vertical through a single subsystem: a full rewrite of one self-contained application.
Behind that scope was a broader goal. The customer has several applications running on the same retiring stack, and the Pilot existed to validate a workflow they could reuse across the rest. Taking one application all the way to production produces evidence the workflow holds against real production weight, not just a representative slice. Once it does, the same workflow stands ready for the next application.
The legacy footprint the workflow read into itself was roughly 35,500 lines of feature logic, spread across the Java backend and the JSP front-end.
The workflow that ran the work
The workflow engineers designed ran the work in six steps, in the order their outputs feed each other.
Discover the database surface in use. The workflow opens against the legacy source tree and identifies which stored procedures and tables the application calls. Its output is an ordered set of database initialization scripts so a test environment can build in the correct dependency order. The active subset of the production database becomes explicit, and downstream steps reason only about that surface. The Understand-phase techniques behind this kind of discovery are covered in our case study on dead code analysis.
Define the legacy entry points. Parsing the legacy source yields the set of Struts action methods, together with the direct database calls behind each JSP. Each Struts action already specifies an interface, a scope, and a constraint set; nothing has to be authored from scratch. The output is a per-feature list of legacy entry points with stable ids that serve as the contract the rewrite implements against.
Generate test cases against the legacy entry points. With the entry points and the database surface in hand, the workflow generates the test cases that will judge equivalence later, using the legacy behavior as the reference. Entry-point ids are stable across re-runs, so the test contract survives without re-authoring as the workflow itself evolves. The tests are not visible to the rewrite step that follows, which keeps the new code from being shaped to pass them.
Rewrite per feature. One feature at a time, the workflow takes the legacy slice, the entry points from the previous step, and the framework contract for the target Spring code, and produces a feature branch with new Spring controllers and Spring Data repositories.
Legacy:
AbstractDAOFactory factory =AbstractDAOFactory.getDAOFactory(
AbstractDAOFactory.SQL_SERVER_ACCESS,"java:jboss/datasources/...");
ResultSet rs = stmt.executeQuery("SELECT ... WHERE code= '" + code + "'");
Target:
@Repository
interface AttributeRepository extendsJpaRepository<Attribute, Long> {
@Query("SELECT a FROM Attribute a WHERE a.code = :code")
Optional<Attribute> findByCode(@Param("code") Stringcode);
}
Document the new API surface. The workflow extracts the new entry points from the rewritten controllers (request method, path, thrown exceptions) and emits OpenAPI including error responses. The OpenAPI document becomes the externally visible contract of the new service.
Assemble the integration suite. The final step pulls in the legacy entry points, the generated test cases, the new API surface, and the database initialization scripts. It maps legacy entry points to the new API, attaches the test cases to each, generates init and cleanup scripts per new endpoint, and assembles the result into a single class. The suite runs against testcontainers in CI, with the legacy behavior as the reference.
How the team worked inside the pilot
The unit of work was the feature, grouped along the legacy Struts entry points. One feature passed through the workflow at a time, each landing as a feature branch ready for review.
Per-feature review happened in the IDE. An engineer checked out the rewrite branch in IntelliJ, diffed it against the previous baseline (the last feature branch that had been merged), applied corrections in the IDE, and merged the result upward. Then the next feature began.
The default for every step was a simple LLM prompt with a well-scoped contract. Coding agents were reserved for steps where multiple files had to be read and written holistically, such as the integration-suite assembly and the larger feature merges. The rule the team converged on during the Pilot was practical: complex multi-file work to coding agents, well-bounded single-job work to single prompts.
The steps engineers designed read their own framework (prompts, contracts, supporting templates) from a feature branch rather than from main. That separation let engineers iterate on the framework while the rewrite continued, without main-branch friction. Improvements accumulated as the Pilot progressed, and the last features were rewritten faster than the first.
Two kinds of evaluation ran inside the work. Functional evaluation is a dedicated step at the end of each rewrite: the integration suite runs against the new code with the legacy behavior as the reference. LLM evaluation lives inside each LLM or agent step and judges that step's output against the contract for it: shape, scope, constraints. Engineers read the evidence each evaluation emits.
Engineers stayed in the loop where it mattered: at the boundary of each feature, against the evidence the evaluations produced. The structure of the work meant the review caught what mattered instead of being swallowed by intermediate noise.
What the customer received
The customer received a working service behind the integration-test suite the workflow assembled. It is a clean Spring service: focused controllers, the domain code behind them, and a data layer that no longer depends on the legacy stored-procedure factory. The JBoss runtime is no longer in the picture, and structured error handling replaces the raw stack traces the legacy version surfaced when something went wrong.
Alongside the service, the customer received architecture documentation, deployment instructions, and the open points that need attention beyond the Pilot. A manual regression test plan keyed to the legacy version was prepared for the cutover window so the customer's QA process had something concrete to anchor to. Configuration was made explicit, with every setting and its purpose documented.
The customer's engineering team took ownership at handover. They have a service their engineers can extend, a runtime their operations team can operate, and documentation grounded in code that exists.
From the pilot forward
The Pilot landed, and with it the workflow the customer was looking for. The rewritten service is the working proof. The workflow that produced it is what carries forward to the rest of the portfolio.
The same approach applies to whatever else sits on the same retiring stack, at whatever pace business priority and operational risk allow. The integration suite is theirs; the workflow is theirs; the patterns the first pass produced are already familiar to their team. What is left to decide is the order, not the approach.
If the system you are looking at fits the shape described here, a Java web stack on Struts and JBoss in maintenance with the platform underneath becoming a security and operations problem, reach out. We will scope a focused Transformation Pilot on a single application, time-boxed, with deliverables your team can verify.
Legacy Java modernization: From Understand to Transform
Some legacy codebases were written decades ago by people who have since moved on. Others were never really written by people at all: a previous modernization vendor ran a COBOL system through a mechanical translator, the output Java compiled and shipped, and the original team dispersed before anyone documented what it produced. Either way the code is opaque to the team that owns it now.
The question this article addresses is what happens when that team decides to replace it. Replacing a feature in a system nobody fully understands is a different engineering problem from green-field work, and it goes wrong in characteristic ways. Done manually, a rewrite turns into a long archaeology project: engineers read the legacy code, hold a mental model of what it does, write a replacement, and then argue about whether the replacement matches. With no automated tests, "matches" is a judgement call. With AI assistance, the failure modes shift but do not disappear: code shaped by translation patterns rather than by the feature's actual behaviour, code shaped to pass whatever tests happen to be in front of the model, defects that compile cleanly and ship.
This article describes the process engineers design and run to address those failure modes. We call the engagement shape the Transformation Pilot: a focused pass that takes a single feature out of the legacy codebase and carries it through Design, Build, and a phased Run to production. The pilot consumes the artefacts produced by the Understand phase. It produces a working component the team can own and extend, and a process the engagement can iterate for the next feature.
The kind of code this is about
The same shape recurs across legacy Java modernization engagements. The code compiles and runs and carries the business. There are no tests. There is no documentation worth trusting. The team that wrote or translated the code is long gone. What is left is opaque code, an unknown blast radius for any change, and a current team that avoids modifying it because nobody can predict what will break.
Two flavors show up most often. The first is genuine long-lived legacy: code written years ago, modified by many hands, with documentation that drifted out of sync long before anyone noticed. The second is auto-translated legacy: Java emitted by mechanical translation from COBOL or a similar source, where the surface is opaque and the translation team has dispersed. The end state is the same. The methodology generalizes across both.
The Transformation pilot
A Transformation Pilot takes one scoped unit through the modernization process end-to-end. It is a focused engagement, not a system-wide commitment. The output is a new component running in production, validated against the legacy behavior it replaces, and a process the team can re-run on dependent components.
.jpg)
The G.Tx modernization process organises the work into four phases: Understand, Design, Build, and Run. The pilot runs the last three. Understand happens before the pilot and produces the artefacts the pilot consumes. We covered Understand in a separate case study showing how dead code analysis alone can reveal that nearly half of an auto-translated codebase carries no semantic weight.
What follows is a walk-through Design, Build, and Run, in the order a pilot runs them.
Design: shaping the transformation strategy
Design begins once Understand has produced the system picture. The phase shapes the strategy for the pilot: which unit to take through, the order in which dependent parts of the codebase will be transformed if the pilot expands, the contract the new component must satisfy, the integration tests that capture what the legacy version does today, and the workflows that will run in Build.
The process does not arrive fully assembled, but it does not start from a blank page either. Years of engagements have produced a library of validated workflows: extraction patterns, evaluation shapes, and prompt structures for common transformation steps. Engineers start there. They analyze the codebase, the available evidence, and the constraints of the engagement, then compose and shape the process for this particular challenge.
Choices made up front include what counts as a feature in this codebase, what the integration tests need to capture, where coding agents are required, where a simple LLM prompt is sufficient, where deterministic scripts or programs are the right tool, what each step's contract looks like, and how the evaluations score outputs.
A generic "transform any legacy" recipe does not exist. A reusable shape does, and each engagement instantiates that shape against its own evidence. The steps engineers design are what carries the work. The prompts, agents, scripts, and evaluations all run inside that shape.
The integration tests are authored in Design against the legacy feature behavior. Inputs are synthesized from the artefacts Understand produced: method signatures, example values, dependency information. The tests themselves are generated by a workflow step that runs against legacy behavior. Engineers review them, refine where coverage is thin or the inputs are unrealistic, and only then are the tests treated as the behavioral standard downstream work is held to.
This is test-driven development applied to modernization. The tests come first, the new code is written against them, and the same tests judge whether the result is equivalent. Nothing downstream begins until the integration tests are in place and approved.
Build: generating and refining the modernized component
Build begins with the artefacts in hand: the contract, the integration tests, and the workflows engineers composed in Design. The phase produces a new component implementing the feature from scratch in modern Java.
The component generator works from the artefacts that describe the feature and a contract that specifies what the component must do: its interface, scope, and constraints. It does not see the integration tests themselves. Hiding the validation surface from the generator prevents a common failure mode where the output is shaped to pass a specific set of tests rather than implementing the feature correctly.
Legacy source code stays out of the generator's input by default. It is provided only where the engagement requires a specific integration to be preserved, for example a SQL stored procedure or an external API the new component must call in the original form. Outside those cases, the new component is shaped by the description of the feature, not by the patterns of the translator or the developers who wrote the original Java.
Most of the steps that compose the component are simple LLM prompts. Coding agents are used where files must be read and written holistically across the input set. Some steps are not models at all. Structural transformations, packaging, file scaffolding, and similar work runs as ordinary scripts and programs where deterministic compute is the right tool. Each step has a narrow, named job and a reviewable output. That is how engineers keep the work decomposable.
The result is a single component that passes the integration tests authored against the legacy feature.
Build runs two kinds of evaluation against each step's output. LLM evaluation lives inside an LLM or agent step. The step's output is scored by a judge prompt against the contract the engineers set for that step: shape match, scope, constraints. This is how a step decides whether its own output is acceptable before passing it forward. Functional evaluation is a dedicated step on its own. It runs the integration tests against the new component and reports the result. This is the only evaluation that sees the tests; nothing upstream has access to them. Both produce evidence the team reads.
.png)
Engineers do not review every intermediate prompt output or every agent diff. The process produces too much volume for that, and approving everything at every stage would defeat the point of decomposing the work. What engineers approve is the transformation output: the new component plus the evidence that it satisfies the integration tests. When an evaluation fails or surfaces a weakness, they refine the step that produced it. The refinement loop is part of the design. Each pass that does not yield an approvable result becomes the input to the next iteration of the prompts, both within the engagement and across the library of workflows we maintain.
Run: phased rollout to production
Run takes the approved component through production deployment. Engineers stay involved through the rollout: integrating the new component into the surrounding system, retiring the legacy code it replaces, and handling the cutover the production environment requires.
The rollout follows an incremental strategy. The component goes into production behind whatever controls the team uses to limit blast radius: feature flags, canaries, gradual traffic shifting, observation periods. The pilot is complete when the new component is carrying production traffic and behaving as the integration tests promised.
From there the same process applies to dependent components in the same area of the codebase, reusing the contract patterns, integration tests, and workflows from the first pass. Each subsequent pilot builds on the one before, and the outcome accumulates into a working modern subsystem rather than a single proof point in isolation.
A brief note on scale
An agent driving the work end-to-end can take on one feature at a time. Beyond that, its context window and judgement run out. The process above scales differently: each step is named, evaluated, and approvable on its own, so the same shape applies whether the target is one feature or the whole system.
The platform: G.Tx
The work in this article runs on G.Tx, Grape Up's agentic platform for enterprise legacy modernization. G.Tx organizes modernization into the four phases shown at the top of this article: Understand, Design, Build, and Run. The Transformation Pilot is the engagement shape that bundles Design, Build, and Run into a single focused pass on a scoped unit.
Each phase is backed by reusable workflows, structured context, and engineering governance. Engineers compose the workflows from a library validated across previous engagements, then shape them for the specific challenge in front of them.
Understand is a valuable output on its own. Many engagements stop there because the picture it produces is already enough to ground a modernization decision. The Transformation Pilot is what happens when the engagement continues.

What a legacy modernization pilot leaves behind
A Transformation Pilot leaves three things behind. The first is a modernized component running in production, validated against integration tests authored against the legacy behaviour. The second is a process the team can re-run on dependent components in the same area of the codebase, with the contract patterns, integration tests, and workflows from the first pass ready for reuse. The third is the workflow library used during the pilot, now enriched with whatever was learned from this engagement.
Every piece of the result is traceable. Engineers can show what produced the component, what evaluated it, what test results it passed, and who signed off. That traceability is what makes the pilot reviewable as evidence, and what makes the methodology repeatable across the dependent components that follow.
Dead code analysis in legacy modernization: What we found in a 654,273-line codebase
On one of our client engagements, we ran a deep dead code analysis against a Java codebase of 654,273 lines. Roughly 275,000 of those lines sat in the business-logic layer that had been auto-translated from COBOL by a previous modernization vendor. After deep static and semantic analysis, we estimated that between 120,000 and 150,000 of those lines would not exist in a hand-written Java equivalent. Nearly half the code carried no semantic weight.
What matters more than the numbers is how we got to them, and why no off-the-shelf static analyzer would have produced the same answer. The ratios here are specific to this particular auto-translated project. Hand-written legacy systems behave very differently. Without structured understanding of the codebase before transformation, none of this would have surfaced, and the modernization plan would have been built around the wrong codebase.
Why understanding comes before transformation
Modernization teams routinely jump from "we have legacy code" to "let's prompt an AI to rewrite it." That approach fails at enterprise scale for a simple reason: the first question is not how do we migrate but what do we actually have.
This is also where the difference between prompt engineering and a modernization workflow becomes concrete. A prompt is a single instruction handed to a model. A workflow is a repeatable, governed sequence of operations with structured inputs, validated outputs, and traceable evidence. Prompts produce snippets. Workflows produce decisions that a CTO can defend in a steering committee.
Before any transformation, you need structured knowledge of the system you're working with: business documentation, dependency maps, architectural reconstruction, static and semantic findings. That knowledge becomes the substrate for every downstream change. Business logic reconstruction and dependency mapping answer what is worth migrating. Dead code analysis answers a related but different question: how much of what you see is actually real?
A transformation pipeline applied to a codebase you don't understand is a parallel waste machine. It will faithfully migrate every dead branch, every ceremonial wrapper, every empty-string initializer into your modern stack. An AI agent asked to migrate tens of thousands of lines of structural boilerplate will produce tens of thousands of lines of structural boilerplate in the target language. The waste survives the transformation. This is also why "can AI agents migrate legacy code reliably?" is the wrong question. Reliability is a property of the workflow surrounding the agent, not of the agent itself.
Two categories of waste
Dead code analysis splits findings into two categories.
Strict dead code is lines whose execution has no observable effect. The IDE will usually flag these.
Translation overhead is lines that are syntactically alive but exist only because a mechanical translator emitted them. The IDE cannot see this because the surface code is well-formed; every statement looks like real work.
Static analysis tools handle the first category. The second is where the volume hides - and where modernization budgets quietly evaporate. Detecting it requires semantic reasoning, codebase-wide context, and pattern recognition that no IDE inspection provides.
The legacy codebase under analysis
The client owned a large back-office system originally written in COBOL. A prior modernization vendor had performed a mechanical COBOL-to-Java translation through a decompilation toolchain. The output Java code compiled and ran in production. There were no automated tests. The only validation performed at the time of translation was manual, and it had happened years before we arrived. By the time the system reached us, nobody on the team could fully describe what the code did - the institutional memory of the translation effort had moved on, and the surface code was opaque enough that no one was confident enough to touch it.
We began with the Understand phase, the first step of our modernization process, focused on reconstructing what the codebase actually does before any migration is scoped. The process runs on G.Tx, Grape Up's agentic platform for enterprise legacy modernization, which models Understand as a set of reusable workflows backed by AI agents, structured context, and engineering governance. The dead code analysis workflow produced the findings the rest of this article is built on.
What static analysis caught
Some of the dead weight was syntactically obvious: indicator-variable boilerplate left over from COBOL host-variable conventions, redundant explicit casts preserved from the bytecode, discarded DAO results, duplicate branches in if-chains, redundant re-initializations of locals. The IDE could see all of it. In this codebase the relevant inspections had been silenced because the warning count was unusable. A finding technically visible to static analysis behaved, in practice, as if it were invisible.
Integer stationOutInd = 0;
// ... no writes anywhere ...
if (stationOutInd != 0) { stationOut = ""; } // always false
Even with the IDE's help, the visible findings explained only a small fraction of the auto-translated layer. The bigger story sat behind what the IDE could not see.
What semantic analysis revealed
The architectural patterns were harder. Each one looked like ordinary Java to an analyzer. Each line allocated, called, or assigned something. The waste was architectural, not syntactic, and only became visible once we looked at the codebase as a whole.
The ValueHolder marshalling dance. Wrapper-class boilerplate emulating COBOL's BY REFERENCE. Every multi-output call became three lines of wrap-call-unwrap, often on the same variable repeatedly:
copyCountHolder = new ValueHolder(Integer.class, (Object) copyCount);
returnCode = printFilter.searchStationCopyCount(
	stationPrint, "DOCUMENT_TYPE_A", (ValueHolder<Integer>) copyCountHolder
);
copyCount = (Integer) copyCountHolder.getValue();
In idiomatic Java the same sites collapse to a return value, a record, or a small result class.
Section-global state emulation. COBOL paragraphs share state through working storage, a flat namespace visible to every paragraph. The translator preserved that model by giving each service module its own Context class and turning every former local variable into a context field accessed through a wrapping getter on every term of every expression.
this.getServiceContext().setBrand(this.getServiceContext().getBrandCode());
this.getServiceContext().getInvoice().setBrandCode(this.getServiceContext().getBrand());
The deeper finding came from cross-referencing reads and writes: many context fields were written by exactly one paragraph and read by exactly that same paragraph. They had no business being state at all. They were locals masquerading as state because the translator did not know the difference.
DTO bloat. COBOL PIC X(n) working-storage fields default to spaces, not null. The translator preserved the equivalent by initializing every Java string field to `""`. Every COBOL 01-level record became a Java DTO with one field, one getter, one setter, and one empty-string initializer per string field.
The IDE's redundant-initializer inspection only fires when the explicit value matches the JVM default. "" is not the default for String (which is null), so the inspection treated every empty-string initializer as intentional.
A few smaller patterns followed the same logic: identity assignments via UxRuntime.assign for COBOL MOVE statements that needed no coercion, and UxRuntime.memset calls on Java objects that did nothing. Each was invisible to static analysis because each looked like a real method call.
The same translator habits also produced latent correctness bugs, not just overhead. Methods that take a String parameter and reassign it across dozens of lines (a literal translation of COBOL BY REFERENCE) silently lose every write at return, because Java is pass-by-value for object references:
public void formatLetterMessage(Long period, Long invoiceId, String message) {
	// 50+ lines of work, repeatedly reassigning `message`
	message = StringUtils.replaceCharAt(message, charPos, ' ');
	// method ends — every write is lost
}
Elsewhere in the same codebase, the translator used ValueHolder precisely to emulate pass-by-reference correctly. The pattern of forgetting to wrap is the bug. Try/catch blocks that perform conditional database lookups and write a result through a setter, only to be overwritten by an unconditional setter immediately after the block, fall in the same category: dead code at the line level, latent defect at the behaviour level. In a system without automated tests, neither shape had any chance of being noticed.
Aggregate picture of the dead code
In this particular auto-translated codebase, strict dead code accounted for roughly 5–10% of the 275,000-line business-logic layer. Translation overhead accounted for another 35–45%. Together, roughly 45–55% of the auto-translated layer would not exist in a hand-written Java equivalent - between 120,000 and 150,000 lines of code carrying no semantic weight.
The bulk of that volume came from a small number of patterns:
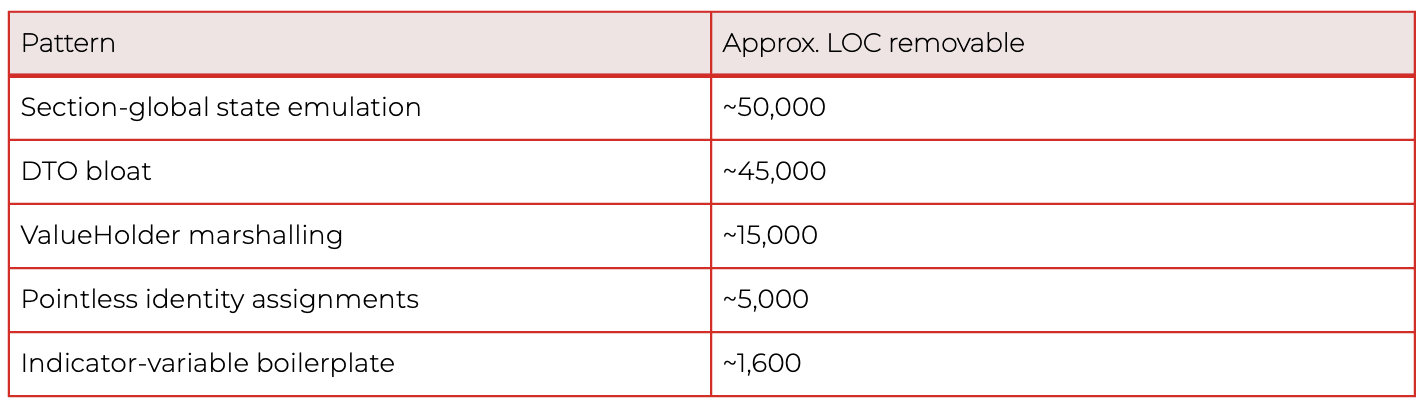
These ratios reflect this specific auto-translated project. Other codebases, especially hand-written legacy systems, distribute their waste very differently. The methodology generalizes; the percentages do not.
In the worst-affected individual methods, 30–50% of the body was dead or boilerplate at the line level. A developer reading those methods was spending up to one line out of every two on mechanical noise before reaching anything that described the actual business behaviour.
Why this changes the modernization conversation
- Migration cost estimation collapses by half when overhead is removed. Quoting "275,000 lines to migrate" anchors the budget. Quoting "approximately 130,000 lines of real logic, plus 145,000 lines of removable overhead" reframes the engagement entirely — both in scope and in sequencing. This is, in concrete terms, the ROI of a feasibility analysis for legacy modernization: half the scope you were about to budget for is not real.
- AI-assisted transformation amplifies whatever you feed it. An agent asked to migrate the ValueHolder dance will faithfully migrate the ValueHolder dance. The Understand phase puts the cleanup before the migration, not after.
- Test generation is more reliable on real code than on boilerplate. Auto-generated tests for dead branches and clobbered setters pass but verify nothing. Understand-phase outputs allow downstream test-generation workflows to skip dead surface area entirely — which matters even more in systems like this one, where no test suite existed and behaviour had to be reconstructed from code rather than from assertions.
- Static analysis alone is insufficient. The IDE saw a small fraction of the problem here. The remaining required semantic analysis aware of the translator's idioms.
- Modernizing in place is a real option. Not every legacy system needs to be rewritten or replatformed. Once dead code and hidden dependencies are mapped, in-place hardening like removing overhead, recovering documentation, restoring testability, is often the higher-ROI path. The decision to migrate, modernize in place, or split the system between the two should follow the analysis, not precede it.
- Human-in-the-loop validation remains mandatory. Several findings were latent correctness bugs hiding behind dead code. Auto-deleting them without engineering review would be reckless. The output of a dead code analysis workflow is a curated, traceable finding set, not a green-light-to-delete list.
How the G.Tx Understand operationalizes this
The dead code analysis workflow produces, for each finding, a classification of what is dead, the location in the codebase, and the rationale explaining why it qualifies as dead. Aggregate counts per classification are available as well, so engineering teams can see both the individual evidence and the overall distribution of waste across the codebase. Every classification is traceable back to source locations or runtime evidence.
And dead code is not only a code-level phenomenon. The same analytical lens applies one layer up: endpoints that no client has called in years, scheduled jobs that nobody remembers writing, service modules whose only consumer was decommissioned long ago, infrastructure quietly burning budget for traffic that no longer exists. Code-level dead code is a maintainability and correctness problem. Functionality-level dead code is a cost and risk problem. Both belonging the Understand phase, because both shape the same decision: what is worth migrating, what is worth hardening in place, and what should simply be turned off.
That last point matters for hallucination control. Models hallucinate when they infer from incomplete context. The artifacts produced during Understand, classified findings, traceable evidence, mapped dependencies, are exactly the grounding downstream agents need during transformation. Hallucination is reduced before any code is touched, because the model has real evidence to work with instead of having to guess at the codebase.
Lessons for legacy modernization
- Quantify before you migrate. The single most valuable artifact in a modernization engagement is a defensible number for real code volume. Without it, every estimate is fiction.
- Auto-translation defers cost; it does not eliminate it. A clean compile is not evidence of a maintainable codebase. In this engagement, half the code was overhead, and the only thing keeping that overhead in production was that nobody was confident enough to touch it. The code was unreadable, undocumented, and unverified. Removing anything felt riskier than leaving everything.
- The IDE is not enough. Roughly 90% of the waste in this codebase was invisible to off-the-shelf static analysis. Semantic, codebase-aware analysis closed the gap.
- Dead code is a correctness signal, not just a hygiene problem. Several of the patterns we found were latent bugs the team did not know they had.
- Modernization is an orchestration problem. No single prompt, agent, or tool produces findings of this kind. It takes reusable workflows, curated context, structured outputs, and disciplined human review.
Modernization decisions made without an Understand phase are decisions made about the wrong codebase. In this engagement, the "wrong codebase" was roughly twice the size of the real one, and the real one was the only one worth migrating.
---
If you suspect your own auto-translated or long-lived legacy system is carrying overhead nobody has measured, the G.Tx Understand phase exists precisely for that conversation. Reach out - we'll start with a focused feasibility analysis for legacy modernization and produce a defensible picture of what you actually have.
Sovereign AI for enterprises: Why governing your AI infrastructure is becoming a strategic priority
Artificial intelligence is becoming part of the operational backbone of modern organizations. What began as experimentation with generative models is now powering customer platforms, internal knowledge systems, software development workflows, and automated decision processes. According to the 2025 McKinsey Global Survey, 88% of organizations now use AI in at least one business function.
Most of these systems rely on frontier model providers such as OpenAI, Anthropic, or Google. These platforms have made advanced AI capabilities widely accessible and significantly accelerated adoption across industries. As a result, much of the enterprise AI discussion has focused on model performance and selecting between providers.
However, as AI becomes embedded in operational systems, a more fundamental question is emerging. The key issue is no longer simply which model an organization uses, but how the organization governs the way AI interacts with its data, systems, and infrastructure - a challenge at the core of what is now called sovereign AI.
Organizations have faced similar questions before. Over the past decade, responsibility for operating key parts of the technology stack shifted across different layers - first through virtualization platforms and later through cloud infrastructure. Today, a similar discussion is emerging at a new layer: the AI runtime itself.
What is sovereign AI? Governance as infrastructure strategy
As AI systems move from experimentation into production environments, governance becomes critical - particularly for organizations handling sensitive data or deploying AI at scale. This is where the concept of sovereign AI begins to emerge.
Sovereign AI refers to an organization's ability to control the data, models, and infrastructure used to build and operate AI systems - ensuring that AI capabilities remain under the governance and regulatory jurisdiction of the enterprise, rather than delegated entirely to external model providers.
In practice, however, most enterprises cannot fully own or manage every layer of the AI stack, especially when relying on external frontier models.
Instead, many organizations pursue a practical form of sovereign AI: ensuring that AI capabilities are integrated, managed, and monitored within their own environments according to enterprise policies and regulatory requirements.
Implementing this approach typically requires introducing a platform layer that governs how AI services are accessed and used across enterprise systems - often referred to as the AI control plane.
The enterprise AI control plane: Architecture and core components
The AI control plane sits between enterprise applications and model providers, managing how AI capabilities are accessed and used across the organization.
Typical components of an enterprise AI control plane include:
- AI gateway - routes requests to multiple models through a unified interface, enabling multi-model strategies without rewriting application logic
- Knowledge layer - vector databases and retrieval systems that allow models to interact with enterprise knowledge sources (Retrieval-Augmented Generation / RAG)
- Agent runtime - infrastructure for operating AI agents that interact with internal systems and workflows
- Governance and guardrails - policies that regulate how AI systems access sensitive data and how outputs are validated, critical for GDPR and AI Act compliance
- Model serving - capabilities for hosting open or specialized models within the organization's own infrastructure when required
Together, these components enable organizations to integrate multiple AI models while ensuring that AI usage follows enterprise policies and operational standards.
Sovereign AI infrastructure: OpenStack and Kubernetes as the foundation for on-premise AI workloads
Infrastructure limitations are one of the primary barriers to scaling AI. Recent surveys show that 82% of organizations say their current infrastructure cannot efficiently support on-premise AI workloads, while 80% identify data sovereignty as a major challenge for AI modernization.
Operating an AI control plane requires infrastructure where organizations can run AI workloads within their own operational and regulatory boundaries. Many enterprises build this foundation using open technologies rather than proprietary AI platforms.
A typical sovereign AI infrastructure stack includes:
- OpenStack for compute, storage, and networking - providing the private cloud foundation for AI workloads
- Kubernetes for orchestrating AI workloads and platform services, including GPU scheduling
- Open-source tooling for model serving, observability, and security
Because these technologies are open and vendor-neutral, organizations retain flexibility in how their infrastructure evolves while avoiding dependence on proprietary AI platforms.
Such infrastructure can run in private data centers, sovereign cloud environments, or infrastructure operated by trusted regional providers in Europe, enabling organizations to host sensitive AI workloads while still integrating external models when appropriate.
Cloudboostr: An EU-built platform for sovereign AI deployments
Platforms such as Cloudboostr - developed by Grape Up, a European cloud-native software company - provide an enterprise-ready foundation for implementing this architecture.
At the infrastructure layer, Cloudboostr delivers OpenStack-based compute, storage, and networking deployed either within an organization's own environment or through trusted European infrastructure providers.
On top of this foundation, the platform provides a production-grade Kubernetes runtime for operating AI workloads and platform services.
Cloudboostr also includes an AI enablement layer supporting:
- multi-model access through an AI gateway
- model serving and inference capabilities
- governance and guardrails for AI operations
- agent runtimes for intelligent workflows
- enterprise knowledge integration through RAG systems
Built on upstream open-source technologies and designed for European regulatory environments - Cloudboostr enables organizations to integrate external AI models while maintaining oversight of their data, infrastructure, and AI operations.
Conclusion
Artificial intelligence is rapidly becoming a foundational capability across modern organizations.
As AI systems move deeper into operational workflows, the challenge is no longer simply accessing powerful models. The critical question is how organizations manage the way those models interact with their data, systems, and infrastructure.
Sovereign AI provides a framework for addressing this challenge. While full ownership of every layer of the AI stack may not be realistic for most enterprises, organizations can still ensure that AI services operate within their governance and regulatory boundaries.
By introducing an AI control plane and building infrastructure on open technologies, enterprises can combine access to frontier models with operational oversight of how those models are used.
In the long run, the most resilient AI strategies will not depend on a single model provider or ecosystem. They will allow organizations to operate across multiple models while maintaining governance over their data, infrastructure, and AI runtime. For European enterprises, this combination of open infrastructure and AI governance is precisely what sovereign AI is designed to deliver.
Sovereign AI in Europe: Regulatory context across DACH, CEE, and regulated industries
Sovereign AI is not an abstract concept for European enterprises - it is increasingly shaped by a specific and evolving regulatory landscape that directly determines how AI systems must be designed, deployed, and governed.
EU AI Act: The compliance baseline
The EU AI Act, entering into force in stages from 2024 to 2026, introduces risk-based obligations for AI systems deployed within the EU. High-risk AI systems - including those used in HR, credit scoring, critical infrastructure management, and public services - require documentation, human oversight, data governance controls, and auditability. For enterprises deploying AI in these domains, a sovereign AI control plane is not optional infrastructure: it is the technical means by which EU AI Act compliance can be demonstrated.
GDPR and AI data flows
Processing personal data through external AI model providers raises complex GDPR questions around data transfer, processor relationships, and the use of personal data for model training or fine-tuning. Organizations in Germany, Austria, Poland, and other EU member states where data protection enforcement is active face material compliance risk when sensitive data traverses infrastructure outside EU jurisdiction without appropriate safeguards. A sovereign AI infrastructure layer mitigates this risk by keeping data processing within controlled environments.
Sector-specific drivers in DACH and CEE
In Germany, financial institutions regulated by BaFin and healthcare organizations subject to KHZG digital transformation requirements face specific obligations around AI system oversight and data localization. In Austria and Switzerland, similar frameworks apply to public sector AI deployments. Across CEE - including Poland (KNF-regulated financial sector), Czech Republic, and Romania - NIS2 transposition and national AI strategies are creating new infrastructure expectations for organizations operating in critical sectors.
Cloudboostr, built and operated within the EU, is positioned to support sovereign AI deployments across these markets - providing the infrastructure and AI enablement layer that European enterprises need to meet both regulatory obligations and operational AI ambitions.
FAQ: Sovereign AI, enterprise AI governance, and infrastructure
1. What is sovereign AI and why is it relevant for enterprises?
Sovereign AI refers to an organization's ability to control the data, models, and infrastructure through which it builds and operates AI systems. It is relevant for enterprises because as AI becomes embedded in operational workflows, decisions about which models process which data - and under whose infrastructure governance - carry regulatory, legal, and strategic implications. Sovereign AI provides a framework for maintaining oversight without abandoning access to frontier models.
2. What is an AI control plane and how does it support AI governance?
An AI control plane is a software layer that sits between enterprise applications and AI model providers, managing how AI capabilities are accessed, governed, and monitored across the organization. It typically includes an AI gateway for multi-model routing, a knowledge layer for RAG-based enterprise data integration, an agent runtime, and governance guardrails. It enables organizations to enforce enterprise policies - including data access controls and output validation - across all AI usage, regardless of which underlying model is being called.
3. How does the EU AI Act affect enterprise AI deployments?
The EU AI Act classifies AI systems by risk level and imposes obligations on high-risk AI applications, including documentation, human oversight, data governance, and auditability requirements. Enterprises deploying AI in regulated domains such as HR decisions, credit risk, critical infrastructure, or public services must be able to demonstrate compliance. An AI control plane with built-in governance and guardrails provides the technical foundation for meeting these obligations.
4. Can enterprises use OpenAI, Anthropic, or other frontier models in a sovereign AI architecture?
Yes - sovereign AI does not require replacing frontier models. The goal is to ensure that access to and usage of those models is governed by enterprise infrastructure rather than delegated entirely to the model provider. An AI control plane enables organizations to route requests to frontier models while ensuring that sensitive data is not sent externally without appropriate controls, and that enterprise policies govern how model outputs are used and validated.
5. What infrastructure is needed to run AI workloads on-premise or in a sovereign cloud?
Running AI workloads on-premise or in a sovereign cloud typically requires GPU-enabled compute infrastructure, a container orchestration layer (Kubernetes), a model serving framework, and supporting tooling for observability and security. OpenStack is widely used as the private cloud layer providing compute and storage. Platforms such as Cloudboostr bundle these components into an enterprise-ready stack optimized for European regulatory environments.
6. What is the difference between sovereign AI and on-premise AI?
On-premise AI refers to running AI workloads on infrastructure physically located within an organization's facilities. Sovereign AI is a broader concept that encompasses governance, data jurisdiction, and regulatory alignment - not just physical location. AI can be sovereign even if it runs in a third-party data center, provided the infrastructure is operated under the right legal jurisdiction, the data does not leave defined boundaries, and the organization maintains governance control. Conversely, on-premise infrastructure is not automatically sovereign if the software stack is controlled by a foreign vendor.
7. How does Cloudboostr support sovereign AI deployments in European enterprises?
Cloudboostr provides an integrated OpenStack and Kubernetes platform designed for EU regulatory environments, combined with an AI enablement layer that includes an AI gateway, model serving, and governance guardrails. Developed by Grape Up and deployable on-premises or through trusted European infrastructure providers, it enables enterprises to build a sovereign AI foundation that supports both open-source and frontier model integration under full infrastructure governance.
Escaping VMware proprietary virtualization lock-in: How enterprises are moving to open cloud infrastructure
For more than a decade, proprietary virtualization platforms - VMware chief among them - formed the backbone of enterprise data centers. They delivered consolidation, operational consistency, and a familiar operating model that many organizations standardized on. Over time, they became the default infrastructure layer for private environments.
That model is now being reassessed - not because virtualization has stopped working, but because its economic and contractual foundations have changed.
Recent industry surveys indicate that 59% of enterprises reported virtualization cost increases of 25–49% following Broadcom's acquisition of VMware, with some organizations experiencing significantly higher adjustments under the new subscription structure. In parallel, 73% of customers initially expected their costs to more than double, even if only a portion ultimately experienced increases at that level.
A 30–50% increase in foundational infrastructure cost materially impacts IT budgets. For many organizations, this has triggered renewed scrutiny of their virtualization strategy.
While cost escalation is the immediate concern, it also exposes a broader issue: the degree of architectural dependency embedded in the current model.
VMware cost increases: Why vendor lock-in is now a strategic problem
If pricing had increased marginally, most enterprises would likely have absorbed the impact without reconsidering architecture. At higher levels of escalation, infrastructure economics become a strategic conversation.
The primary problem is financial -but the ability for such financial shifts to occur is rooted in structural dependency.
When the proprietary virtualization control plane belongs to a single vendor:
- Pricing models can change unilaterally - as demonstrated by the post-acquisition VMware subscription restructuring.
- Licensing terms may be restructured
- Upgrade paths are tied to vendor roadmaps
- Switching costs limit negotiation leverage
- Workload portability is constrained by ecosystem coupling
VMware migration strategies: Three response options for enterprises
When organizations reassess their virtualization strategy, three primary paths tend to emerge.
1. Optimize and renegotiate
This approach directly addresses immediate cost pressure and may be sufficient for organizations prioritizing short-term stability. However, it does not materially reduce long-term exposure to vendor-driven pricing or licensing changes.
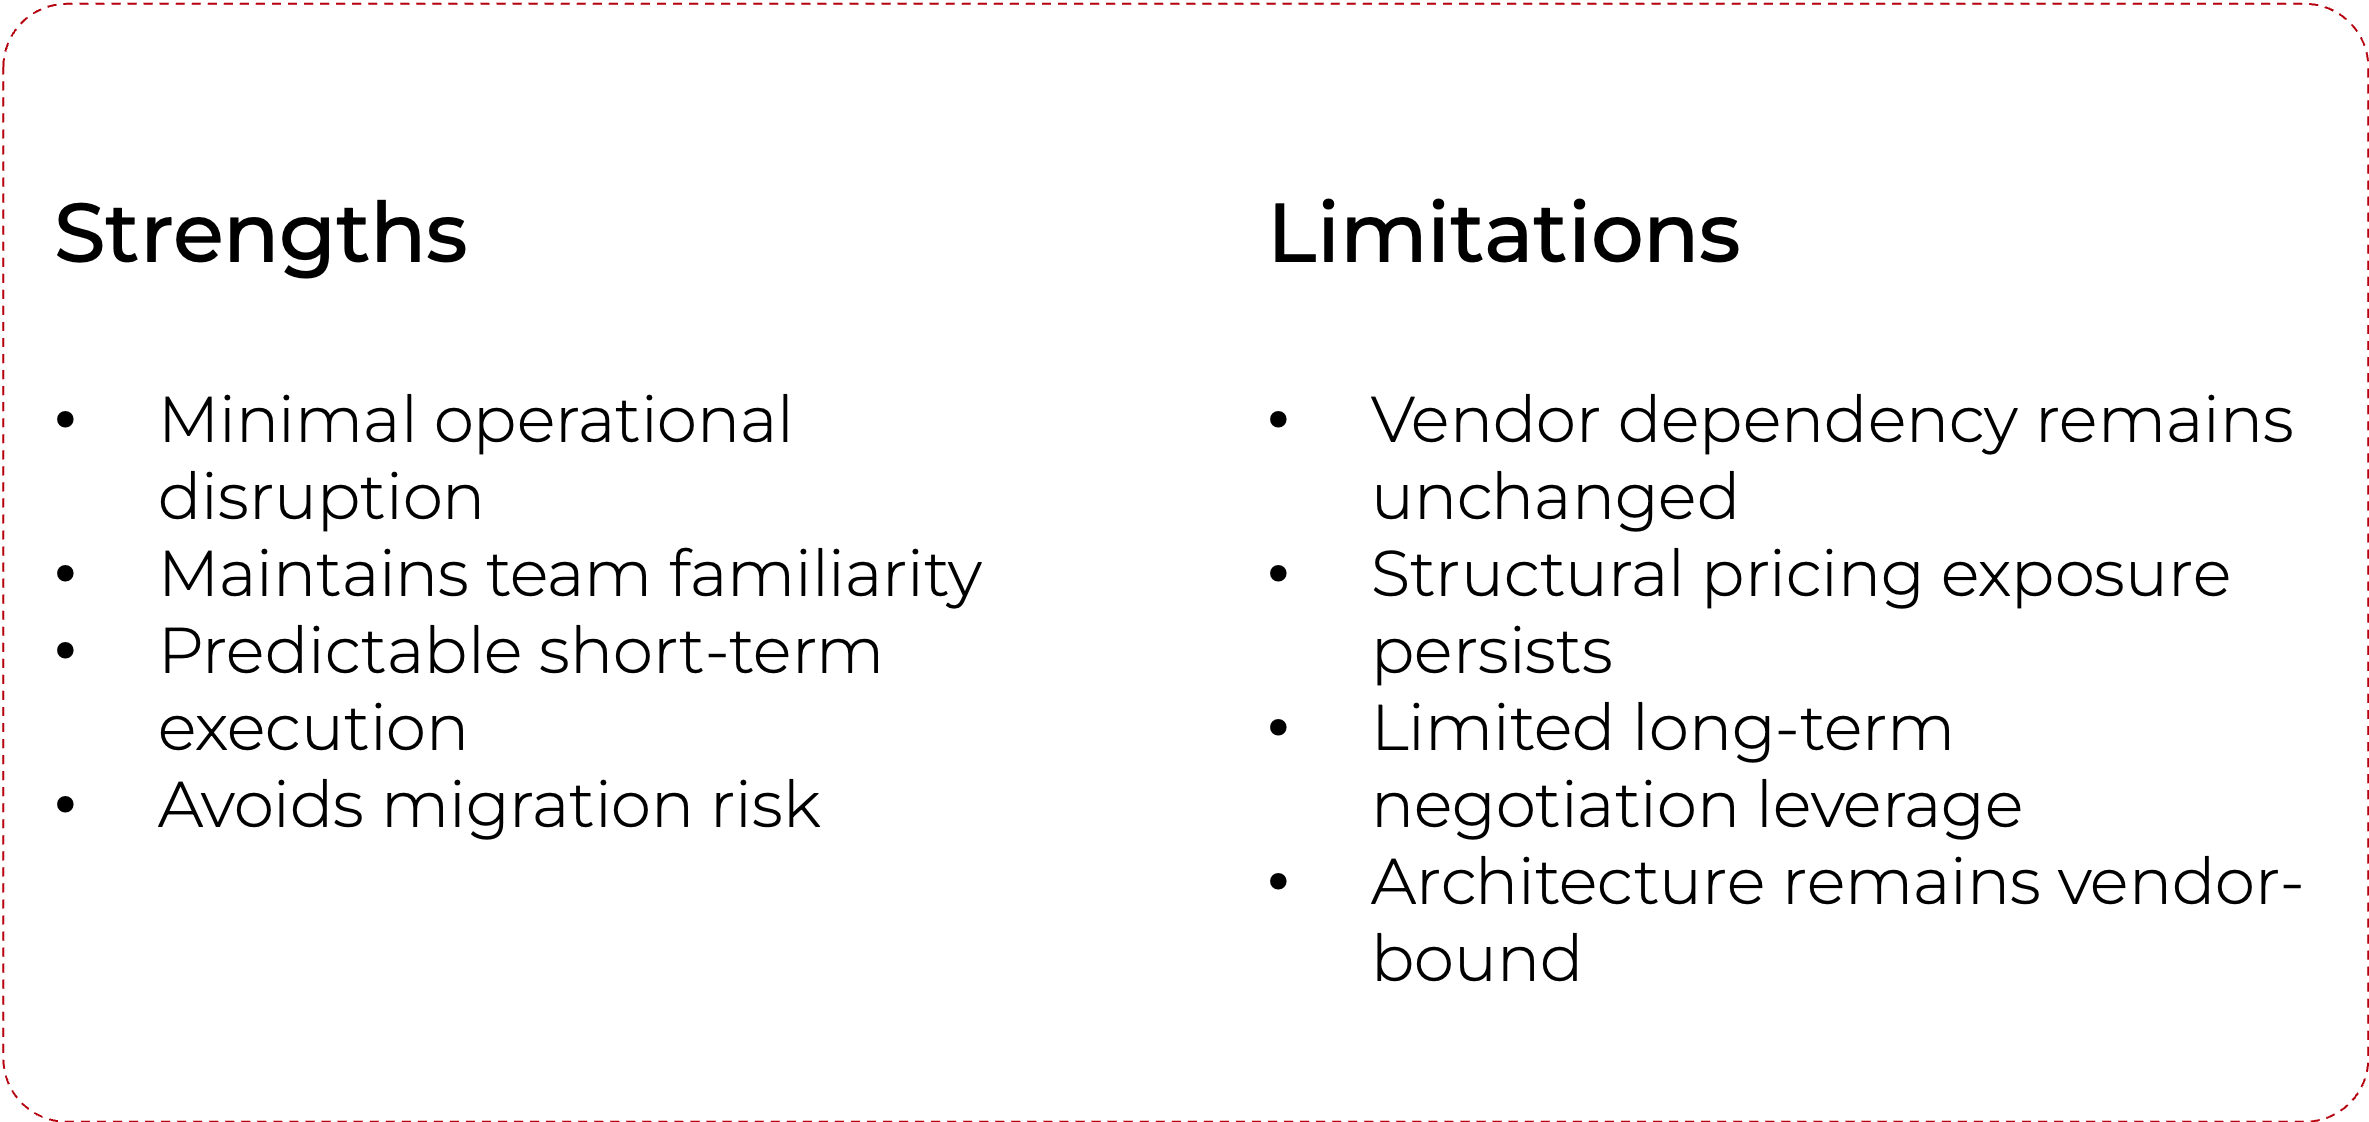
2. Gradual diversification
Diversification introduces optionality and may improve leverage. At the same time, maintaining parallel platforms can increase operational complexity unless there is a clear long-term architectural destination.

3. Public cloud replatforming
Migrating to public cloud can address infrastructure ownership concerns and may align with broader transformation initiatives. However, it typically shifts dependency rather than eliminating it, and cost predictability at scale can become a new challenge.
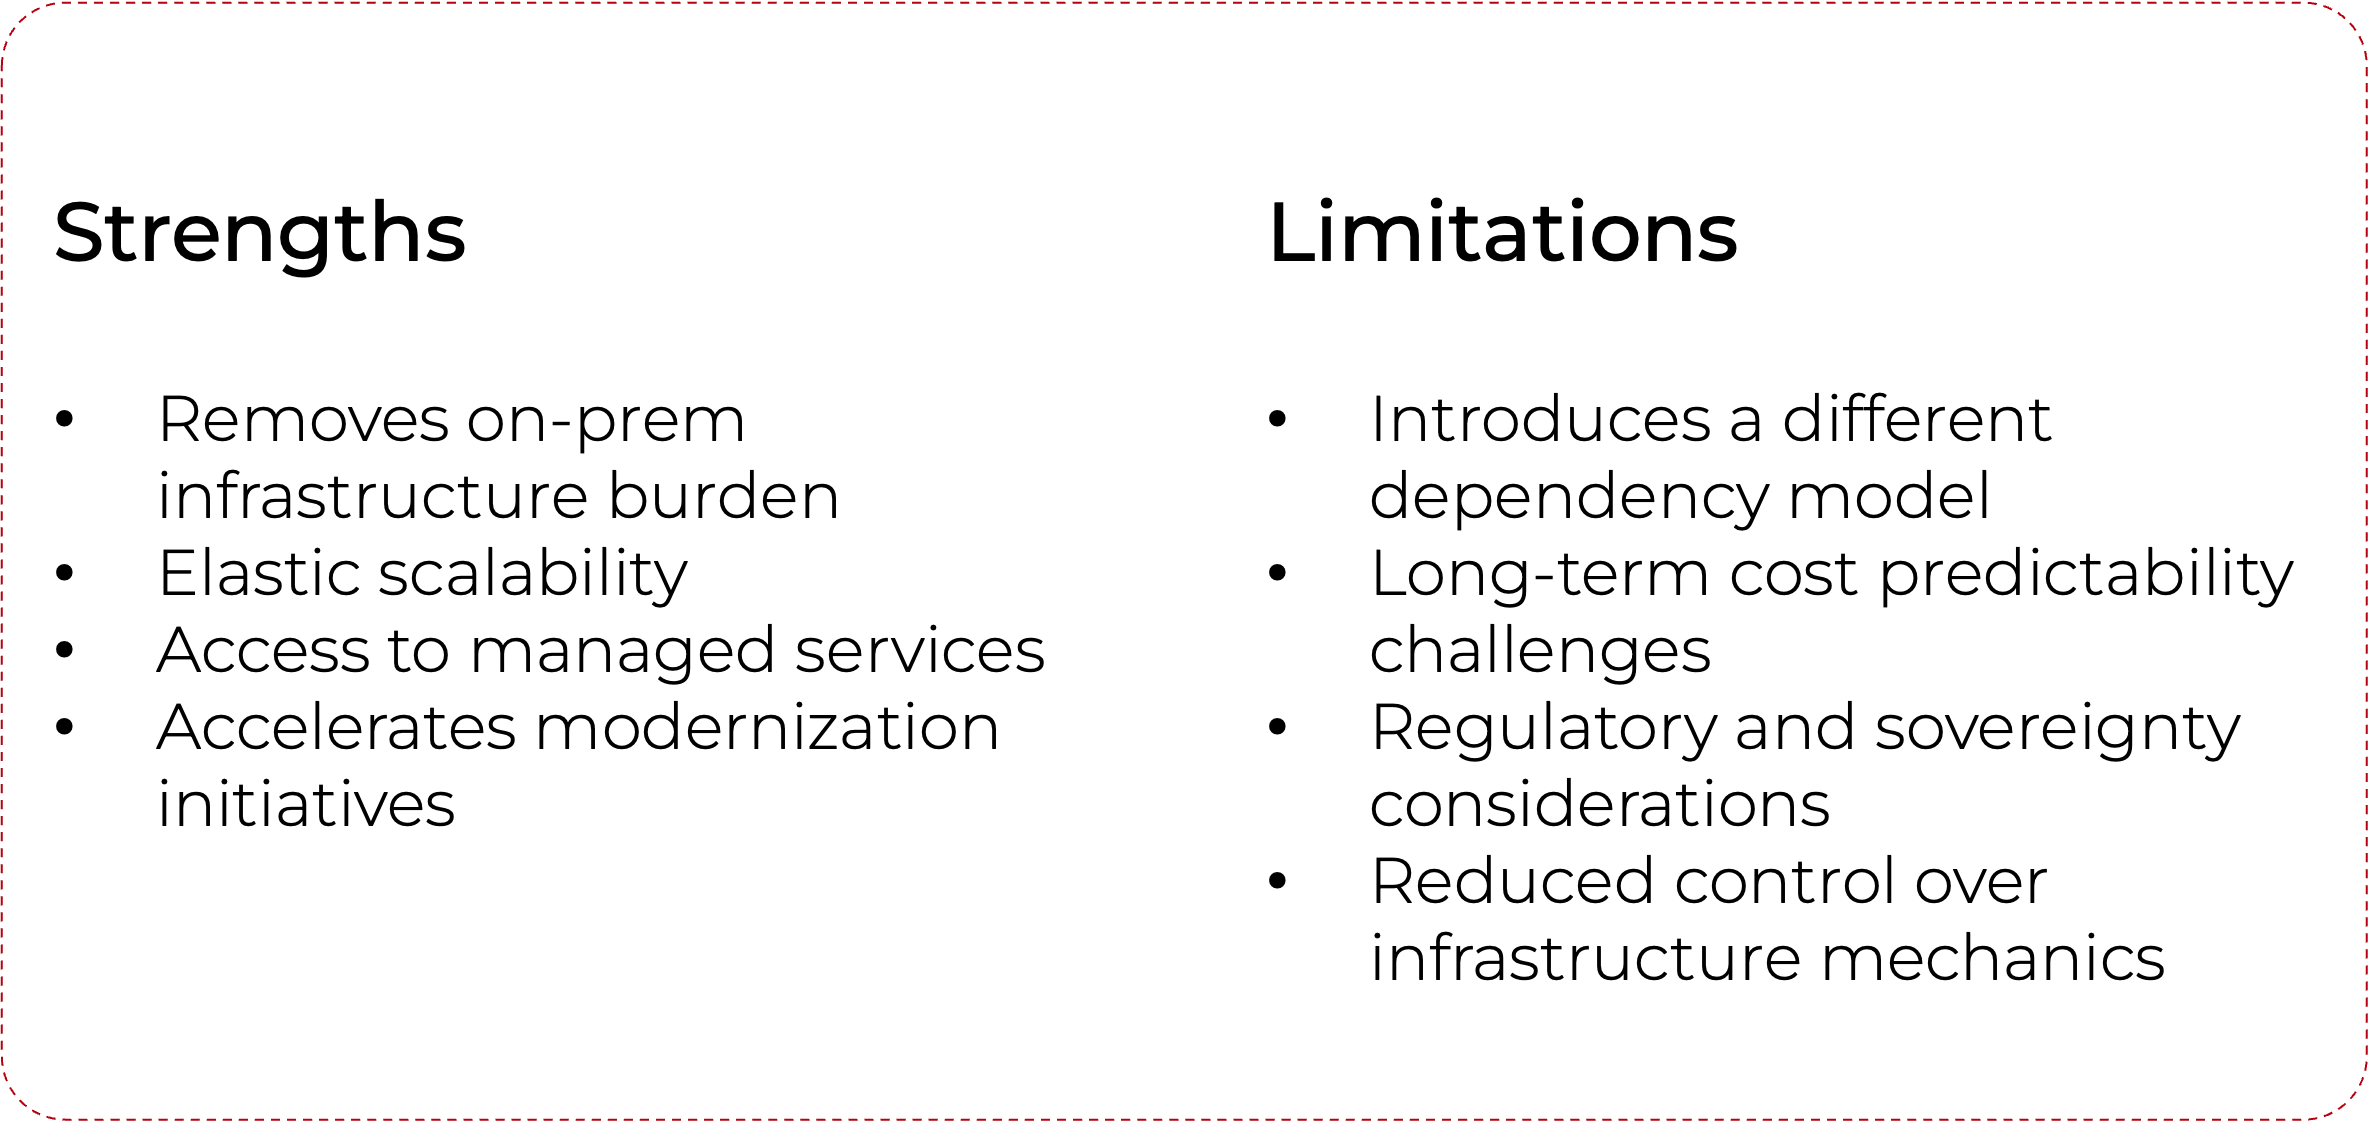
OpenStack and Kubernetes: The open cloud infrastructure alternative to VMware
An alternative approach is an open infrastructure model built on open standards such as OpenStack and Kubernetes.
This model is not simply a replacement of one hypervisor with another. It represents a redesign of the control plane governing infrastructure provisioning, scaling, and lifecycle management.
In practice, it:
- Eliminates dependence on per-CPU proprietary virtualization licensing -including VMware's new subscription-based model
- Automates infrastructure lifecycle management via APIs
- Treats infrastructure as programmable and extensible
- Supports hybrid deployment models
- Aligns virtual machine workloads with cloud-native orchestration patterns
Unlike incremental mitigation strategies, this approach addresses both immediate economic concerns and long-term structural exposure. By reclaiming control of the control plane, organizations reduce the likelihood that a single commercial decision will significantly alter their infrastructure cost model in the future.
When to migrate away from proprietary virtualization: Enterprise decision criteria
A structural redesign of the infrastructure control plane-such as migrating from VMware to an open cloud model -becomes particularly relevant for organizations where infrastructure decisions have long-term economic and operational implications.
This is most often the case for enterprises that:
- Operate large-scale private or hybrid infrastructure environments
- Require predictable long-term infrastructure economics
- Are modernizing toward cloud-native, data, andAI-driven workloads
- Treat infrastructure as a strategic platform rather than a commodity utility
For such organizations, reducing dependency on proprietary virtualization platforms like VMware is less about replacing one technology with another and more about establishing a sustainable foundation for future workloads and infrastructure evolution.
Cloudboostr: An enterprise-grade EU alternative to VMware for open cloud infrastructure
For organizations that want to move from architectural intent to implementation, Cloudboostr - developed by Grape Up, a European cloud-native software company -represents a practical realization of the open cloud infrastructure model described above.
Cloudboostr is an EU-built open cloud foundation combining:
- OpenStack-based private cloud infrastructure
- A production-ready Kubernetes runtime
- Automated lifecycle management and centralized operations
- Built-in observability, security, and governance
- AI enablement capabilities for data- and model-driven workloads
It can be deployed on-premises or through trusted EU-based infrastructure partners, with a focus on sovereignty, regulatory alignment, and open standards -making it particularly well-suited for enterprises in DACH and CEE markets operating under strict data residency requirements.
Rather than introducing another proprietary layer, Cloudboostr packages upstream open-source components into a structured, enterprise-ready platform. In doing so, it provides a concrete pathway for organizations seeking to reduce VMware lock-in while retaining operational control and modern cloud-native capabilities.
Conclusion
Recent VMware pricing shifts have brought infrastructure economics back into executive focus. While cost increases are the immediate concern, they have also revealed how tightly many organizations are bound to a single infrastructure control model.
Ultimately, the decision is less about virtualization technology and more about governance: how much control an organization wants over the economics and lifecycle of its core infrastructure.
Cost pressure may initiate the conversation, but architectural control determines its long-term outcome. For enterprises ready to act, open cloud infrastructure - built on OpenStack and Kubernetes - offers a proven, standards-based path forward.
FAQ: Frequently asked questions about VMware lock-in and open cloud migration
1. What are the main alternatives to VMware after the Broadcom acquisition?
The most widely adopted VMware alternatives include OpenStack for private cloud infrastructure, Proxmox VE for smaller environments, and open cloud platforms such as Cloudboostr that bundle OpenStack and Kubernetes into an enterprise-ready stack. Public cloud migration (AWS, Azure, GCP) is also common, though it shifts rather than eliminates vendor dependency.
2. How much have VMware licensing costs increased under Broadcom?
Industry surveys indicate that 59% of enterprises reported cost increases of 25–49% following Broadcom's acquisition of VMware. Key changes include the elimination of perpetual licenses, a shift to subscription-only bundles, and minimum core requirements -all of which have increased total cost of ownership for many customers.
3. What is OpenStack and can it replace VMware in an enterprise environment?
OpenStack is an open-source cloud infrastructure platform that manages compute, storage, and networking resources. It is widely used by telecoms, financial institutions, and public sector organizations as a VMware alternative. Enterprise deployments typically require a supported distribution or a managed platform such as Cloudboostr to achieve the operational maturity needed in production environments.
4. How long does it take to migrate from VMware to an open cloud infrastructure?
Migration timelines vary significantly based on environment size, workload complexity, and the chosen migration approach. A phased migration for a mid-sized enterprise typically spans 6–18 months, with initial workloads migrated within the first quarter. Structural redesign projects, including control plane replacement, may require longer planning horizons but are increasingly common for large-scale VMware environments.
5. What is vendor lock-in in virtualization, and why is it a risk?
Vendor lock-in in virtualization refers to an architectural dependency on a proprietary platform's APIs, tooling, licensing model, and ecosystem -making it difficult or costly to switch vendors. The risk is that pricing, licensing terms, or product direction can change unilaterally, as demonstrated by post-Broadcom VMware changes, with limited ability for customers to respond quickly.
6. Is OpenStack suitable for regulated industries with EU data sovereignty requirements?
Yes. OpenStack is widely deployed in regulated industries, including banking, insurance, healthcare, and public sector, precisely because it can be operated entirely on-premises or with EU-based partners -fully satisfying GDPR, NIS2, and national data residency requirements. EU-built platforms like Cloudboostr are specifically designed with these regulatory considerations built in.
7. What is the difference between migrating to public cloud and adopting an open cloud model?
Public cloud migration moves workloads to a hyperscaler (AWS, Azure, GCP), trading on-prem infrastructure for managed services -but introducing a new form of vendor dependency and variable cost at scale. An open cloud model, by contrast, retains private infrastructure control using open-source technology, giving organizations predictable economics, data sovereignty, and the ability to evolve the platform without vendor permission.