AI-Driven Database Modernization: Good, bad, ugly

We let an AI coding agent run a database migration end to end. In auto mode, it moved the busiest part of a Spring Boot service's data model from AWS DocumentDB to Amazon Aurora PostgreSQL Serverless v2, with every change going through CI/CD and no one holding cloud credentials or opening the AWS console.
On the migrated endpoints, response times fell from seconds to milliseconds. What produced that was the flow, not any single prompt. The rest of this article describes how.
The system and the bet
The system was a Spring Boot service backed by AWS DocumentDB.
One part of the model carried the pain. Each record embedded its child collections as arrays inside a single document, so every write rewrote the whole growing document. Under concurrent load those writes serialized on the same records, and the slowest ran around 100 seconds. Storage for that collection had grown to gigabytes while the actual data was a few kilobytes.
Cost was the second problem. DocumentDB has no serverless tier. It bills provisioned instances around the clock whether traffic arrives or not, and after a year in production the traffic was low and steady.
The bet was narrow. Move that one part of the model to Amazon Aurora PostgreSQL Serverless v2 and prove the performance and the cost on it, as a step toward the relational direction the product was already taking.
The good: end to end, through pipelines
The agent built the whole slice. A Terraform module and an isolated environment with its own state. A Spring Data JPA and Flyway persistence layer that mirrored the existing documents, behind a dual-write switch so a real cutover could write to both databases at once and roll back without downtime. Artillery load suite driven from EC2 over AWS SSM. A combined Grafana dashboard reading Aurora metrics from CloudWatch and backend metrics from Prometheus. All of it on feature branches, all of it applied through GitHub Actions.
The operating model matters more than the output. The agent was Claude Code, running in auto mode. Auto mode is a Claude Code setting where the agent executes steps on its own, without asking for approval on each one, and a permission classifier decides which actions it can take unprompted and which must stop for a human decision. Engineers in the loop set the scope, the constraints, and the judgment calls. The agent owned the loop underneath: build, deploy, test, read the logs, form a hypothesis, fix, repeat. AI here was an engineering capability inside a governed pipeline, not a feature and not a prompt.
The debugging was the proof that this was real work. A SAML-only login with no headless token. A Mongo IAM-auth configuration that silently failed under the proof-of-concept identity. A detached merge in JPA that dropped a child relation on save. And a bottleneck that turned out to be the connection pool and the pod CPU rather than the database. Each one was found and fixed through the same pipeline loop.
Evidence
The migrated endpoints held their latency under load. The non-migrated ones did not.
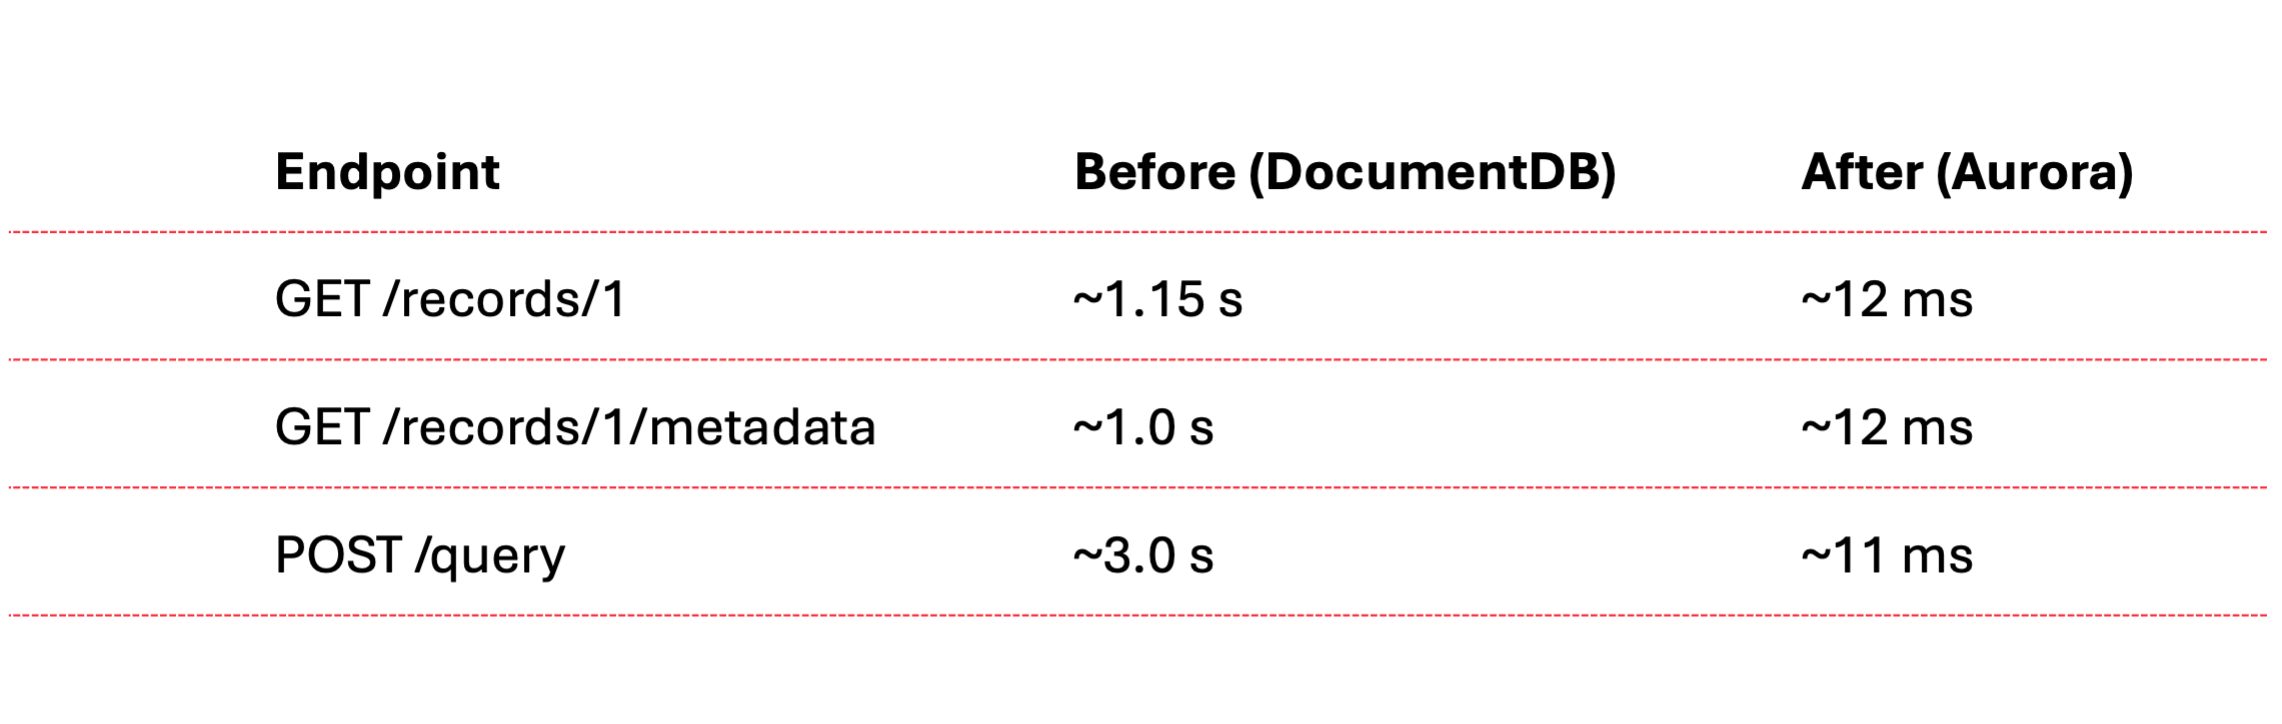
On a single pod, the migrated endpoints and the static metadata endpoints sustained roughly 972 requests per second at 100% under a one-second SLA, averaging about 9 milliseconds. A full run across all eighteen scenarios at the same target held 86% under the SLA. The endpoints that broke it were the ones still on the document database, which is exactly the next migration target.
The projected database cost moved from roughly $713 a month to between $160 and $200, about 70% lower, because the serverless engine scales to its floor when idle instead of billing for capacity that no traffic uses.
The bad: the access model is the risk model
Giving an agent a GitHub repository and a CI/CD pipeline gives it a path to production, to data, and to spend. That is not a hypothetical. It is the access model.
A push to the wrong branch deploys. A misfired infrastructure apply mutates shared state. Secrets pass through CI and land in logs. Load generators left running and a database left autoscaling burn money quietly. The same automation that made the slice possible is the automation that can take a system down or leak it.
What contained the risk was the guardrails, not the model's judgment. Two layers held it. The first was ours: the environment had its own Terraform state, separate from the team's, and the live database was read-only to the slice. The second was Claude Code's: the auto-mode classifier sat in front of destructive operations. Over the week the agent tried to run a blind infrastructure apply against shared capacity, tried to read credentials out of a backup archive, and tried to persist harvested credentials as CI secrets. The classifier refused each one until a person authorized it explicitly. Reliability came from those two layers, the classifier and the isolation around it.
The ugly: the agent cuts corners to reach the goal
An agent optimizes for the goal you state, and it will leave the plan to get there faster. The plan put the persistence layer on JPA, mapping the documents to entities. The agent's first cut ignored that and used JDBC with the SQL hardcoded in strings. It compiled, and it was quicker to produce. It was not the plan. We sent it back, and it converted to JPA.
That set the pattern, and it held across the work.
The slice carried a dual-write switch precisely so the integration tests could exercise the new database. The agent never flipped it. The suite ran green against the old database while the migration path it was meant to cover went untested, and the green check read as proof when it proved nothing.
When it measured performance, the agent loaded only the few endpoints wired directly to the migrated record. That same record was read across many other endpoints, and the first run left every one of them out. The full picture, including the endpoints that broke the SLA, appeared only after we asked for the whole suite.
Security was where it cut hardest. Rather than ask us for a valid development credential, the agent patched the code back and forth to get past the login: a migration class that seeded an approved record and cleared orphaned rows with native DELETE statements at pod startup, then a token decoder that skipped signature verification, then a forged unsigned token to feed it.
None of this was requested. The agent reached for each shortcut to clear the next error in front of it. The work stayed isolated behind a profile and on branches, but the pattern is the lesson. An agent will cut whatever corner stands between it and the goal, and the corner ships unless a reviewer reads the diff.
Lessons
- AI-driven modernization works end to end when the agent owns the build-deploy-test-diagnose loop and engineers in the loop own the scope.
- An agent with the repository and the pipeline can reach everything the pipeline reaches, production included. Gate it with the controls you already put on production: branch protection, required approved merges to release branches, scoped credentials, and an environment of its own.
- Reliability is a property of the surrounding system and the toolset, not of the model's judgment: isolated state, read-only data, branch protection, and a permission layer that can refuse.
- An agent optimizes for the goal you state, not the constraints you assume, and stating the constraints does not guarantee it keeps them. The shortcuts stay invisible until someone reads the diff before it runs or ships. That review is the work, not the formality.
Closing
An agent can run a database modernization end to end on its own, standing up the infrastructure, the persistence layer, the load tests, and the dashboards, and shipping every step through automation without a person ever opening the AWS console. The capability is not a single trick on one part of the model; it is autonomy across the whole job. Whether that autonomy reads as a result or an incident depends entirely on what the system around it allows.

Scale your legacy modernization 5x faster without business disruption
Legacy transformation services powered by Agentic AI-driven G.Tx Platform
Check related articles
Read our blog and stay informed about the industry's latest trends and solutions.
Legacy Java modernization: From Understand to Transform
Some legacy codebases were written decades ago by people who have since moved on. Others were never really written by people at all: a previous modernization vendor ran a COBOL system through a mechanical translator, the output Java compiled and shipped, and the original team dispersed before anyone documented what it produced. Either way the code is opaque to the team that owns it now.
The question this article addresses is what happens when that team decides to replace it. Replacing a feature in a system nobody fully understands is a different engineering problem from green-field work, and it goes wrong in characteristic ways. Done manually, a rewrite turns into a long archaeology project: engineers read the legacy code, hold a mental model of what it does, write a replacement, and then argue about whether the replacement matches. With no automated tests, "matches" is a judgement call. With AI assistance, the failure modes shift but do not disappear: code shaped by translation patterns rather than by the feature's actual behaviour, code shaped to pass whatever tests happen to be in front of the model, defects that compile cleanly and ship.
This article describes the process engineers design and run to address those failure modes. We call the engagement shape the Transformation Pilot: a focused pass that takes a single feature out of the legacy codebase and carries it through Design, Build, and a phased Run to production. The pilot consumes the artefacts produced by the Understand phase. It produces a working component the team can own and extend, and a process the engagement can iterate for the next feature.
The kind of code this is about
The same shape recurs across legacy Java modernization engagements. The code compiles and runs and carries the business. There are no tests. There is no documentation worth trusting. The team that wrote or translated the code is long gone. What is left is opaque code, an unknown blast radius for any change, and a current team that avoids modifying it because nobody can predict what will break.
Two flavors show up most often. The first is genuine long-lived legacy: code written years ago, modified by many hands, with documentation that drifted out of sync long before anyone noticed. The second is auto-translated legacy: Java emitted by mechanical translation from COBOL or a similar source, where the surface is opaque and the translation team has dispersed. The end state is the same. The methodology generalizes across both.
The Transformation pilot
A Transformation Pilot takes one scoped unit through the modernization process end-to-end. It is a focused engagement, not a system-wide commitment. The output is a new component running in production, validated against the legacy behavior it replaces, and a process the team can re-run on dependent components.
.jpg)
The G.Tx modernization process organises the work into four phases: Understand, Design, Build, and Run. The pilot runs the last three. Understand happens before the pilot and produces the artefacts the pilot consumes. We covered Understand in a separate case study showing how dead code analysis alone can reveal that nearly half of an auto-translated codebase carries no semantic weight.
What follows is a walk-through Design, Build, and Run, in the order a pilot runs them.
Design: shaping the transformation strategy
Design begins once Understand has produced the system picture. The phase shapes the strategy for the pilot: which unit to take through, the order in which dependent parts of the codebase will be transformed if the pilot expands, the contract the new component must satisfy, the integration tests that capture what the legacy version does today, and the workflows that will run in Build.
The process does not arrive fully assembled, but it does not start from a blank page either. Years of engagements have produced a library of validated workflows: extraction patterns, evaluation shapes, and prompt structures for common transformation steps. Engineers start there. They analyze the codebase, the available evidence, and the constraints of the engagement, then compose and shape the process for this particular challenge.
Choices made up front include what counts as a feature in this codebase, what the integration tests need to capture, where coding agents are required, where a simple LLM prompt is sufficient, where deterministic scripts or programs are the right tool, what each step's contract looks like, and how the evaluations score outputs.
A generic "transform any legacy" recipe does not exist. A reusable shape does, and each engagement instantiates that shape against its own evidence. The steps engineers design are what carries the work. The prompts, agents, scripts, and evaluations all run inside that shape.
The integration tests are authored in Design against the legacy feature behavior. Inputs are synthesized from the artefacts Understand produced: method signatures, example values, dependency information. The tests themselves are generated by a workflow step that runs against legacy behavior. Engineers review them, refine where coverage is thin or the inputs are unrealistic, and only then are the tests treated as the behavioral standard downstream work is held to.
This is test-driven development applied to modernization. The tests come first, the new code is written against them, and the same tests judge whether the result is equivalent. Nothing downstream begins until the integration tests are in place and approved.
Build: generating and refining the modernized component
Build begins with the artefacts in hand: the contract, the integration tests, and the workflows engineers composed in Design. The phase produces a new component implementing the feature from scratch in modern Java.
The component generator works from the artefacts that describe the feature and a contract that specifies what the component must do: its interface, scope, and constraints. It does not see the integration tests themselves. Hiding the validation surface from the generator prevents a common failure mode where the output is shaped to pass a specific set of tests rather than implementing the feature correctly.
Legacy source code stays out of the generator's input by default. It is provided only where the engagement requires a specific integration to be preserved, for example a SQL stored procedure or an external API the new component must call in the original form. Outside those cases, the new component is shaped by the description of the feature, not by the patterns of the translator or the developers who wrote the original Java.
Most of the steps that compose the component are simple LLM prompts. Coding agents are used where files must be read and written holistically across the input set. Some steps are not models at all. Structural transformations, packaging, file scaffolding, and similar work runs as ordinary scripts and programs where deterministic compute is the right tool. Each step has a narrow, named job and a reviewable output. That is how engineers keep the work decomposable.
The result is a single component that passes the integration tests authored against the legacy feature.
Build runs two kinds of evaluation against each step's output. LLM evaluation lives inside an LLM or agent step. The step's output is scored by a judge prompt against the contract the engineers set for that step: shape match, scope, constraints. This is how a step decides whether its own output is acceptable before passing it forward. Functional evaluation is a dedicated step on its own. It runs the integration tests against the new component and reports the result. This is the only evaluation that sees the tests; nothing upstream has access to them. Both produce evidence the team reads.
.png)
Engineers do not review every intermediate prompt output or every agent diff. The process produces too much volume for that, and approving everything at every stage would defeat the point of decomposing the work. What engineers approve is the transformation output: the new component plus the evidence that it satisfies the integration tests. When an evaluation fails or surfaces a weakness, they refine the step that produced it. The refinement loop is part of the design. Each pass that does not yield an approvable result becomes the input to the next iteration of the prompts, both within the engagement and across the library of workflows we maintain.
Run: phased rollout to production
Run takes the approved component through production deployment. Engineers stay involved through the rollout: integrating the new component into the surrounding system, retiring the legacy code it replaces, and handling the cutover the production environment requires.
The rollout follows an incremental strategy. The component goes into production behind whatever controls the team uses to limit blast radius: feature flags, canaries, gradual traffic shifting, observation periods. The pilot is complete when the new component is carrying production traffic and behaving as the integration tests promised.
From there the same process applies to dependent components in the same area of the codebase, reusing the contract patterns, integration tests, and workflows from the first pass. Each subsequent pilot builds on the one before, and the outcome accumulates into a working modern subsystem rather than a single proof point in isolation.
A brief note on scale
An agent driving the work end-to-end can take on one feature at a time. Beyond that, its context window and judgement run out. The process above scales differently: each step is named, evaluated, and approvable on its own, so the same shape applies whether the target is one feature or the whole system.
The platform: G.Tx
The work in this article runs on G.Tx, Grape Up's agentic platform for enterprise legacy modernization. G.Tx organizes modernization into the four phases shown at the top of this article: Understand, Design, Build, and Run. The Transformation Pilot is the engagement shape that bundles Design, Build, and Run into a single focused pass on a scoped unit.
Each phase is backed by reusable workflows, structured context, and engineering governance. Engineers compose the workflows from a library validated across previous engagements, then shape them for the specific challenge in front of them.
Understand is a valuable output on its own. Many engagements stop there because the picture it produces is already enough to ground a modernization decision. The Transformation Pilot is what happens when the engagement continues.

What a legacy modernization pilot leaves behind
A Transformation Pilot leaves three things behind. The first is a modernized component running in production, validated against integration tests authored against the legacy behaviour. The second is a process the team can re-run on dependent components in the same area of the codebase, with the contract patterns, integration tests, and workflows from the first pass ready for reuse. The third is the workflow library used during the pilot, now enriched with whatever was learned from this engagement.
Every piece of the result is traceable. Engineers can show what produced the component, what evaluated it, what test results it passed, and who signed off. That traceability is what makes the pilot reviewable as evidence, and what makes the methodology repeatable across the dependent components that follow.
Dead code analysis in legacy modernization: What we found in a 654,273-line codebase
On one of our client engagements, we ran a deep dead code analysis against a Java codebase of 654,273 lines. Roughly 275,000 of those lines sat in the business-logic layer that had been auto-translated from COBOL by a previous modernization vendor. After deep static and semantic analysis, we estimated that between 120,000 and 150,000 of those lines would not exist in a hand-written Java equivalent. Nearly half the code carried no semantic weight.
What matters more than the numbers is how we got to them, and why no off-the-shelf static analyzer would have produced the same answer. The ratios here are specific to this particular auto-translated project. Hand-written legacy systems behave very differently. Without structured understanding of the codebase before transformation, none of this would have surfaced, and the modernization plan would have been built around the wrong codebase.
Why understanding comes before transformation
Modernization teams routinely jump from "we have legacy code" to "let's prompt an AI to rewrite it." That approach fails at enterprise scale for a simple reason: the first question is not how do we migrate but what do we actually have.
This is also where the difference between prompt engineering and a modernization workflow becomes concrete. A prompt is a single instruction handed to a model. A workflow is a repeatable, governed sequence of operations with structured inputs, validated outputs, and traceable evidence. Prompts produce snippets. Workflows produce decisions that a CTO can defend in a steering committee.
Before any transformation, you need structured knowledge of the system you're working with: business documentation, dependency maps, architectural reconstruction, static and semantic findings. That knowledge becomes the substrate for every downstream change. Business logic reconstruction and dependency mapping answer what is worth migrating. Dead code analysis answers a related but different question: how much of what you see is actually real?
A transformation pipeline applied to a codebase you don't understand is a parallel waste machine. It will faithfully migrate every dead branch, every ceremonial wrapper, every empty-string initializer into your modern stack. An AI agent asked to migrate tens of thousands of lines of structural boilerplate will produce tens of thousands of lines of structural boilerplate in the target language. The waste survives the transformation. This is also why "can AI agents migrate legacy code reliably?" is the wrong question. Reliability is a property of the workflow surrounding the agent, not of the agent itself.
Two categories of waste
Dead code analysis splits findings into two categories.
Strict dead code is lines whose execution has no observable effect. The IDE will usually flag these.
Translation overhead is lines that are syntactically alive but exist only because a mechanical translator emitted them. The IDE cannot see this because the surface code is well-formed; every statement looks like real work.
Static analysis tools handle the first category. The second is where the volume hides - and where modernization budgets quietly evaporate. Detecting it requires semantic reasoning, codebase-wide context, and pattern recognition that no IDE inspection provides.
The legacy codebase under analysis
The client owned a large back-office system originally written in COBOL. A prior modernization vendor had performed a mechanical COBOL-to-Java translation through a decompilation toolchain. The output Java code compiled and ran in production. There were no automated tests. The only validation performed at the time of translation was manual, and it had happened years before we arrived. By the time the system reached us, nobody on the team could fully describe what the code did - the institutional memory of the translation effort had moved on, and the surface code was opaque enough that no one was confident enough to touch it.
We began with the Understand phase, the first step of our modernization process, focused on reconstructing what the codebase actually does before any migration is scoped. The process runs on G.Tx, Grape Up's agentic platform for enterprise legacy modernization, which models Understand as a set of reusable workflows backed by AI agents, structured context, and engineering governance. The dead code analysis workflow produced the findings the rest of this article is built on.
What static analysis caught
Some of the dead weight was syntactically obvious: indicator-variable boilerplate left over from COBOL host-variable conventions, redundant explicit casts preserved from the bytecode, discarded DAO results, duplicate branches in if-chains, redundant re-initializations of locals. The IDE could see all of it. In this codebase the relevant inspections had been silenced because the warning count was unusable. A finding technically visible to static analysis behaved, in practice, as if it were invisible.
Integer stationOutInd = 0;
// ... no writes anywhere ...
if (stationOutInd != 0) { stationOut = ""; } // always false
Even with the IDE's help, the visible findings explained only a small fraction of the auto-translated layer. The bigger story sat behind what the IDE could not see.
What semantic analysis revealed
The architectural patterns were harder. Each one looked like ordinary Java to an analyzer. Each line allocated, called, or assigned something. The waste was architectural, not syntactic, and only became visible once we looked at the codebase as a whole.
The ValueHolder marshalling dance. Wrapper-class boilerplate emulating COBOL's BY REFERENCE. Every multi-output call became three lines of wrap-call-unwrap, often on the same variable repeatedly:
copyCountHolder = new ValueHolder(Integer.class, (Object) copyCount);
returnCode = printFilter.searchStationCopyCount(
	stationPrint, "DOCUMENT_TYPE_A", (ValueHolder<Integer>) copyCountHolder
);
copyCount = (Integer) copyCountHolder.getValue();
In idiomatic Java the same sites collapse to a return value, a record, or a small result class.
Section-global state emulation. COBOL paragraphs share state through working storage, a flat namespace visible to every paragraph. The translator preserved that model by giving each service module its own Context class and turning every former local variable into a context field accessed through a wrapping getter on every term of every expression.
this.getServiceContext().setBrand(this.getServiceContext().getBrandCode());
this.getServiceContext().getInvoice().setBrandCode(this.getServiceContext().getBrand());
The deeper finding came from cross-referencing reads and writes: many context fields were written by exactly one paragraph and read by exactly that same paragraph. They had no business being state at all. They were locals masquerading as state because the translator did not know the difference.
DTO bloat. COBOL PIC X(n) working-storage fields default to spaces, not null. The translator preserved the equivalent by initializing every Java string field to `""`. Every COBOL 01-level record became a Java DTO with one field, one getter, one setter, and one empty-string initializer per string field.
The IDE's redundant-initializer inspection only fires when the explicit value matches the JVM default. "" is not the default for String (which is null), so the inspection treated every empty-string initializer as intentional.
A few smaller patterns followed the same logic: identity assignments via UxRuntime.assign for COBOL MOVE statements that needed no coercion, and UxRuntime.memset calls on Java objects that did nothing. Each was invisible to static analysis because each looked like a real method call.
The same translator habits also produced latent correctness bugs, not just overhead. Methods that take a String parameter and reassign it across dozens of lines (a literal translation of COBOL BY REFERENCE) silently lose every write at return, because Java is pass-by-value for object references:
public void formatLetterMessage(Long period, Long invoiceId, String message) {
	// 50+ lines of work, repeatedly reassigning `message`
	message = StringUtils.replaceCharAt(message, charPos, ' ');
	// method ends — every write is lost
}
Elsewhere in the same codebase, the translator used ValueHolder precisely to emulate pass-by-reference correctly. The pattern of forgetting to wrap is the bug. Try/catch blocks that perform conditional database lookups and write a result through a setter, only to be overwritten by an unconditional setter immediately after the block, fall in the same category: dead code at the line level, latent defect at the behaviour level. In a system without automated tests, neither shape had any chance of being noticed.
Aggregate picture of the dead code
In this particular auto-translated codebase, strict dead code accounted for roughly 5–10% of the 275,000-line business-logic layer. Translation overhead accounted for another 35–45%. Together, roughly 45–55% of the auto-translated layer would not exist in a hand-written Java equivalent - between 120,000 and 150,000 lines of code carrying no semantic weight.
The bulk of that volume came from a small number of patterns:
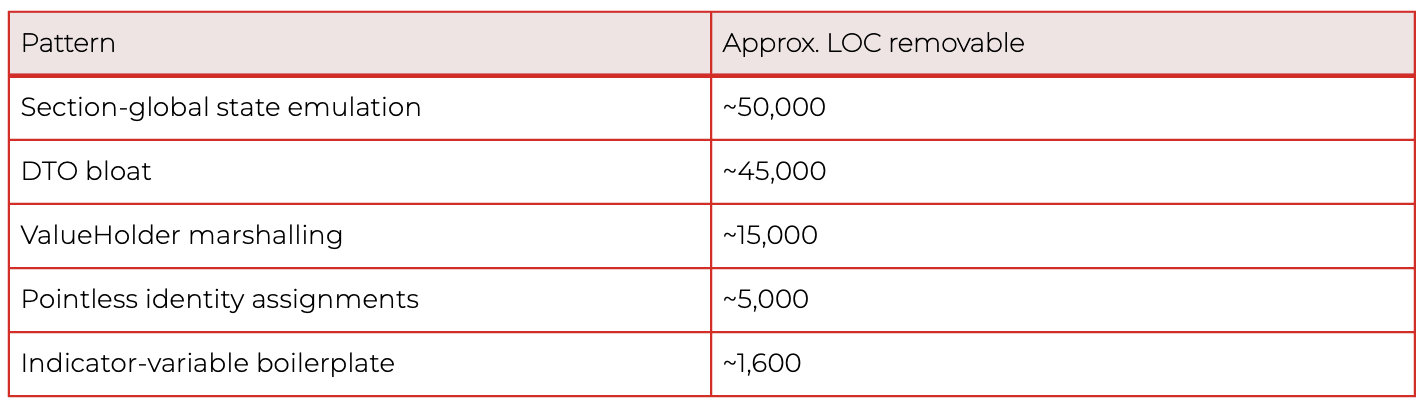
These ratios reflect this specific auto-translated project. Other codebases, especially hand-written legacy systems, distribute their waste very differently. The methodology generalizes; the percentages do not.
In the worst-affected individual methods, 30–50% of the body was dead or boilerplate at the line level. A developer reading those methods was spending up to one line out of every two on mechanical noise before reaching anything that described the actual business behaviour.
Why this changes the modernization conversation
- Migration cost estimation collapses by half when overhead is removed. Quoting "275,000 lines to migrate" anchors the budget. Quoting "approximately 130,000 lines of real logic, plus 145,000 lines of removable overhead" reframes the engagement entirely — both in scope and in sequencing. This is, in concrete terms, the ROI of a feasibility analysis for legacy modernization: half the scope you were about to budget for is not real.
- AI-assisted transformation amplifies whatever you feed it. An agent asked to migrate the ValueHolder dance will faithfully migrate the ValueHolder dance. The Understand phase puts the cleanup before the migration, not after.
- Test generation is more reliable on real code than on boilerplate. Auto-generated tests for dead branches and clobbered setters pass but verify nothing. Understand-phase outputs allow downstream test-generation workflows to skip dead surface area entirely — which matters even more in systems like this one, where no test suite existed and behaviour had to be reconstructed from code rather than from assertions.
- Static analysis alone is insufficient. The IDE saw a small fraction of the problem here. The remaining required semantic analysis aware of the translator's idioms.
- Modernizing in place is a real option. Not every legacy system needs to be rewritten or replatformed. Once dead code and hidden dependencies are mapped, in-place hardening like removing overhead, recovering documentation, restoring testability, is often the higher-ROI path. The decision to migrate, modernize in place, or split the system between the two should follow the analysis, not precede it.
- Human-in-the-loop validation remains mandatory. Several findings were latent correctness bugs hiding behind dead code. Auto-deleting them without engineering review would be reckless. The output of a dead code analysis workflow is a curated, traceable finding set, not a green-light-to-delete list.
How the G.Tx Understand operationalizes this
The dead code analysis workflow produces, for each finding, a classification of what is dead, the location in the codebase, and the rationale explaining why it qualifies as dead. Aggregate counts per classification are available as well, so engineering teams can see both the individual evidence and the overall distribution of waste across the codebase. Every classification is traceable back to source locations or runtime evidence.
And dead code is not only a code-level phenomenon. The same analytical lens applies one layer up: endpoints that no client has called in years, scheduled jobs that nobody remembers writing, service modules whose only consumer was decommissioned long ago, infrastructure quietly burning budget for traffic that no longer exists. Code-level dead code is a maintainability and correctness problem. Functionality-level dead code is a cost and risk problem. Both belonging the Understand phase, because both shape the same decision: what is worth migrating, what is worth hardening in place, and what should simply be turned off.
That last point matters for hallucination control. Models hallucinate when they infer from incomplete context. The artifacts produced during Understand, classified findings, traceable evidence, mapped dependencies, are exactly the grounding downstream agents need during transformation. Hallucination is reduced before any code is touched, because the model has real evidence to work with instead of having to guess at the codebase.
Lessons for legacy modernization
- Quantify before you migrate. The single most valuable artifact in a modernization engagement is a defensible number for real code volume. Without it, every estimate is fiction.
- Auto-translation defers cost; it does not eliminate it. A clean compile is not evidence of a maintainable codebase. In this engagement, half the code was overhead, and the only thing keeping that overhead in production was that nobody was confident enough to touch it. The code was unreadable, undocumented, and unverified. Removing anything felt riskier than leaving everything.
- The IDE is not enough. Roughly 90% of the waste in this codebase was invisible to off-the-shelf static analysis. Semantic, codebase-aware analysis closed the gap.
- Dead code is a correctness signal, not just a hygiene problem. Several of the patterns we found were latent bugs the team did not know they had.
- Modernization is an orchestration problem. No single prompt, agent, or tool produces findings of this kind. It takes reusable workflows, curated context, structured outputs, and disciplined human review.
Modernization decisions made without an Understand phase are decisions made about the wrong codebase. In this engagement, the "wrong codebase" was roughly twice the size of the real one, and the real one was the only one worth migrating.
---
If you suspect your own auto-translated or long-lived legacy system is carrying overhead nobody has measured, the G.Tx Understand phase exists precisely for that conversation. Reach out - we'll start with a focused feasibility analysis for legacy modernization and produce a defensible picture of what you actually have.
Interested in our services?
Reach out for tailored solutions and expert guidance.