Thinking out loud
Where we share the insights, questions, and observations that shape our approach.
In case of a broken repository, break glass: mitigating real-life Git goofs
Imagine that you’re busy with a project that’s become a lifeblood of your company. The release is just a few days away and the schedule is tight. You work overtime or spend your 9-5 switching back and forth between a multitude of JIRA tickets, pushing a lot of pull requests as new issues come and go.
Focusing on the task at hand between one coffee break and another is tedious, and once you finish and push that final patch to your remote, you stop for a second and get this tingle in your chest. „Is it just some random piece of code that was not supposed to be there? What, release branch? Oh, my gosh! So, what do I do now?”
As many of my co-workers and myself have found ourselves in such situation, I feel obligated to address this issue. Thankfully, the good folks at Git made sure that undoing something we have already committed to a remote is not impossible. In this article, I will explore the ways of recovering your overtime mistakes as well as their potential drawbacks.
Depending on what your workflow looks like
Merge and rebase are examples of Git workflows that are used most often within corporate projects. For those who are not familiar with either of them:
- Merge workflow assumes that your team uses one or more branches that derive from the trunk (often indirectly, i.e. having been branched out from development/sprint branches), then merged into the parent branch using the classic Git mechanism utilising a merge commit. This has an advantage of seeing clearly when a given functionality has been introduced into the parent branch and also preserving commit hashes after introducing the functionality. Also, it is easier for VCS tracking systems (like BitBucket) to make sense of the progress of your repository.
The drawback: your repository tree gets polluted with merge commits and the history graph (if you are into such things) becomes quite untidy. - In a rebase workflow the features, after being branched out of their parents, become incorporated into the trunk seamlessly. The trunk log becomes straightforward and the history log gets easy to navigate. This, however, does not preserve commit hashes and unless used in conjuction with pull request tracking systems, can easily result in the repository becoming difficult to maintain.
As it happens, there are many ways to fix your repository. These ways depend on your workflow and the kind of mistake. Let’s go through some of the most common errors that can take place. Without further ado…
I pushed a shiny, brand new feature without a pull request
As we all know, pull requests do matter – they help us avoid subtle bugs and it never hurts to have another pair of eyes to look at your code. You can of course do the review afterwards, but this would require some discipline to maintain. It is easier to stick to pull requests, really.
Working overtime or undercaffeinated often leads one to forget to create a feature branch before an actual feature is implemented. Rushing to push it and to test it leads to a mess.
Revert to the rescue
git revert
git revert is a powerful command that can safely undo code changes without rewriting the history. It is powerful enough to gain respect in the eyes of many developers who usually hesitate to use its true potential.
Revert (2) works by replaying given commits in reverse , that is, creating new commits that remove added lines of code, they add back whatever was removed and undo modifications. This differs from git reset (1) that reverting is a fast-forward change that involves no history rewriting. Thus, if somebody already pulled down the tainted repository branch or introduced some changes on their own, it would be straightforward to address that. Here’s an illustration:

Revert takes a single ref, a range of refs or several arbitrary (unrelated) refs as an argument. A ref can be anything that can be resolved to a commit: the branch name (local or remote), relative commit (using tilde operator) or the commit hash itself. Only the sky is the limit.
git revert 74e0028545d52b680d9ac59edd3aff0ac4
git revert 74e002..9839b2
git revert HEAD~1..HEAD~3
git revert origin/develop~1 origin/develop~3 origin/develop~4
Reverting several changes at once
Normally, all commits in a range are reverted in order one by one. If you wish to make your log a little tidier and revert them all at once, use a no-commit flag and commit the result with a custom message:
git revert -n HEAD~1..HEAD~3
git commit -m „Revert commits x – y”
Undoing merges – wanted and unwanted
When using a merge flow, as opposed to a rebase flow, reverting changes becomes slightly more complicated – it requires the programmer to explicitly choose the parent branch based on which the changes are reverted. This often means choosing a release branch – it doesn’t affect what is actually being reverted, but what’s preserved in the history log.
Let’s suppose you base your feature off the development branch and you name it feature-1 . You introduce some changes into your branch while somebody merges some of their changes into development . Both your branch and the parent branch undergo some changes and then you can proceed to merging.
After a while, this feature has to be undone for the release that your team has to work on some more, and thus it requires a revert of the features you have previously introduced. Some time has passed since then and many more features have been introduced into the release.
Every merge commit has two parents. To revert yours into the state that preserves your and your team’s changes in the log, you would usually specify the mainline branch (-m) as the first one:
git revert 36bca8 -m 1
However, once the team decides to reintroduce this change once again, it will mean that you will try to merge in a set of diffs that’s already in the target branch. This will result in a succinct message that everything is up-to-date. To mitigate that, we could try to switch to our feature branch, amend the commit (in case there’s only one change to revert) or use an interactive rebase.
git rebase -i HEAD~n
Where n is the number of the introduced changes with edit option. Amending the commits will replay them, not altering the changes or commit messages, but making the commits appear different to Git and thus allowing us to reintroduce them as if they were fresh.
If you use rebasing, read this
The rebasing eases the burden of keeping track of the merge parents – because there are no merges to begin with. The history is linear and, as such, reverts of unwanted code are straightforward to perform.
It may be tempting to use rewriting in this case, but keep in mind the golden rule of rewriting – unless you are absolutely sure that it’s only you and nobody else using that branch, don’t rewrite the history.
How (not) to use the –force
Not everybody is born Jedi, and most programmers are no different. Force pushing the commit allows us to overwrite the remote history even if our branch does not perfectly fit into the scene, but makes it dangerously easy to forgo the changes somebody else made. A rule of thumb is to only use the force push on your own feature branches, and only when it is absolutely necessary.
When is it fine to rewrite Git history?
Put simply, as long as we haven’t published our branch yet for somebody else’s use. As long as our changes stay local, we’re fine to do as we please – provided we take responsibility for the data we manipulate. Some commands, such as git reset --hard can lead to loss of data (which happens quite often, as one would be able to infer from multitude of Stack Overflow posts on the topic). Nevertheless, it’s always wise to create a backup branch (or otherwise remember the ref) before attempting such operations.
Goof Prevention Patrol
Other than using software solutions, it’s best to enforce the team discipline yourself – make fellow developers responsible for their mistakes and let them learn from practice.
Some points worth going over are:
- protecting main/release branches from accidental pushes using restrictions and rules
- establishing a naming convention for branches and commit messages
- using CD/CI system for additional monitoring – this may help detect repository inconsistencies
Also, many Git tools and providers, such as BitBucket, allow one to specify branch restrictions, such as not allowing developers to push to a main or release branch without a pull request. This can be extended to matching multiple branches with a glob expression or a regex. This is very handy especially if your team follows naming branches after a specific pattern.
Summary and further Git reads
Mistakes were made, are made and will be. Thankfully, Git is smart enough to include mechanisms for undoing them for the developers brave enough to use them.
Hopefully this article resolved some common misunderstandings about Revert and when to use it. Should that not prove enough, here are some helpful links:

Cloud-native applications: 5 things you should know before you start
Introduction
Building cloud-native applications has become a direction in IT that has already been followed by companies like Facebook, Netflix or Amazon for years. The trend allows enterprises to develop and deploy apps more efficiently by means of cloud services and provides all sorts of run-time platform capabilities like scalability, performance and security. Thanks to this, developers can actually spend more time delivering functionality and speed up Innovation. What else is there that leaves the competition further behind than introducing new features at a global scale according to customer needs? You either keep up with the pace of the changing world or you don’t. The aim of this article is to present and explain the top 5 elements of cloud-native applications.
Why do you need cloud-native applications in the first place?
It is safe to say that the world we live in has gone digital. We communicate on Facebook, watch movies on Netflix, store our documents on Google Drive and at least a certain percentage of us shop on Amazon. It shouldn’t be a surprise that business demands are on a constant rise when it comes to customer expectations. Enterprises need a high-performance IT organization to be on top of this crowded marketplace.
Throughout the last 20 years the world has witnessed an array of developments in technology as well as people & culture. All these improvements took place in order to start delivering software faster. Automation, continuous integration & delivery to DevOps and microservice architecture patterns also serve that purpose. But still, quite frequently teams have to wait for infrastructure to become available, which significantly slows down the delivery line.
Some try to automate infrastructure provisioning or make an attempt towards DevOps. However, if the delivery of the infrastructure relies on a team that works remotely and can’t keep up with your speed, automated infrastructure provisioning will not be of much help. The recent rise of cloud computing has shown that infrastructure can be made available at a nearly infinite scale. IT departments are able to deliver their own infrastructure just as fast as if they were doing their regular online shopping on Amazon. On top of that, cloud infrastructure is simply cost efficient, as it doesn’t need tons of capital investment in advance. It represents a transparent pay-as-you-go model. Which is exactly why this kind of infrastructure has won its popularity among startups or innovation departments where a solution that tries out new products quickly is a golden ticket. So, what IS there to know before you dive in?
The ingredients of cloud-native apps, and what makes them native?
Now that we have explained the need for cloud-native apps, we can still shed a light on the definition, especially because it doesn’t always go hand in hand with its popularity. Cloud native apps are those applications that have been built to live and run in the cloud. If you want to get a better understanding of that it means - I recommend reading on. There are 5 elements divided into 2 categories (excluding the application itself) that are essential for creating cloud native environments.
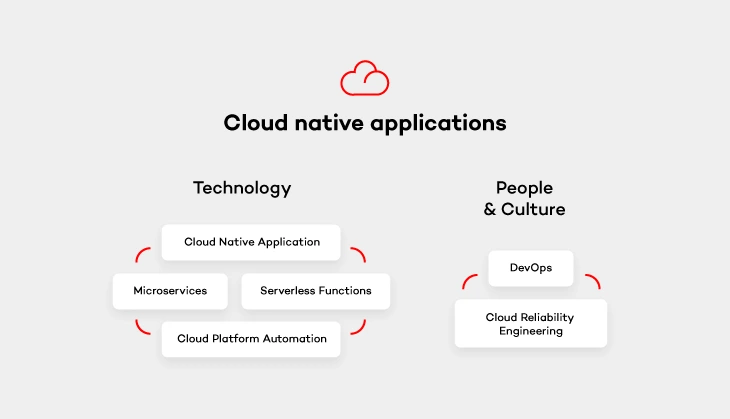
Cloud platform automation
In other words, the natural habitat in which cloud-native applications live. It provides services that keep the application running, manage security and network. As stated above, the flexibility of such cloud platform and its cost-efficiency thanks to the pay-as-you-go model is perfect for enterprises who don’t want to pay through the nose for infrastructure from the very beginning.
Serverless functions
These small, one-purpose functions that allow you to build asynchronous event-driven architectures by means of microservices. Don’t let the „serverless” part of their name misleads you, though. Your code WILL run on servers. The only difference is that it’s on the cloud provider’s side to handle accelerating instances to run your code and scale out under load. There are plenty of serverless functions out there offered by cloud providers that can be used by cloud-native apps. Services like IoT, Big Data or data storage are built from open-source solutions. It means that you simply don’t have to take care of some complex platform, but rather focus on functionality itself and not have to deal with the pains of installation and configuration.
Microservices architecture pattern
Architecture pattern aims to provide self-contained software products which implement one type of a single-purpose function that can be developed, tested and deployed separately to speed up the product’s time to market. Which is equal to what cloud-native apps offer.
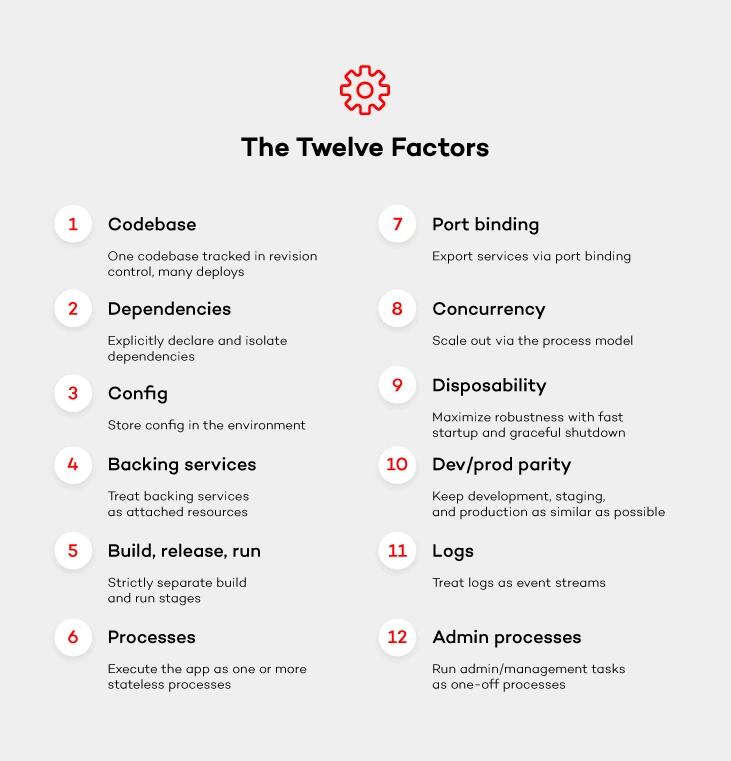
Once you get down to designing microservices, remember to do it in a way so that they can run cloud native. Most likely, you will come across one of the biggest challenges when it comes to the ability to run your app in a distributed environment across application instances. Luckily, there are these 12-factor app design principles which you can follow with a peaceful mind. These principles will help design such microservices that can run cloud native.
DevOps culture
The journey with cloud-native applications comes not only with a change in technology, but also with a culture change. Following DevOps principles is essential for cloud-native apps . Therefore, getting the whole software delivery pipeline to work automatically will only be possible if development and operation teams cooperate closely together. Development engineers are those who are in charge of getting the application to run on the cloud platform. While operations engineers handle development, operations and automation of that platform.
Cloud reliability engineering
And last but not least – cloud reliability engineering that comes from Google’s Site Reliability Engineering (SRE) concept. It is based on approaching the platform administration in the same way as software engineering. As stated by Ben Treynor , VP of Engineering at Google „Fundamentally, it’s what happens when you ask a software engineer to design an operations function (…). So SRE is fundamentally doing work that has historically been done by an operations team, but using engineers with software expertise, and banking on the fact that these engineers are inherently both predisposed to, and have the ability to, substitute automation for human labor.”
Treynor also claims that the roles of many operations teams nowadays are similar. But the way SRE teams work is significantly different because of several reasons. SRE people are software engineers with software development abilities and are characterized by proclivity. They have enough knowledge about programming languages, data structures, algorithms and performance. The result? They can create software that is more effective.
Summary
Cloud- native applications are one of the reasons why big players such as Facebook or Amazon stay ahead of the competition. The article sums up the most important factors that comprise them. Of course, the process of building cloud native apps goes far beyond choosing the tools. The importance of your team (People & Culture) can never be stressed enough. So what are the final thoughts? Advocate DevOps and follow Google’s Cloud Engineering principles to make your company efficient and your platform more reliable. You will be surprised at how fast cloud-native will help your organization become successful.
Challenges in migrating legacy .NET apps into pivotal Cloud Foundry – customer case study
Migrating legacy .net apps to Pivotal Cloud Foundry poses many challenges for most developers and companies. In this article, I will walk you step by step through the migration process based on my own experience and show you how to do it.
My first objective is to show that the migration is possible and requires only several changes in the application code base. The second one is to share the knowledge that I have gained while working on that project. Let’s forget that .NET Core even exists and discuss only the world of .NET framework. This article is about migrating existing ASP.NET Web form applications to Cloud Foundry.
As one of the 3rd party libraries is working only with Windows Server 2012R2 so we could not use Docker as it is supported only by Windows server 2016, which make migration more complex. Fortunately, but with some workarounds, the project was successfully completed.
The first goal of the migration was to implement a full Continuous Integration based on Cloud Foundry including building the application, launching unit tests, deploying the application to the development environment at Cloud Foundry, and finally launching acceptance tests using this environment.
Another requirement was to allow the operator to easily create a release package for the last version that passed the acceptance tests. That could be deployed to all environments like QA, UAT and Production. The final goal was to implement a production blue - green deployment.
After setting our goals, it was time to review the existing process and check what can we use from the existing infrastructure and processes. Since all steps were manual, nothing could be used. The build was made on a developer machine and all deployments to all production instances were manual. The only good thing was that the application has already been scaled vertically, which gave some hope to reduce the amount of necessary refactoring.
Once we have gotten familiar with the process, it was time to get to know the application itself. However, it turned out that the application was already very mature and that it was built in the asp.net web-forms technology and some parts of the code dated back to .NET 1.1. Therefore, the application requires Oracle Provier, Crystal reports and a custom archiving tool installed on the machine. Unfortunately, despite our hopes, it is not sessionless, but the session is stored in the database.
The next identified problem was the use of Active Directory; one of the web applications in the solution was using the windows identity. And finally, we learned that some of the sites were using mutual authentication and the servers had private keys loaded. Having all requirements we could begin the migration.
The migrating legacy .NET apps process
The first important decision was the choice of CI / CD tools. In the end, our choice has been limited to two: TFs and Concourse.
TFS is an integrated work tracker, very good support for NuGet and Active Directory integration. Unfortunately, the biggest disadvantage of TFS OnPremise is the lack of support for writing a CI / CD process as code or scripts (i.e. YAML files). VSTS currently has the support for CI, so there is a big hope that OnPremise version (TFS) will also have such support.
Concourse’s indisputable advantage is the docker usage. Each time when the pipeline is started it creates a new instance of container, so that we are sure that our building environment is immutable. Concourse provides us with a native support for Cloud Foundry (Resource type) and gives us the opportunity to use the same service for authorization as Cloud Foundry. Unlike TFS, it allows you to connect our process to several resources (GIT repositories) and to observe and trigger builds when changing in any of them. The biggest advantage, however, is the very simple representation of the pipelines in saved YAML files. When it comes to the drawbacks, its biggest issue is the lack of support for the NuGet resource so we cannot automatically launch the pipeline when the next version appears.
After considering all the pros and cons, the choice was to use Concourse. Unlike TFS, it allows you to connect our process to several resources (GIT repositories) and to observe and trigger builds when changing in any of them. After choosing the CI/CD tool, it was time to prepare Cloud Foundry and Concourse to work with our application. And since we were forced to use Windows Server 2012R2, we needed to prepare windows images for Concourse and PCF.
Concourse:
Uploading MSBuild, Web Deploy and all 3rd party dependencies. In case of an image for PCF, all we needed was all 3rd party dependencies. When we managed to get through the entire Setup process and choose all tools, we could start working with concourse on building the solution application. Unfortunately, at the very beginning it turned out that the application needed cleaning and small refactoring as the dependencies were so messed up that the application was not built on a clean machine, and required the developer to configure the machine in a very specific way which unfortunately was unacceptable if we wanted to use the concourse.
Another problem was the multitude of versions of MSBuild. Microsoft unfortunately did not show off and we had to create custom variables in the Concourse Image where we kept the path to MsBuild versions. And finally, we come to the reason of the IIS upload on the concourse image.
After deploying the application, the warm up took a very long time and made it difficult to run acceptance tests and caused that vertically scaling was not as smooth as we desired, therefore we decided to pre-compile asp.net pages during the build process that required IIS. Unfortunately, the pre-compilation did not turn out to be as fast as we assumed because all pages, including those currently blocked by feature toggle, were also parsed or were not in use at that time.
We have reached the point at which the application was ready to be uploaded to our PaaS. In Cloud Foundry, to run asp.net applications we needed to use an HWC Build pack which used Microsoft Hosted Web Core API that ran its own IIS instance and hosted single applications in a single web domain.
To perform the Cloud Foundry push, we needed a deployment manifesto written in YAML, of course none of us wanted to hardcode this file in the application code, we just wanted to create it dynamically based on the environment variables. Unfortunately, after a one-day research it turned out that the only PowerShell module that was maintained at that time and supported, did not provide sufficient functionality so we used python to create YAML files. After preparing the manifest, uploading the application was only a formality which, thanks to the good integration of Concourse and CF was smooth and problem-less. After uploading the application to Cloud Foundry the basic tests showed that the application did not work and some refactoring was required.
Refactoring
The first problem appeared with more than 2 instances of application, i.e. ViewState decryption failed after Postback in a situation where the user after sending the form goes to another instance. To fix it, we were forced to set the machineKey on the application level. After the application has been deployed and the first manual tests have passed, it was time to add automatic tests. For this we used selenium and chrome headless.
During the implementation of the tests, we did not come across any bigger problems. The only thing that is worth mentioning was the problem with the control "Update Panel" which could be very easily bypassed using custom java script. And the problem with checkboxes which in the headless mode Select method was not working and needed workaround by sending "space bar" character. Selenium was the reason why Chrome needed to be installed on Windows Image for concourse.
Another piece of code that required refactoring was the usage of RequestContext. Keep in mind that the router changed its content quite significantly, i.e. changing ports so the redirect or our famous asp.net ~ (tilde) would not work properly. We also had to change all the elements in the application that used LocalMachine as a storage (e.g. certificates) in our case was enough to change to CurrentUser (PCF always creates a new user when creating the instance of application and we used this fact for certificates).
The biggest problem that unfortunately could not be fixed is Windows Identity. This was mainly because there is no possibility to use this form of authentication in Cloud Foundry. The only workaround is to use Forms Authentication and communicate with AD using the LDAP protocol. The final change in the application was creating custom Healthpoint because ASP.NET Web Forms do not have ready solutions to monitor and debug applications.
However, you must remember that all pages, including our heathpoints, would not be available in case of any problem in global.asax, web.config or handlers and debugging this type of problems must be done outside of the application.
After implementing the tests, we could say that we had the first phase of migration done with a working application on CF - the first successful milestone.
Second milestone
It was time for milestone two. The application was working, but only on one environment and we wanted our applications to be deployed in many different environments and have the configuration stored in Environment Variables.
Unfortunately, ASP.NET, unlike asp.net Core does not allow you to configure the application after it has been run. The web.config file must be ready at the moment of launching the application, and if you change it for example using the global.asax, the application will be restarted.
We saw two ways of handling this issue:
- Massive application refactor to limit or eliminate web.config files (which would be very time-consuming or almost impossible in the case of sessions or certificates).
- The preparation of the entire environment and necessary files (web.config , certificates) before starting the HWC server.
After the test, both forms were using POC. Option number two, a custom build pack, was the winner.
Our Custom Build pack is nothing more than a set of Powershell scripts that launched before the HWC prepared the environment and applications. In case of Windows Server 2012, Cloud Foundry is not able to use the Docker container to separate application instances, but it creates separate users for each of the application instance.
Steps:
The first step is to read and parse all configuration from Environment Variable and download the necessary files from the GIT Server (TFS praises for making the highly-available HTTP API available).
Part of the configuration included in the GIT are xdt (XML Document Transformation) files that we used to create the appropriate entries in our web.config file.
After preparing the web.config file scripts, install the necessary certificates in the User Store and map Network Drive, of course, in the context of the user.
This few simple workaround has been able to separate the application code from the environment configuration.
The moment when we have separated configurations, we can easily take care of releasing the application and deploying it to all environments QA, UAT and production. All you have to do is set the correct versioning (we used Semantic versioning), create separate tests that can be done on production, and prepare blue-green deployment scripts that will, for example, change routing if the newly created environment is stable and remove the previous version.
The application has been migrated, it is running on many instances and is independent from the environment, but can we call it cloud-native already?
Unfortunately not, and some more work is required to make it happen. The most important changes that are still ahead of you and which you are able to do with small cost in asp.net web forms are adding telemetry and systematizing logs.
Add Sonar to Continues integration pipeline. The entire solution consists of 17 projects (including two web applications) that are dependent on each other which in the case of any change forces the deploy of all applications. So it should be broken down into a few smaller solutions and store the libraries in NuGet.
The database is not the best and most efficient place to store the sessions so the absolute minimum is to go to Radis and get rid of the session in new features at all. And for new features creating separate microservices.
Summary
To sum up, migrating legacy .NET applications to Pivotal Cloud Foundry can pose plenty of challenges that even the most experienced specialists may have to face and tackle. I hope that the process that I presented and the experience that I shared will help many of you overcome them.
Native bindings for JavaScript - why should I care?
At the very beginning, let’s make one important statement: I am not a JavaScript Developer. I am a C++ Developer, and with my skill set I feel more like a guest in the world of JavaScript. If you’re also a Developer, you probably already know why companies today are on the constant lookout for web developers - the JavaScript language is flexible and has a quite easy learning curve. Also, it is present everywhere from computers, to mobile devices, embedded devices, cars, ATMs or washing machines - you name it. Writing portable code that may be run everywhere is tempting and that's why it gets more and more attention.
Desktop applications in JavaScript
In general, JavaScript is not the first or best fit for desktop applications. It was not created for that purpose and it lacks GUI libraries like C++, C#, Java or even Python. Even though it has found its niche.
Just take a look at the Atom text editor. It is based on Electron [1], a framework to run JS code in a desktop application. The tool internally uses chromium engine so it is more or less a browser in a window, but still quite an impressive achievement to have the same codebase for both Windows, macOS and Linux. It is quite meaningful for those that want to use agile processes. Especially because it is really easy to start with an MVP and have incremental updates with new features often, as it is the same code.
Native code and JavaScript? Are you kidding?
Since JavaScript works for desktop applications, one may think: why bother with native bindings then? But before you also think so, consider the fact that there are a few reasons for that, usually performance issues:
- Javascript is a script, virtualized language. In some scenarios, it may be of magnitude slower than its native code equivalent [2].
- Javascript is characterized by garbage collection and has a hard time with memory consuming algorithms and tasks.
- Access to hardware or native frameworks is sometimes only possible from a native, compiled code.
Of course, this is not always necessary. In fact, you may happily live your developer life writing JS code on a daily basis and never find yourself in a situation when creating or using native code in your application is unavoidable. Hardware performance is still on the uphill and often there is no need to even profile an application. On the other hand, once it happens, every developer should know what options are available for them.
The strange and scary world of static typing
If a JavaScript Developer who uses Electron finds out that his great video encoding algorithm does not keep up with the framerate, is that the end of his application? Should he rewrite everything in assembler?
Obviously not. He might try to use the native library to do the hard work and leverage the environment without a garbage collector and with fast access to the hardware - or maybe even SIMD SSE extensions. The question that many may ask is: but isn’t it difficult and pointless?
Surprisingly not. Let’s dig deeper into the world of native bindings when as an opposite to JavaScript, you often have to specify the type of variable or return value for functions in your code.
First of all, if you want to use Electron or any framework based on NodeJS, you are not alone - you have a small friend called “nan” (if you have seen “wat”[3] you are probably already smiling). Nan is a “native abstraction for NodeJS” [4] and thanks to its very descriptive name, it is enough to say that it allows to create add-ons to NodeJS easily. As literally everything today you can install it using the npm below:
$ npm install --save nan
Without getting into boring, technical details, here is an example of wrapping C++ class to a JavaScript object:

Nothing really fancy and the code isn’t too complex either. Just a thin wrapping layer over the C++ class. Obviously, for bigger frameworks there will be much code and more problems to solve, but in general we have a native framework bound with the JavaScript application.
Summary
The bad part is that we, unfortunately, need to compile the code for each platform to use it and by each platform we usually mean windows, linux, macOS, android and iOS depending on our targets. Also, it is not rocket science, but for JavaScript developers that never had a chance to compile the code it may be too difficult.
On the other hand, we have a not so perfect, but working solution for writing applications that run on multiple platforms and handle even complex business logic . Programming has never been a perfect world, it has always been a world of trade-offs, beautiful solutions that never work and refactoring that never happens. In the end, when you are going to look for yet another compromise between your team’s skills and the client’s requirements for the next desktop or mobile application framework, you might consider using JavaScript.

How to run any type of workload anywhere in the cloud with open source technologies?
Nowadays, enterprises have the ability to set up and run a mature and open source cloud environment by bundling platform technologies like Cloud Foundry and Kubernetes with tools like BOSH, Terraform and Concourse. This bundle of open source cloud native technologies results in an enterprise grade and production-ready cloud environment, enabling enterprises to run any type of workload anywhere in an economically efficient way. Combining that with Enterprise Support from an experienced Enterprise IT Cloud solution provider gives enterprises the ideal enabler to achieve their digital transformation goals .
Reference architecture of an open source cloud environment
The reference architecture of an open source and enterprise grade cloud environment should at minimum contain these core elements:
- Infrastructure provisioning
- Release Management & Deployment
- Configuration Management
- Container based Runtime
- Orchestration & Scheduling
- Infrastructure & Application Telemetry software
- Monitoring & Analytics
- Application Deployment Automation
- Back-ups & Disaster Recovery
How to start?
For all the elements listed above, there are multiple open source technologies to choose from that one needs to be familiar with. The ‘Cloud Native Landscape’ from the Cloud Native Foundation is an elaborate and up-to-date overview of the open source cloud native tools available.
Navigating through this landscape and the multitude of tools to choose from is not an easy task. With a dedicated team and an agile approach every company is able to set up its own open source cloud environment. Nevertheless, bundling these technologies in a correct and seamless way is a complex undertaking. It takes an experienced and skilled partner to help enterprises simplify, automate and speed-up the setup process, relying solely on the same open source technologies . This support provides additional security and mitigates risk.
Benefits
Having a single cloud environment is a big enabler for DevOps adoption within enterprises. It provides development teams with a unified platform, giving them space to focus solely on building valuable applications. Ops teams manage a homogeneous environment by using a tool like BOSH for release management and deployment for both Application Runtime and Container Runtime.
Technologies like Cloud Foundry and Kubernetes are independent from the underlying infrastructure making it possible to utilize any combination of the public and/or private cloud as your infrastructure layer of choice. At the end of the day, you shouldn’t underestimate the economic value here. Open source technologies that are supported by large user communities and the largest technologies companies in the world make having your own Open Cloud Environment a very compelling option.
In-house vs Managed
In the light of growing complexity associated with managing DevOps enterprises look to partners to provide managed services for their cloud environments. The main reason is that all the different stack components of a mature cloud environment can be complex for many IT organizations to deploy and manage on their own. With frequent required updates to the different components of the bundle the average IT organization is not well suited to keep pace, without help from a partner.
Having a partner provide managed services for the cloud environment creates additional benefits; reducing complexity and more resource allocation to areas that create more direct business value.
Personally, I’m excited to be a close witness and participant of this growing trend and look forward to seeing more enterprises run their production workloads on open source technologies.
Cloud native: What does it mean for your business?
We witness how the world of IT constantly changes. Today, like never before, it is more often defined as “being THE business” rather than just “supporting the business”. In other words, the conventional application architectures and development methods are slowly becoming inadequate in this new world. Grape Up, playing a key role in the cloud migration strategy, helps Fortune 1000 companies make a smooth transition. We build apps that support the business itself, we advocate the agile methodology, and implement DevOps to optimize performance.
To clarify the idea behind cloud native technologies, we’ve put together the most important insights to help you and your team understand the essentials and benefits of Cloud Native Applications:
Microservices architecture
First and foremost, one must come to terms with the fact that the traditional application architecture means complex development, long testing and releasing new features only in a specific period. Whereas, the microservices approach is nothing like that. It deconstructs an application into many functional components. These components can be updated and deployed separately without having any impact on other parts of the application.
Depending on its functionality, every microservice can be updated as often as needed. For instance, a microservice that contains functionalities of a dynamic business offering will not affect other parts of the app that barely change at all. Thanks to this, an application can be developed without changing its fundamental architecture. Gone are the days when IT teams had to alter most of the application just to change one piece.
Operational design
One of the biggest issues that our customers face before the migration is the burden of moving new code releases into production. Along with monolithic architectures that combine the whole code into one executable, new code releases require deploying the entire application. Because production environment isn’t the same as development environment, it often becomes impossible for developers to detect potential bugs before the release. Also, testing new features without moving the whole environment to the new app version can become tricky. This, in turn, complicates releasing new code. Microservices solve this problem prefectly. Since the environment is divided, any changes in code are separated to executables. Thanks to this, updates do not change the rest of the application, which is what clients are initially concerned about.
API
One of the indisputable advantage of microservices which outweighs all traditional methods is the fact that they communicate by means of API. With that said, you can release new features step by step with a new API version simultaneously. And if any failures appear, there is also a possibility to shut off access to the new API while the previous version of your app is still operational. In the meantime, you can work on the new function.
DevOps
At Grape Up, we often work on on-site projects alongside our clients. On the first day of the project, we are introduced to multiple groups that are in charge of various parts of the app’s lifecycle such as operations, deployment, QA or development. Each of them has its own processes. This creates long gaps between tasks being handed over from one group to another. Such gaps result in ridiculously long deployment time frames which are very harmful to an IT business, especially when frequent releases are more than welcome. To efficiently get rid of these obstacles and improve the whole process, we introduce clients to DevOps.
By and large, DevOps is nothing else, but an attempt to eliminate the gaps between IT groups. It’s an engineering culture that Grape Up experts teach clients to use. If followed properly, they are able to transform manual processes to automated ones and start getting things done faster and better. The most important thing is to find the pain point in the application’s lifecycle. Let’s say that the QA department doesn’t have enough resources to test software and delays the entire process in time. A solution to this can be either to migrate testing to a cloud-based environment or put developers in charge of creating tests that analyze the code. By doing so, the QA stage can take place simultaneously with the development stage, not after it. And this is what it takes to understand DevOps.
The transition to cloud-native software development is no longer an option, it is a necessity. We hope that all the reasons mentioned above prompted you to embark on a journey called “Cloud-Native”, a promising opportunity for your company to grow in the years to come. And even if you’re still feeling hesitant, don’t think twice. Our expertise combined with your vision can be a great start into a brighter future for your enterprise .
A slippery slope from agile to fragile: treat your team with respect
„Great things in business are never done by one person, they’re done by a team of people.”
said Steve Jobs. Now imagine if he didn’t have such Agile approach. Would the iPhone ever exist?
Agile development, a set of methods and practices where solutions evolve thanks to the collaboration between cross-functional teams . It is also pictured to be a framework which helps to ‘get things done’ fast. On top of that, it helps to set a clear division of who is doing what, to spot blockers and plan ahead. And we’ve all heard of this. Most of us even know the definition of Agile by heart. In the last few decades, Agile has become the approach for modern product development. But despite its popularity, it is still misinterpreted quite often and its core values tend to get abused. This misinterpretation has become so common that it has developed a name for itself, frAgile. In other words, it is what your product and team become if you don’t follow the rules.
The thin line between Agile and frAgile
Working by the principles of Agile means you are flexible and you’re able to deliver your product the way the customer wants it and on time. By and large, Agile teaches u how to work smarter and how to eliminate all barriers to working efficiently. However, there are times when the attempt to follow Agile isn’t taken with enough care and the whole plan fails. Just like trying to keep balance when it’s your first time on ice skates.
With that said, I will step-by-step explain a few examples of how Agile can quickly and irreversably become something it should never be in the first place. Later on, I will list the tips on how to avoid stepping on that slippery slope. So let’s take a look at the examples:
Your technical debt is going through the roof
Just like projects, sprints are used to accomplish a goal. Quite often though, when the sprint is already running, new decisions and changes keep flowing in. As a result, your team keeps restarting work over and over again and works all the time. Does it sound familiar?
Unfortunately, if this situation continues, everyone gets used to it and it becomes the norm. It usually leads to a huge pile of technical debt you could ever imagine. Combine it with an endless list of defects caused by the lack of stability to nurture the code and you are doomed for failure.
You should always respond to change wisely. Despite the fact that the Agile methodology embraces changes and advocates flexibility, you shouldn’t overdo it. Especially not the changes that impact your sprint on a daily basis. Every bigger change ought to be consulted between sprints, and be based on the feedback received from users.
A big fish leaves the team and the project falls apart
Another, not so fortunate thing that can happen is a team member leave your team in the middle of a long-term, complex project that consists of more unstructured processes than meets the eye. With the job rotation in the contemporary world of IT, it happens all the time.
Once a Product Owner or a Team Leader is gone, none of the team members will be able to propoerly describe the system behavior and what should be delivered. As a result, deadlines will fail to be met and you will be chasing dreams about the quality of your product.
Find the balance between individuals and processes. And most importantly, never underestimate how your scope of work is documented and the team is managed. Otherwise, after an important team member is gone, the rest will be left in a difficult position. So prepare them for such events. Take your time to estimate what might hold back your team and what is absolutely necessary for the fast-paced of world-class engineering.
The project is nearly finished but your customer is nowhere near Agile
You would be surprised at how many companies out there are Agile… in their dreams. By appreciating the flexibility that Agile gives, they often confuse Agile working with flexible working and still work with the waterfall methodology in their minds. This can be spotted especially when someone overuses terms like sprint or scrum all the time. In reality, actions speak louder than words and one doesn’t have to show off their „rich” vocabulary.
Therefore, if you agree on a strict scope of delivery in your contract, you might regret it later on. We all know that the reason why IT is all about Agile is because plans tend to change. The only problems is that the list of features on the contract doesn’t. If the customer doesn’t fully understand the values of Agile, the business relationship can be put at risk.
Prioritize the collaboration with your client over contract negotiations. Focus on clear communication from the beginning and make sure that your client grasps the principles of Agile. Also, if along the way any unexpected changes to the established scope of work appear, make sure to carry them out in front of your client’s eyes.
Save me from drowning in frAgility
With all the above, here is how you can avoid messing up your work environment:
- Prepare user stories before planning the sprint. You will thank yourself later. If written collaboratively as part of the product backlog grooming proces, it will leverage creativity and the team’s knowledge. Not only will it reduce overhead, but also accelerate the product delivery.
- Be careful with changes during the sprint. Or simply - avoid abrupt changes. Thanks to this, your code base will have its necessary stability for performance.
- Turn yourself into a true Agile evangelist. Face reality that not everyone understands the core values of the world’s most beloved methodology – not even your customers. So even if someone tells you that they use Agile, take it with a pinch of salt. Strong business partnerships are built upon expectations that are clear to both sides.
At Grape Up, we follow the principles behind the Agile Manifesto for software development. We believe that business people and developers must work together daily throughout the project. It helps us and our clients achieve mutual success on their way to becoming cloud-native enterprises .
Building an easy to maintain, reusable user interface on macOS
The value of the user interface
What you see inside an app is called the user interface (UI). Undoubtedly, it is an important part of every software, and it’s no piece of cake to wrap the business logic with a fancy, (self-explanatory) and efficient visual representation.
How many times in your life have you heard not to judge the book by its cover? Probably quite a few. And how many times have you left an application and never came back just because you didn’t like the design at first sight? Probably more than just a few times.
At Grape Up, we achieve a successful UI through close cooperation between our software engineers (SE) and designers. And this article is about the software engineer’s part – programming UI for the macOS platform .
Programming user interface in Cocoa
Cocoa, an original name given to the Application Programming Interface (API) used for building Mac apps. It is fully responsible for the appearance of apps, their distinctive feel and responsiveness to user actions. The tool automates and simplifies many aspects of UI programming to comply with Apple's human interface guidelines (AHIG). It provides software engineers with several tools for UI development:
- Storyboards
- XIBs
- Custom code
Each of them gives the possibility to implement not only a fully functional, but also an incredibly useful and captivating UI. Having used all three of them at Grape Up, we could give you a comparative analysis of each tool, but we will not be discussing it here.
Why is it better to use XIBs and Storyboards?
Of course, it would be wrong to state that XIBs or Storyboards are simply better than the Custom code. Like always, there is no “silver bullet” – no universal approach or solution for every software development problem. On some occasions the Interface Builder (IB) won’t be helpful to achieve the desired appearance. However, years of hands-on experience backed up by numerous projects have allowed us to draw the following conclusions as to why it’s better to use the Interface Builder on a regular basis:
It’s easy to understand and update
Let’s say that the software engineer needs to deliver an update to an already existing container view with a number of subviews. In what case will he spend less time getting familiar with the existing solution and applying the update? When using XIB with visualized UI elements and layout constraints or when the UI is scripted in several hundred lines of code?
Another example, let’s imagine a set of very similar but still different views. The software engineer needs to extend this set with another view. In what case will he not duplicate the already existing solution and reuse it instead? These are a few examples of regular SE tasks.
In practice, most of the times you would expect the UI to be available in XIB/Storyboard, and not in the code. We can consider XIBs/Storyboards as a public high-level API which encapsulates all the details underneath. IB design will provide a better general overview as well as decrease the chance of missing something.
One of the biggest arguments against XIBs are merge conflicts. Usually, they are caused by not paying enough attention to decomposing tasks during the project. Which is exactly why we practice task decomposition, a project technique that breaks down the workload and tasks into smaller ones before the actual creation of the entire work structure. Thanks to this, we are able to save a lot of time in the long run. By using IB, you can create as much granular UI elements as you want. Moreover, this a proper way of targeting a reusable and easy to update User Interface.
It helps avoid mistakes and saves time
Another great advantage of the Interface Builder is the fact that software engineers can get away with plenty of the so called “dirty work”, such as objects initialization, configuration, basic constraints management, etc. The UI can be implemented faster and with less code. By using IB, the engineer simply follows the rule – “Less code produces less bugs”.
It generates warnings and errors
The warnings and errors generated by the Interface Builder when working with an Auto Layout engine: unsatisfiable layouts, ambiguous layouts, logical errors. Raised issues are quite descriptive and self-explanatory. In many cases, the IB even suggests a solution. Thanks to the mentioned issues it is a lot easier to prepare a proper and functional UI before even building the application. Which would rather be impossible to achieve when programming UI in code. With that said we can say that the IB is a great tool for both creating and testing the UI.
It accelerates the development cycle
The next useful feature that is available in IB is Previews. Thanks to it, the application interface can be previewed using the assistant editor, which displays a secondary editor side-by-side with the main one. It gives the possibility to check the designed Auto Layout on the fly and also significantly reduces development cycle time. Such feature is especially helpful when supporting multiple localizations.
It helps educate new team members
As we all know, during the project life time engineers leave and join the team. To make the onboarding process smooth and effective, we introduce new team members to a UI which is organized in XIB files or in Storyboards. As a result, they are given a complete overview of the application’s functionalities. After all, we all know how the saying goes– “Human brains prefer a visual content over the textual one”.
XIBs and Storyboards extended use cases
Is there a better way of organizing your User Interface designs than just keeping them in your Resources folder? Of course. Why not organize them in a library or a framework? Having a UI framework with all the custom views (XIBs) along with controllers to manage them can be quite convenient. After all, having UI elements in visual representation and keeping them atomic enough guarantees extensibility, manageability and reusability. For those that work on big, stretched over time projects it might be really useful.
Conclusion - providing an easy to maintain user interface
The modern world is all about information and the ways of transferring, processing as well as selling it. Why bother yourself with some boring symbols if there already are more fascinating ways of dealing with it right around the corner? The Interface Builder delivers a quick, convenient and reliable way for programming your UI. So, let’s save us some time for a mutual discussion.

Steps to successful application troubleshooting in a distributed cloud environment
At Grape Up, when we execute digital transformation, we need to take care of a lot of things. First of all, we need to pick a proper IaaS that meets our needs such as AWS or GCP. Then, we need to choose a suitable platform that will run on top of this infrastructure . In our case, it is either Cloud Foundry or Kubernetes. Next, we need to automate this whole setup and provide an easy way to reconfigure it in the future. Once we have the cloud infrastructure ready, we should plan how and what kind of applications we want to migrate to the new environment. This step requires analyzing the current state of the application’s portfolio and answering the following:
- What is the technology stack?
- Which apps are critical for the business?
- What kind of effort is required for replatforming a particular app?
Any components that are particularly troublesome or have some serious technical debts should be considered for modernization. This process is called “breaking the monolith” where we try to iteratively decompose the app into smaller parts, where each new part can be a new separate microservice. As a result, we end up with dozens of new or updated microservices running in the cloud.
So let’s assume that all the heavy lifting has been done. We have our new production-ready cloud platform up and running, we replatformed and/or modernized the apps and we have everything automated with the CI/CD pipelines. From now on, everything works as expected, can be easily scaled and the system is both highly available and resilient.
Application troubleshooting in a cloud environment
Unfortunately, quite often and soon enough we receive a report that some requests behave unusual in some scenarios. Of course, these kind of problems are not unusual no matter what kind of infrastructures, frameworks or languages we use. This is a standard maintenance or monitoring process that each computer system needs to take into account after it has been released to production.
Despite the fact that cloud environments and cloud-native apps improve a lot of things, application troubleshooting might be more complex in the new infrastructure compared to what the ‘old world’ represented.
Therefore, I would like to show you a few techniques that will help you with troubleshooting microservices problems in a distributed cloud environment. To exemplify everything, I will use Cloud Foundry as our cloud-native platform and Java/Spring microservices deployed on it. Some tips might be more general and can be applied in different scenarios.
Check if your app is running properly
There are two basic commands in CF C L I to check if your app is running:
- ‘cf apps’ – this will list all applications deployed to current space with their state and the number of instances currently running. Find your app and check if its state says “started”
- ‘cf app <app_name>` - this command is similar to the one above, but will also show you more detailed information about a particular app. Additionally, since the app is running, you can also check what is the current CPU usage, memory usage and disk utilization.
This step should be first since it’s the fastest way to check if the application is running on the Cloud Foundry Platform.
Check logs & events
If our app is running, you can check its lifecycle events with :
`cf events <app_name>`
This will help you diagnose what was happening with the app. Cloud Foundry could have been reporting some errors before the app finally started. This might be a sign of a potential issue. Another example might be when events show that our app is being restarted repeatedly. This could indicate a shortage of memory which in turn causes the Cloud Foundry platform to destroy the app container.
Events give you just a broad look on what has happened with the app, but if you want more details you need to check your logs. Cloud Foundry helps a lot with handling your logs. There are three ways to check them:
- `cf logs <app_name> --recent` - dumps only recent logs. It will output them to your console so you can use linux commands to filter them.
- `cf logs <app_name> - returns a real-time stream of the application logs.
- Configure syslog drain which will stream logs to your external log management tool (ex: Prometheus, Papertrail) - https://docs.cloudfoundry.org/devguide/services/log-management.html.
This method is as good as the maturity or consistency of your logs, but the Cloud Foundry platform also helps in the case of adding some standardization to your logs. Each log line will have the following info :
- Timestamp
- Log type – CF component that is origin of log line
- Channel – either OUT (logs emitted on stdout) or ERR (logs emitted on stderr)
- Message
Check your configuration
If you have investigated your logs and found out that the connection to some external service is failing, you must check the configuration that your app uses in its cloud environment. There are a few places you should look into:
- Examine your environment variables with the `cf env <app_name>` command. This will list all environment variables (container variables) and details of each binded service.
- `cf ssh <app_name> -i 0` enables you to SSH into container hosting your app. With the ‘i’ parameter you can point to a particular instance. Now, it is possible to check the files you are interested in to see if the configuration is set up properly.
- If you use any configuration server (like Spring Cloud Config), check if the connection to this server works. Make sure that the spring profiles are set up correctly and double-check the content of your configuration files.
Diagnose network traffic
There are cases in which your application runs properly, the entire configuration is correct, you don’t see anything extraordinary in your events and your logs don’t really show anything. This could be why:
- ou don’t log enough information in your app
- There is a network related issue
- Request processing is blocked at some point in your web server
With the first one, you can’t really do much if your app is already in production. You can only prevent such situations in the future by talking more effort in implementing proper logging. To check if the second issue relates to you:
- SSH to the Container/VM hosting your app and use the linux `tcpdump` command. Tcpdump is a network packet analyzer which can help you check if the traffic on an expected port is flowing.
- Using `netstat -l | grep <your_port>` you can check if there is a process that listens on your expected port. If it exists, you can verify if this is the proper one (i.e. Tomcat server).
- If your server listens on a proper port but you still don’t see the expected traffic with tcpdump then you might check firewalls, security groups and ACLs. You can use linux netcat (‘nc’ command) to verify if TCP connections can be established between the container hosting your app and the target server.
Print your thread stack
Your app is running and listening on a proper port, the TCP traffic is flowing correctly and you have well designed the logging system. But still there are no new logs for a particular request and you cannot diagnose at which point and where exactly your app processing has stopped.
In this scenario it might be useful to use a Java tool to print the current thread stack which is called jstack. It’s a very simple and handy tool recommended for diagnosing what is currently happening on your java server.
Once you have executed jstack -f , you will see the stack traces of all Java threads that run within a target JVM. This way you can check if some threads are blocked and on what execution point they’ve stopped.
Implement /health endpoints in your apps
A good practice in microservice architecture is to implement the ‘/health’ endpoint in each application. Basically, the responsibility of this endpoint is to return the application health information in a short and concise way. For example, you can return a list of app external services with a status for each one: UP or DOWN. If the status is DOWN, you can tell what caused the error. For example, ‘timeout when connecting to MySQL’.
From the security perspective, we can return the global UP/DOWN information for all unauthenticated users. It will be used to quickly determine if something is wrong. The list of all services with error details will be accessible only for authenticated users with proper roles.
In Spring Boot apps, if you add a dependency to the ‘spring-boot-starter-actuator’, there are extra ‘/health’ endpoints. Also, there is a simple way to extend the default behavior. All you need to do is implement your custom health indicator classes that will implement the `HealthIndicator` interface.
Use distributed HTTP tracing systems
If your system is composed of dozens of microservices and the interactions between them are getting more complex, then you might come across difficulties without any distributed tracing system. Fortunately, there are open source tools that solve such problems.
You can choose from HTrace, Zipkin or Spring Sleuth library that abstracts many concepts similar to distributed tracing. All this tools are based on the same concept of adding additional trace information to HTTP headers.
Certainly, a big advantage of using Spring Sleuth is that it is almost invisible for most users. Your interactions with external systems should be instrumented automatically by the framework. Trace information can be logged to a standard output or sent to a remote collector service when you can visualize your requests better.
Think about integrating APM tools
APM stands for Application Performance Management. These tools are often external services that help you to monitor your whole system health and diagnose potential problems. In most cases, you will need to integrate them with your applications. For example you might need to run some agent parallel to your app which will report your app diagnostics to external APM server in the background.
Additionally, you will have rich dashboards for visualizing your system’s state and its health. You have many ways to adjust and customize those dashboards according with your needs.
APM Examples : New Relic, Dynatrace, AppDynamics
These tools are must-haves for a highly available distributed environment.
Remote debugging in Cloud Foundry
Every developer is familiar with the concept of debugging, but less than 90% of time we are talking about local development debugging where you run the code on your machine. Sometimes, you receive a report that something is doesn’t behave the way it should on one of your testing environments. Of course, you could deploy a particular version on your local environment, but it is hard to simulate all aspects of this environment. In this case, it might be best to debug an application in a place where it is actually running. To perform a remote debug procedure on Cloud Foundry , see the below:
Please note that you must have the same source code version opened in your IDE. This method is very useful for development or testing environments. However, it shouldn’t be used on production environments.
Summary of application troubleshooting in cloud native
To sum up, I hope that all the above will help you with application troubleshooting problems with microservices in a distributed cloud environment and that everything will indeed work as expected, will be easily scaled and the system will be both highly available and resilient.
Kubernetes as a solution to container orchestration
Containerization
Kubernetes has become a synonym for containerization. Containerization, also known as operating-system-level virtualization provides the ability to run multiple isolated containers on the same Kernel. That is, on the same operating system that controls everything inside the system. It brings a lot of flexibility in terms of managing application deployment.
Deploying a few containers is not a difficult task. It can be done by means of a simple tool for defining and running multi-container Docker applications like Docker Compose. Doing it manually via command line interface is also a solution.
Challenges in the container environment
Since the container ecosystem moves fast it is challenging for developers to stay up-to-date with what is possible in the container environment. It’s usually in the production system where things get more complicated as mature architecture can consist of hundreds or thousands of containers. But then again, it’s not the deployment of such swarm that’s the biggest challenge.
What’s even more confusing is the quality of our system called High Availability. In other words, it is when multiple instances of the same container must be distributed across nodes available in the cluster. The type of the application that lives in a particular container that dictates the distribution algorithm that should be applied. Once the containers are deployed and distributed across the cluster, we encounter another problem: the system behavior in the presence of node failure.
Luckily enough, modern solutions provide a self-healing mechanism. Therefore, if a node hits the capacity limits or its down issues, the container will be redeployed on a different node to ensure stability. With that said, managing multiple containers without a sophisticated tool is almost impossible. This sophisticated tool is known as a container orchestrator. Companies have many options when it comes to platforms for running containers. Deciding which one is the best for a particular organization can be a challenging task itself. There are plenty of solutions on the market among which the most popular one is Kubernetes [1].
Kubernetes
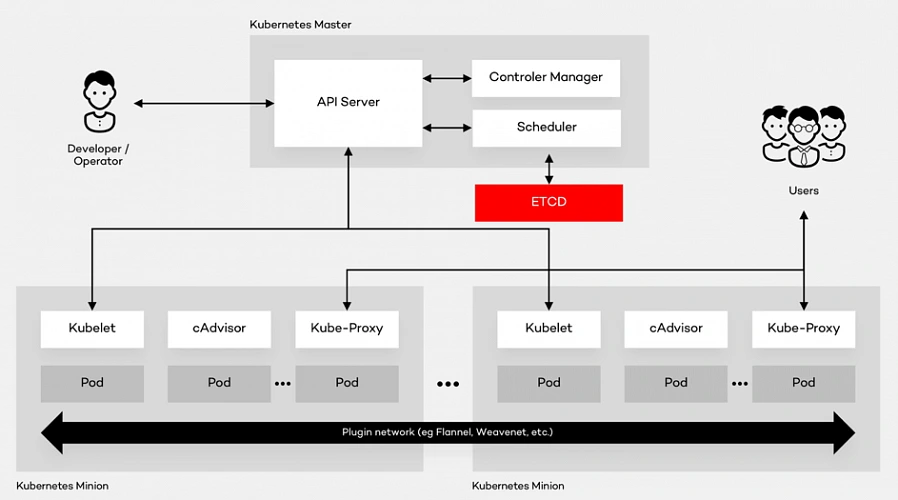
Kubernetes is the open source container platform first released by Google in 2014. The name Kubernetes, translated from Ancient Greek and means “Helmsman”. The whole idea behind this open-source project was based on Google’s experience of running containers at an enormous scale. The company uses Kubernetes for the Google Container Engine (GKE), their own Container as a Service (CaaS). And it shouldn’t be a surprise to anyone that numerous other platforms out there such as IBM Cloud, AWS or Microsoft Azure support Kubernetes. The tool can manage the two most popular types of containers – Docker & Rocket. Moreover, it helps organize networking, computing and storage – three nightmares of the microservice world. Its architecture is based on two types of nodes – Master and Minion as shown below:
Architecture glossary
- PI Server – entry point for REST commands. It processes and validates the requests and executes the logic.
- Scheduler – it supports the deployment of configured pods and services onto the nodes.
- Controller Manager – uses an apiserver to control the shared state of the cluster and makes changes if necessary.
- ETCD Storage – key-value store used mainly for shared configuration and service discovery.
- Kubelet – receives the configuration of a pod from the apiserver and makes sure that the right containers are running. It also communicates with the master node.
- cAdvisor – (Container Advisor) it collects and processes information about each running container. Most importantly, it helps container users understand the resource usage and performance characteristics of their containers.
- Kube - Proxy – runs on each node. It manages the networking routing for TCP (Transmission Control Protocol) and UDP (User Datagram Protocol) packets which are used for sending bits of data.
- Pod – the fundamental element of the architecture, a group of containers that, in a non-containerized setup, would all run on a single server.
Architecture description
A Pod provides abstraction of the container and makes it possible to group them and deploy on the same host. The containers that are in the same Pod share a network, storage and a run specification. Every single Minion Node runs a kubelet agent process which connects it to the Master Node as well as a kube-proxy which can do simple TCP and UDP stream forwarding. The Kubernetes architecture model assumes that Pods can communicate with other Pods, regardless of which host they land on. Besides, they also have a short lifetime: they’re created, destroyed and then created again depending on the server. Connectivity can be implemented in various methods (kube-router, L2 network etc.). In many cases, a simple overlay network based on a Flannel is a sufficient solution.
Summary
As a company with years of experience in the cloud evolution, we advise enterprises to think even up to ten years into the future when choosing the right platform . It all depends on where they see technology heading. Hopefully, this summary will help you understand the fundamentals of component containerization, the Kubernetes architecture and, in the end, make the right decision.