Bringing Visibility to Cloud-Native Applications


Working with cloud-native applications entails continuously tackling and implementing solutions to cross-cutting concerns. One of these concerns that every project is bound to run into comes to deploying highly scalable, available logging, and monitoring solutions.
You might ask, “how do we do that? Is it possible to find “one size fits all” solution for such a complex and volatile problem?” You need to look no further!
Taking into account our experience based on working with production-grade environments, we propose a generic architecture, built totally from open source components, that certainly provide you with the highly performant and maintainable workload. To put this into concrete terms, this platform is characterized by its:
- High availability – every component is available 24/7 providing users with constant service even in the case of a system failure.
- Resiliency – crucial data are safe thanks to redundancy and/or backups.
- Scalability – every component is able to be replicated on demand accordingly to the current load.
- Performance – ability to be used in any and all environments.
- Compatibility – easily integrated into any workflows.
- Open source – every component is accessible to anyone with no restrictions.
To build an environment that enables users to achieve outcomes described above, we decided to look at Elastic Stack, fully open source logging solution, structured in a modular way.
Elastic Stack
Each component has a specific function, allowing it to be scaled in and out as needed. Elastic stack is composed of:
- Elasticsearch – RESTful, distributed search and analytics engine built on Apache Lucene able to index copious amount of data.
- Logstash – server-side data processing pipeline, able to transform, filter and enrich events on the fly.
- Kibana – a feature-rich visualization tool, able to perform advanced analysis on your data.
While all this looks perfect, you still need to be cautious while deploying your Elastic Stack cluster. Any downtime or data loss caused by incorrect capacity planning can be detrimental to your business value. This is extremely important, especially when it comes to production environments. Everything has to be carefully planned, including worst-case scenarios. Concerns that may weigh on the successful Elastic stack configuration and deployment are described below.
High Availability
When planning any reliable, fault-tolerant systems, we have to distribute its critical parts across multiple, physically separated network infrastructures. It will provide redundancy and eliminate single points of failure.
Scalability
ELK architecture allows you to scale out quickly. Having good monitoring tools setup makes it easy to predict and react to any changes in the system’s performance. This makes it resilient and helps you optimize the cost of maintaining the solution.
Monitoring and Alerts
A monitoring tool along with a detailed set of alerting rules will save you a lot of time. It lets you easily maintain the cluster, plan many different activities in advance, and react immediately if anything bad happens to your software.
Resource optimization
In order to maximize the stack performance, you need to plan the hardware (or virtualized hardware) allocation carefully. While data nodes need efficient storage, ingesting nodes will need more computing power and memory. While planning this take into consideration the number of events you want to process and amount of data that has to be stored to avoid many problems in the future.
Proper component distribution
Make sure the components are properly distributed across the VMs. Improper setup may cause high CPU and memory usage, can introduce bottlenecks in the system and will definitely result in lower performance. Let’s take Kibana and ingesting node as an example. Placing them on one VM will cause poor user experience since UI performance will be affected when more ingesting power is needed and vice-versa.
Data Replication
Storing crucial data requires easy access to your data nodes. Ideally, your data should be replicated across multiple availability zones which will guarantee redundancy in case of any issues.
Architecture
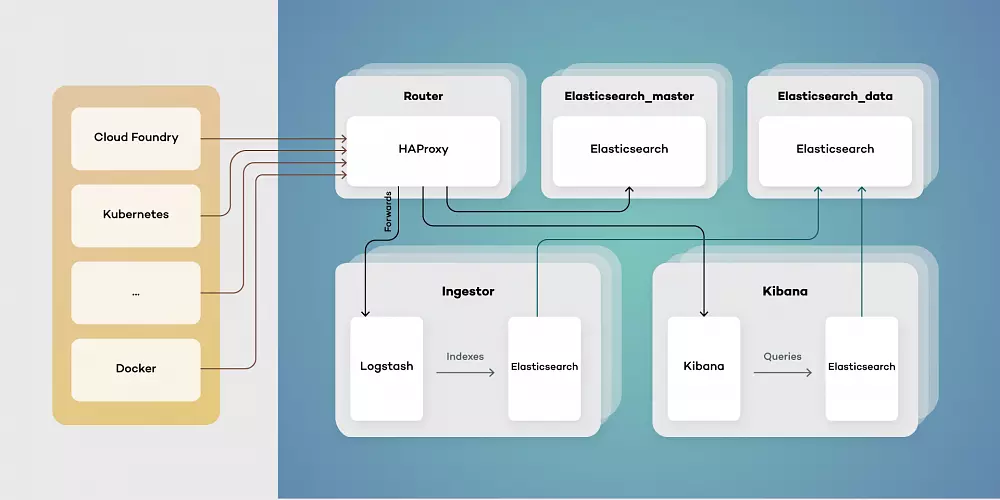
Our proposed architecture consists of five types of virtual machines – Routers, elastic masters, elastic data, ingestors, and Kibana instances. This toolset simplifies scaling of components while separating their responsibilities. Each of them has a different function:
- Elasticsearch_master – controls indexes and Elasticsearch master. Responsible for creating new indexes, rolling updates and monitoring clusters health.
- Elasticsearch_data – stores data and retrieves it as needed. Can be run both as hot and warm storage, as well as provides redundancy on data.
- Ingestor – exposes input endpoints for events both while transforming and enriching data stored in Elasticsearch.
- Kibana – provides users with visualizations by querying Elasticsearch data.
- Router – serves as a single point of entry, both for users and services producing data events.
Architecting your Elastic Stack deployment in this way allows for the simple upgrade procedure. Thanks to using a single point of entry, switching to a new version of Elastic Stack is as simple as pointing HAProxy to an upgraded cluster.
Using a clustered structure also allows for freely adding data nodes as needed when your traffic inevitably grows.
Is it insightful?
Share the article!
Check related articles
Read our blog and stay informed about the industry's latest trends and solutions.
see all articles