
Bartłomiej is a Software Developer and TL in GrapeUp with 5+ years of professional experience. Experienced in complex application development in various environments including overall app architecture design. He cooperates closely with customers providing inestimable knowledge-sharing support.
Read articles
How to set up Kafka integration test
Do you consider unit testing as not enough solution for keeping the application's reliability and stability? Are you afraid that somehow or somewhere there is a potential bug hiding in the assumption that unit tests should cover all cases? And also is mocking Kafka not enough for project requirements? If even one answer is ‘yes’, then welcome to a nice and easy guide on how to set up Integration Tests for Kafka using TestContainers and Embedded Kafka for Spring!
What is TestContainers?
TestContainers is an open-source Java library specialized in providing all needed solutions for the integration and testing of external sources. It means that we are able to mimic an actual database, web server, or even an event bus environment and treat that as a reliable place to test app functionality. All these fancy features are hooked into docker images, defined as containers. Do we need to test the database layer with actual MongoDB? No worries, we have a test container for that. We can not also forget about UI tests - Selenium Container will do anything that we actually need.
In our case, we will focus on Kafka Testcontainer.
What is Embedded Kafka?
As the name suggests, we are going to deal with an in-memory Kafka instance, ready to be used as a normal broker with full functionality. It allows us to work with producers and consumers, as usual, making our integration tests lightweight.
Before we start
The concept for our test is simple - I would like to test Kafka consumer and producer using two different approaches and check how we can utilize them in actual cases.
Kafka Messages are serialized using Avro schemas.
Embedded Kafka - Producer Test
The concept is easy - let's create a simple project with the controller, which invokes a service method to push a Kafka Avro serialized message.
Dependencies:
dependencies {
implementation "org.apache.avro:avro:1.10.1"
implementation("io.confluent:kafka-avro-serializer:6.1.0")
implementation 'org.springframework.boot:spring-boot-starter-validation'
implementation 'org.springframework.kafka:spring-kafka'
implementation('org.springframework.cloud:spring-cloud-stream:3.1.1')
implementation('org.springframework.cloud:spring-cloud-stream-binder-kafka:3.1.1')
implementation('org.springframework.boot:spring-boot-starter-web:2.4.3')
implementation 'org.projectlombok:lombok:1.18.16'
compileOnly 'org.projectlombok:lombok'
annotationProcessor 'org.projectlombok:lombok'
testImplementation('org.springframework.cloud:spring-cloud-stream-test-support:3.1.1')
testImplementation 'org.springframework.boot:spring-boot-starter-test'
testImplementation 'org.springframework.kafka:spring-kafka-test'
}
Also worth mentioning fantastic plugin for Avro. Here plugins section:
plugins {
id 'org.springframework.boot' version '2.6.8'
id 'io.spring.dependency-management' version '1.0.11.RELEASE'
id 'java'
id "com.github.davidmc24.gradle.plugin.avro" version "1.3.0"
}
Avro Plugin supports schema auto-generating. This is a must-have.
Link to plugin: https://github.com/davidmc24/gradle-avro-plugin
Now let's define the Avro schema:
{
"namespace": "com.grapeup.myawesome.myawesomeproducer",
"type": "record",
"name": "RegisterRequest",
"fields": [
{"name": "id", "type": "long"},
{"name": "address", "type": "string", "avro.java.string": "String"
}
]
}
Our ProducerService will be focused only on sending messages to Kafka using a template, nothing exciting about that part. Main functionality can be done just using this line:
ListenableFuture<SendResult<String, RegisterRequest>> future = this.kafkaTemplate.send("register-request", kafkaMessage);
We can’t forget about test properties:
spring:
main:
allow-bean-definition-overriding: true
kafka:
consumer:
group-id: group_id
auto-offset-reset: earliest
key-deserializer: org.apache.kafka.common.serialization.StringDeserializer
value-deserializer: com.grapeup.myawesome.myawesomeconsumer.common.CustomKafkaAvroDeserializer
producer:
auto.register.schemas: true
key-serializer: org.apache.kafka.common.serialization.StringSerializer
value-serializer: com.grapeup.myawesome.myawesomeconsumer.common.CustomKafkaAvroSerializer
properties:
specific.avro.reader: true
As we see in the mentioned test properties, we declare a custom deserializer/serializer for KafkaMessages. It is highly recommended to use Kafka with Avro - don't let JSONs maintain object structure, let's use civilized mapper and object definition like Avro.
Serializer:
public class CustomKafkaAvroSerializer extends KafkaAvroSerializer {
public CustomKafkaAvroSerializer() {
super();
super.schemaRegistry = new MockSchemaRegistryClient();
}
public CustomKafkaAvroSerializer(SchemaRegistryClient client) {
super(new MockSchemaRegistryClient());
}
public CustomKafkaAvroSerializer(SchemaRegistryClient client, Map<String, ?> props) {
super(new MockSchemaRegistryClient(), props);
}
}
Deserializer:
public class CustomKafkaAvroSerializer extends KafkaAvroSerializer {
public CustomKafkaAvroSerializer() {
super();
super.schemaRegistry = new MockSchemaRegistryClient();
}
public CustomKafkaAvroSerializer(SchemaRegistryClient client) {
super(new MockSchemaRegistryClient());
}
public CustomKafkaAvroSerializer(SchemaRegistryClient client, Map<String, ?> props) {
super(new MockSchemaRegistryClient(), props);
}
}
And we have everything to start writing our test.
@ExtendWith(SpringExtension.class)
@SpringBootTest
@AutoConfigureMockMvc
@TestInstance(TestInstance.Lifecycle.PER_CLASS)
@ActiveProfiles("test")
@EmbeddedKafka(partitions = 1, topics = {"register-request"})
class ProducerControllerTest {
All we need to do is add @EmbeddedKafka annotation with listed topics and partitions. Application Context will boot Kafka Broker with provided configuration just like that. Keep in mind that @TestInstance should be used with special consideration. Lifecycle.PER_CLASS will avoid creating the same objects/context for each test method. Worth checking if tests are too time-consuming.
Consumer<String, RegisterRequest> consumerServiceTest;@BeforeEach
void setUp() {
DefaultKafkaConsumerFactory<String, RegisterRequest> consumer = new DefaultKafkaConsumerFactory<>(kafkaProperties.buildConsumerProperties();
consumerServiceTest = consumer.createConsumer();
consumerServiceTest.subscribe(Collections.singletonList(TOPIC_NAME));
}
Here we can declare the test consumer, based on the Avro schema return type. All Kafka properties are already provided in the .yml file. That consumer will be used as a check if the producer actually pushed a message.
Here is the actual test method:
@Test
void whenValidInput_therReturns200() throws Exception {
RegisterRequestDto request = RegisterRequestDto.builder()
.id(12)
.address("tempAddress")
.build();
mockMvc.perform(
post("/register-request")
.contentType("application/json")
.content(objectMapper.writeValueAsBytes(request)))
.andExpect(status().isOk());
ConsumerRecord<String, RegisterRequest> consumedRegisterRequest = KafkaTestUtils.getSingleRecord(consumerServiceTest, TOPIC_NAME);
RegisterRequest valueReceived = consumedRegisterRequest.value();
assertEquals(12, valueReceived.getId());
assertEquals("tempAddress", valueReceived.getAddress());
}
First of all, we use MockMvc to perform an action on our endpoint. That endpoint uses ProducerService to push messages to Kafka. KafkaConsumer is used to verify if the producer worked as expected. And that’s it - we have a fully working test with embedded Kafka.
Test Containers - Consumer Test
TestContainers are nothing else like independent docker images ready for being dockerized. The following test scenario will be enhanced by a MongoDB image. Why not keep our data in the database right after anything happened in Kafka flow?
Dependencies are not much different than in the previous example. The following steps are needed for test containers:
testImplementation 'org.testcontainers:junit-jupiter'
testImplementation 'org.testcontainers:kafka'
testImplementation 'org.testcontainers:mongodb'
ext {
set('testcontainersVersion', "1.17.1")
}
dependencyManagement {
imports {
mavenBom "org.testcontainers:testcontainers-bom:${testcontainersVersion}"
}
}
Let's focus now on the Consumer part. The test case will be simple - one consumer service will be responsible for getting the Kafka message and storing the parsed payload in the MongoDB collection. All that we need to know about KafkaListeners, for now, is that annotation:
@KafkaListener(topics = "register-request")
By the functionality of the annotation processor, KafkaListenerContainerFactory will be responsible to create a listener on our method. From this moment our method will react to any upcoming Kafka message with the mentioned topic.
Avro serializer and deserializer configs are the same as in the previous test.
Regarding TestContainer, we should start with the following annotations:
@SpringBootTest
@ActiveProfiles("test")
@Testcontainers
public class AbstractIntegrationTest {
During startup, all configured TestContainers modules will be activated. It means that we will get access to the full operating environment of the selected source. As example:
@Autowired
private KafkaListenerEndpointRegistry kafkaListenerEndpointRegistry;
@Container
public static KafkaContainer kafkaContainer = new KafkaContainer(DockerImageName.parse("confluentinc/cp-kafka:6.2.1"));
@Container
static MongoDBContainer mongoDBContainer = new MongoDBContainer("mongo:4.4.2").withExposedPorts(27017);
As a result of booting the test, we can expect two docker containers to start with the provided configuration.
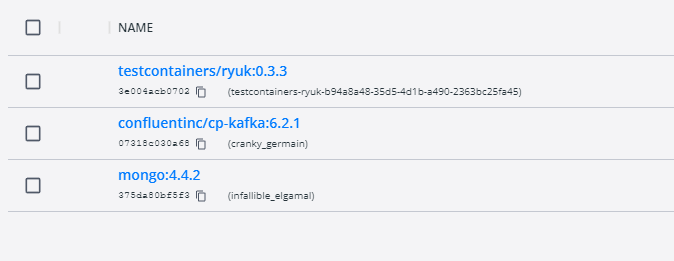
What is really important for the mongo container - it gives us full access to the database using just a simple connection uri. With such a feature, we are able to take a look what is the current state in our collections, even during debug mode and prepared breakpoints.
Take a look also at the Ryuk container - it works like overwatch and checks if our containers have started correctly.
And here is the last part of the configuration:
@DynamicPropertySource
static void dataSourceProperties(DynamicPropertyRegistry registry) {
registry.add("spring.kafka.bootstrap-servers", kafkaContainer::getBootstrapServers);
registry.add("spring.kafka.consumer.bootstrap-servers", kafkaContainer::getBootstrapServers);
registry.add("spring.kafka.producer.bootstrap-servers", kafkaContainer::getBootstrapServers);
registry.add("spring.data.mongodb.uri", mongoDBContainer::getReplicaSetUrl);
}
static {
kafkaContainer.start();
mongoDBContainer.start();
mongoDBContainer.waitingFor(Wait.forListeningPort()
.withStartupTimeout(Duration.ofSeconds(180L)));
}
@BeforeTestClass
public void beforeTest() {
kafkaListenerEndpointRegistry.getListenerContainers().forEach(
messageListenerContainer -> {
ContainerTestUtils
.waitForAssignment(messageListenerContainer, 1);
}
);
}
@AfterAll
static void tearDown() {
kafkaContainer.stop();
mongoDBContainer.stop();
}
DynamicPropertySource gives us the option to set all needed environment variables during the test lifecycle. Strongly needed for any config purposes for TestContainers. Also, beforeTestClass kafkaListenerEndpointRegistry waits for each listener to get expected partitions during container startup.
And the last part of the Kafka test containers journey - the main body of the test:
@Test
public void containerStartsAndPublicPortIsAvailable() throws Exception {
writeToTopic("register-request", RegisterRequest.newBuilder().setId(123).setAddress("dummyAddress").build());
//Wait for KafkaListener
TimeUnit.SECONDS.sleep(5);
Assertions.assertEquals(1, taxiRepository.findAll().size());
}
private KafkaProducer<String, RegisterRequest> createProducer() {
return new KafkaProducer<>(kafkaProperties.buildProducerProperties());
}
private void writeToTopic(String topicName, RegisterRequest... registerRequests) {
try (KafkaProducer<String, RegisterRequest> producer = createProducer()) {
Arrays.stream(registerRequests)
.forEach(registerRequest -> {
ProducerRecord<String, RegisterRequest> record = new ProducerRecord<>(topicName, registerRequest);
producer.send(record);
}
);
}
}
The custom producer is responsible for writing our message to KafkaBroker. Also, it is recommended to give some time for consumers to handle messages properly. As we see, the message was not just consumed by the listener, but also stored in the MongoDB collection.
Conclusions
As we can see, current solutions for integration tests are quite easy to implement and maintain in projects. There is no point in keeping just unit tests and counting on all lines covered as a sign of code/logic quality. Now the question is, should we use an Embedded solution or TestContainers? I suggest first of all focusing on the word “Embedded”. As a perfect integration test, we want to get an almost ideal copy of the production environment with all properties/features included. In-memory solutions are good, but mostly, not enough for large business projects. Definitely, the advantage of Embedded services is the easy way to implement such tests and maintain configuration, just when anything happens in memory.
TestContainers at the first sight might look like overkill, but they give us the most important feature, which is a separate environment. We don't have to even rely on existing docker images - if we want we can use custom ones. This is a huge improvement for potential test scenarios.
What about Jenkins? There is no reason to be afraid also to use TestContainers in Jenkins. I firmly recommend checking TestContainers documentation on how easily we can set up the configuration for Jenkins agents.
To sum up - if there is no blocker or any unwanted condition for using TestContainers, then don't hesitate. It is always good to keep all services managed and secured with integration test contracts.
How to manage fire trucks – IoT architecture with isolated applications and centralized management system
Welcome to a short cycle of articles that shows a way to combine network techniques and AWS services for a mission-critical automotive system .
We’ll show you how to design and implement an IoT system with a complex edge architecture.
The cycle consists of three articles and shows the architecture design, a step-by-step implementation guide, and some pitfalls with the way to overcome these.
Let’s start!
AWS IoT usage to manage vehicle fleet
Let’s create an application. But this won’t be a typical, yet another CRUD-based e-commerce system. This time, we’d like to build an IoT-based fleet-wise system with distributed (on-edge/in-cloud) computing.
Our customer is an automotive company that produces fire trucks. We’re not interested in engine power, mechanical systems, and firefighters' equipment. We’re hired to manage the fleet of vehicles for both the producer and its customers.
Each truck is controlled by a central, “rule-them-all” computer connected to all vehicles CAN buses, and whole extra firefighters’ equipment. The computer sends basic vehicle data (fuel level, tire pressure, etc.) to the fire station and a central emergency service supervisor. It receives new orders, calculates the best route to targets and controls all the vehicle equipment - pumps, lights, signals, and of course – the ladder. Also, it sends some telemetry and usage statistics to the producer to help design even better trucks in the future.
However, those trucks are not the same. For instance, in certain regions, the cabin must be airtight, so extra sensors are used. Some cities integrate emergency vehicles with city traffic light systems to clear the route for a running truck. Some stations require specialized equipment like winches, extra lights, power generators, crew management systems, etc.
Moreover, we need to consider that those trucks often operate in unpleasant conditions, with a limited and unreliable Internet connection available.
Of course, the customer would like to have a cloud-based server to manage everything both for the producer and end users - to collect logs and metrics with low latency, to send commands with no delay, and with a colorful, web-based, easy-to-use GUI.
Does it sound challenging? Let's break it down!
Requirements
Based on a half-an-hour session with the customer, we've collected the following, a bit chaotic, set of business requirements:
- a star-like topology system, with a cloud in the center and trucks around it,
- groups of trucks are owned by customers - legal entities that should have access only to their trucks,
- each group that belongs to a customer may be customized by adding extra components, both hardware-, or software-based,
- each truck is controlled by identical, custom, Linux-based computers running multiple applications provided by the customer or third parties,
- truck-controlling computers are small, ARM-based machines with limited hardware and direct Internet access via GSM,
- Internet connection is usually limited, expensive, and non-reliable,
- the main computer should host common services, like GPS or time service,
- some applications are built of multiple components (software and hardware-based) - hardware components communicate with the main computers via the in-vehicle IP network,
- the applications must communicate with their servers over the Internet, and we need to control (filter/whitelist) this traffic,
- each main computer is a router for the vehicle network,
- each application should be isolated to minimize a potential attack scope,
- components in trucks may be updated by adding new software or hardware components, even after leaving the production line,
- the cloud application should be easy - read-only dashboards, truck data dump, send order, both-way emergency messages broadcast,
- new trucks can be added to the system every day,
- class-leading security is required - user and privileges management, encrypted and signed communication, operations tracking, etc.
- provisioning new vehicles to the system should be as simple as possible to enable the factory workers to do it.
As we’ve learned so far, the basic architecture is as shown in the diagram below.
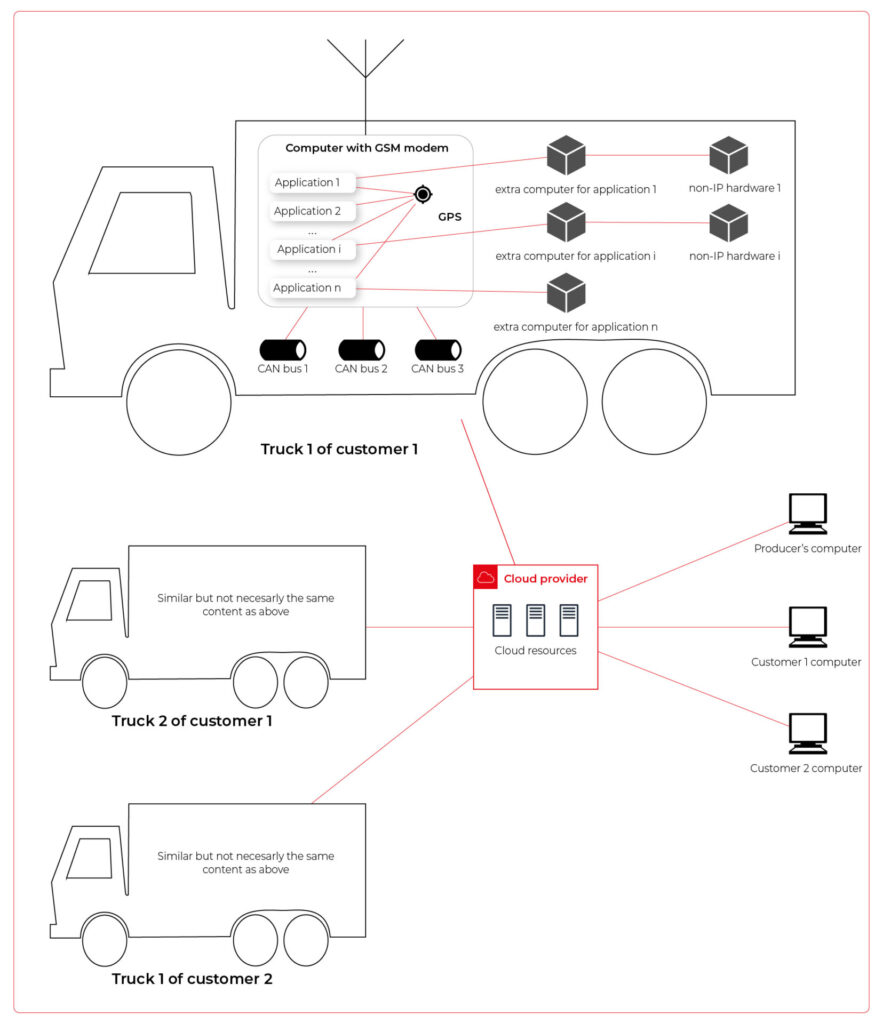
Our job is to propose a detailed architecture and prove the concept. Then, we’ll need a GPT-based instrument bench of developers to hammer it down.
The proposed architecture
There are two obvious parts of the architecture - the cloud one and the truck one. The cloud one is easy and mostly out-of-scope for the article. We need some frontend, some backend, and some database (well, as usual). In the trucks, we need to separate applications working on the same machine and then isolate traffic for each application. It sounds like containers and virtual networks. Before diving into each part, we need to solve the main issue - how to communicate between trucks and the cloud.
Selecting the technology
The star-like architecture of the system seems to be a very typical one - there is a server in the center with multiple clients using its services. However, in this situation, we can't distinguish between resources/services supplier (the server) and resources/services consumers (the clients). Instead, we need to consider the system as a complex, distributed structure with multiple working nodes, central management, and 3rd party integration. Due to the isolation, trucks’ main computers should containerize running applications. We could use Kubernetes clusters in trucks and another one in the cloud, but in that case, we need to implement everything manually – new truck onboarding, management at scale, resource limiting for applications, secured communication channels, and OTA updates. In the cloud, we would need to manage the cluster and pods, running even when there is no traffic.
An alternative way is the IoT. Well, as revealed in the title, this is the way that we have chosen. IoT provides a lot of services out-of-the-box - the communication channel, permissions management, OTA updates, components management, logs, metrics, and much more. Therefore, the main argument for using it was speeding up the deployment process.
However, we need to keep in mind that IoT architecture is not designed to be used with complex edge devices. This is our challenge, but fortunately, we are happy to solve it.
Selecting the cloud provider
The customer would like to use a leading provider, which reduces the choice to the top three in the World: AWS, MS Azure, and GCP.
The GCP IoT Core is the least advanced solution. It misses a lot of concepts and services available in the competitors, like a digital twin creation mechanism, complex permissions management, security evaluation, or a complex provisioning mechanism.
The Azure IoT is much more complex and powerful. On the other hand, it suffers from shortcomings in documentation, and - what is most important - some features are restricted to Microsoft instruments only (C#, Visual Studio, or PowerShell). On the other hand, it provides seamless AI tool integration, but it’s not our case for now.
But the last one – AWS IoT – fits all requirements and provides all the services needed. Two MQTT brokers are available, plenty of useful components (logs forwarding, direct tunnel for SSH access, complex permission management), and almost no limitation for IoT Core client devices. There is much more from AWS Greengrass - an extended version with higher requirements (vanilla C is not enough), but we can easily fulfill those requirements with our ARM-based trucks’ computers.
The basic architecture
Going back to the start-like topology, the most important part is the communication between multiple edge devices and the core. AWS IoT provides MQTT to enable a TCP-based, failure-resistant communication channel with a buffer that seamlessly keeps the communication on connection lost. The concept offers two MQTT brokers (in the cloud and on the edge) connected via a secured bridge. This way, we can use the MQTT as the main communication mechanism on the edge and decide which topics should be bridged and transferred to the cloud. We can also manage permissions for each topic on both sides as needed.
The cloud part is easy – we can synchronize the IoT MQTT broker with another messaging system (SNS/SQS, Kafka, whatever you like) or read/write it directly from our applications.
The edge part is much more complex. In the beginning, let’s assume that there are two applications running as executable programs on the edge. Each of these uses its own certificate to connect to the edge broker so we can distinguish between them and manage their permissions. It brings up some basic questions – how to provide certificates and ensure that one application won’t steal credentials from another. Fortunately, AWS IoT Greengrass supplies a way to run components as docker containers – it creates and provides certificates and uses IPC (inter-process communication) to allow containers to use the broker. Docker ensures isolation with low overhead, so each application is not aware of the other one. See the official documentation for details: Run a Docker container - AWS IoT Greengrass (amazon.com) .
Please note the only requirement for the applications, which is, in fact, the requirement we make to applications’ providers: we need docker images with applications that use AWS IoT SDK for communication.
See the initial architecture in the picture below.
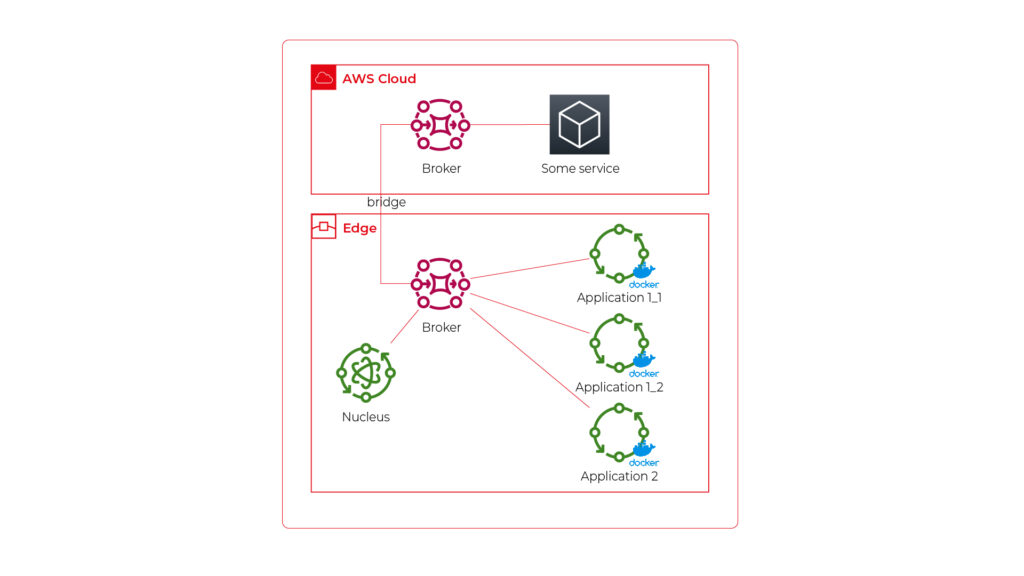
As you can see, Application 1 contains two programs (separate docker containers) communicating with each other via the broker: Application 1_1 and Application 1_2. Thanks to the privileges management, we are sure that Application 2 can’t impact or read this communication. If required, we can also configure a common topic accessible by both applications.
Please also note that there is one more component – Nucleus. You can consider it as an orchestrator required by AWS IoT to rule the system.
Of course, we can connect thousands of similar edges to the same cloud, but we are not going to show it on pictures for readability reasons. AWS IoT provides deployment groups with versioning for OTA updates based on typical AWS SDK. Therefore, we can expose a user-friendly management system (for our client and end users) to manage applications running on edge at scale.
Virtual networks
Now, let’s challenge the architecture with a more complex scenario. Let’s assume that Application 2 communicates with an in-cabin air quality sensor – a separate computer that is in the same IP network. We can assume the sensor is a part of Application 2, and our aim is to enable such communication but also to hide it from Application 1. Let’s add some VLANs and utilize network interfaces.
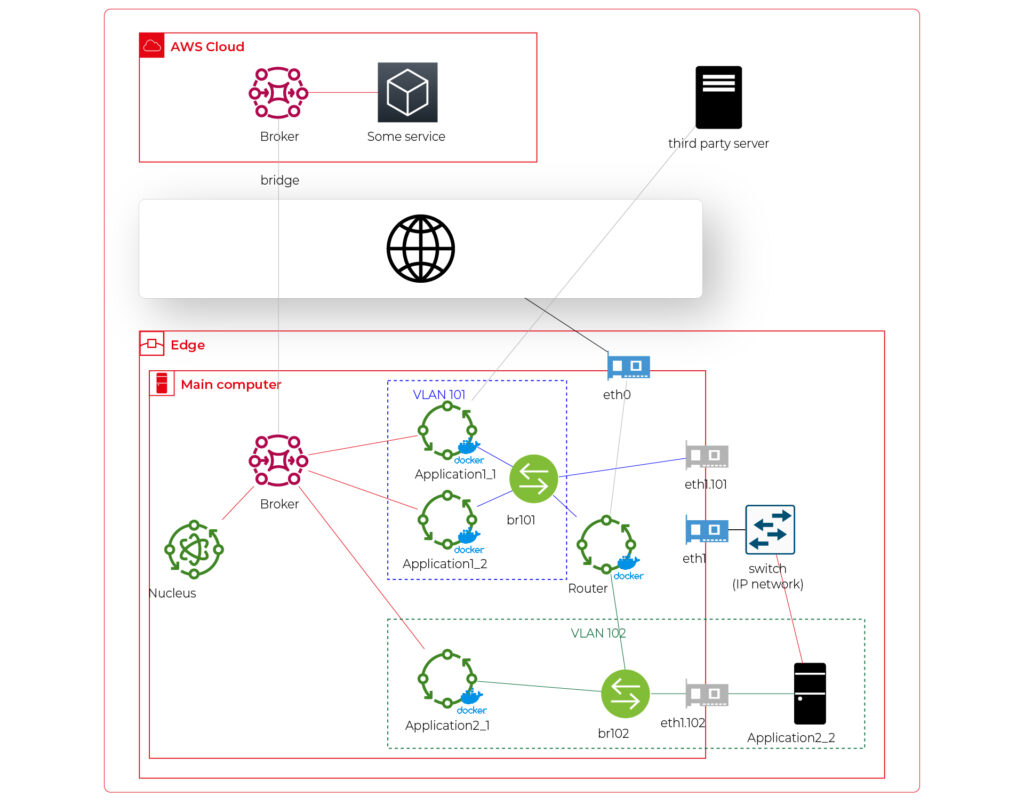
Starting from the physical infrastructure, the main computer uses two interfaces – eth0 to connect to the Internet and eth1 connected to a physical, managed switch (the “in-vehicle IP network” mentioned above). The Application 2_2 computer (the air quality sensor) is connected to the switch to a port tagged as VLAN 102, and the switch is connected to eth1 via a trunk port.
The eth0 interface is used by the main computer (host) to communicate with the Internet, so the main MQTT bridging is realized via this interface. On the other hand, there is also a new Greengrass-docker component called router. It’s connected to eth0 and to two virtual bridges – br101 and br102. Those bridges are not the same as the MQTT bridge. This time, we need to use the kernel-based Linux feature “bridge,” which is a logical, virtual network hub. Those bridges are connected to virtual network interfaces eth1.101 and eth1.102 and to applications’ containers.
This way, Application 1 uses its own VLAN 101 (100% virtual), and Application 2 uses its own VLAN 102 (holding both virtual and physical nodes). The application separation is still ensured, and there is no logical difference between virtual and mixed VLANs. Applications running inside VLANs can’t distinguish between physical and virtual nodes, and all IP network features (like UDP broadcasting and multicasting) are allowed. Note that nodes belonging to the same application can communicate omitting the MQTT (which is fine because the MQTT may be a bottleneck for the system).
Moreover, there is a single security-configuration point for all applications. The router container is the main gateway for all virtual and physical application-nodes, so we can configure a firewall on it or enable restricted routes between specific nodes between applications if needed. This way, we can enable applications to communicate with third-party servers over the Internet (see Application 1_1 in the picture), to communicate with individual nodes of the applications without restrictions, and to control the entire application-related traffic in a single place. And this place – the router – is just another Greengrass component, ready to be redeployed as a part of the OTA update. Also, the router is a good candidate to serve traffic targeting all networks (and all applications), e.g., to broadcast GPS position via UDP or to act as the network time server.
One more broker
What if… the application is provided as a physical machine only?
Well, as the main communication channel is MQTT, and the direct edge-to-Internet connection is available but limited, we would like to enable a physical application to use the MQTT. MQTT is a general standard for many integrated systems (small computers with limited purposes), but our edge MQTT broker is AWS-protected, so there are two options available. We can force the application supplier to be AWS-Greengrass compatible, or we need another broker. As we’re pacifists and we can’t stand forcing anybody to do anything, let’s add one more broker and one more bridge.
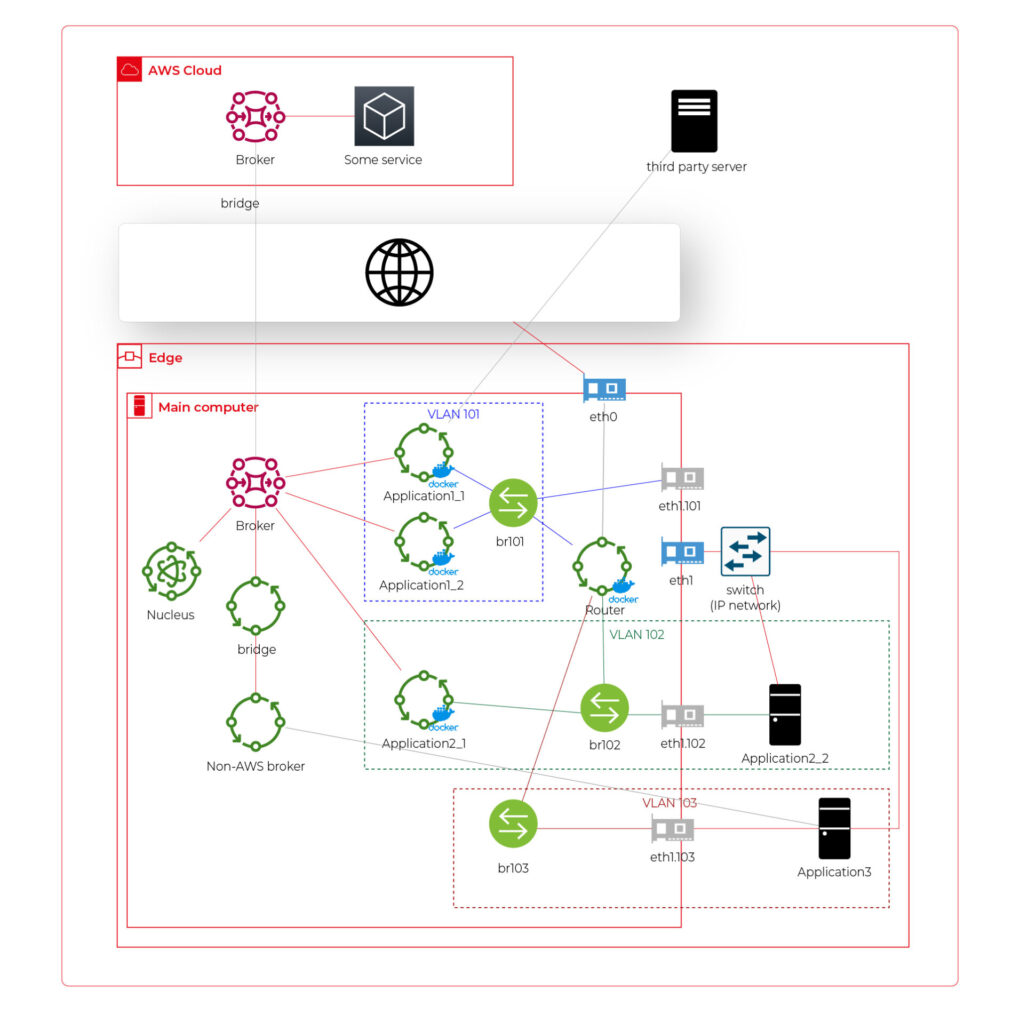
This time, there are two new components. The first one, an MQTT broker (Mosquitto or similar), interacts with Application 3. As we can’t configure the Mosquitto to act as a bridge for the AWS-managed broker, there is one more, custom application running on the server for this purpose only – a Greengrass component called “bridge”. This application connects to both local MQTT brokers and routes specific messages between them, as configured. Please note that Application 3 is connected to its own VLAN even if there are no virtual nodes. The reason is – there are no virtual nodes yet, but we’d like to keep the system future-proof and consistent. This way, we keep the virtual router as a network gateway for Application 3, too. Nevertheless, the non-AWS broker can listen to specific virtual interfaces, including eth1.103 in this case, so we can enable it for specific VLANs (application) if needed.
Summary
The article shows how to combine AWS IoT, docker, and virtual networks to achieve a future-proof fleet management system with hardware- and software-based applications at scale. We can use AWS tools to deliver new applications to edge devices and manage groups evoking truck owners or truck models. Each vehicle can be equipped with an ARM computer that uses AWS-native fleet provisioning on OS initialization to join the system. The proposed structure may seem to be complex, but you need to configure it only once to fulfill all requirements specified by the client.
However, theory is sometimes easier than practice, so we encourage you to read the following article with implementation details .
Vehicle fleet as IoT – virtual networks on edge
In the earlier article , we’ve covered the detailed architecture of a fleet management system based on AWS IoT and on-edge virtual networks. Now, we can dive into implementation. Let’s create a prototype of an edge network with two applications running together on both virtual and physical nodes and with isolated virtual networks. As we don’t have fire trucks on hand, we use three computers (the main truck ARM computer simulated by a Raspberry Pi and two application nodes running on laptops) and a managed switch to connect them together.
Overview of topics and definitions used in the material
In this chapter, we provide concise explanations of key networking concepts and technologies relevant to the architecture discussed earlier. These definitions will help readers better understand the underlying mechanisms that enable efficient and flexible communication between Docker containers, the host system, and external devices. Familiarizing yourself with these concepts will facilitate a deeper understanding of the networking aspects of the presented system and their interrelationships.
- Docker Networking : a system that enables containers to communicate with each other and external networks. It provides various network drivers and options to support different network architectures and requirements, including bridge, host, overlay, and IPvlan/MACvlan drivers. Docker networking creates virtual networks and attaches containers to these networks. Each network has a unique IP address range, and containers within a network can communicate using their assigned IP addresses. Docker uses network drivers to manage container connectivity and network isolation.
- IPvlan : a Docker network driver that enables efficient container-to-container and container-to-external network communication by sharing the parent interface's MAC address with its child interfaces. In the context of the router Docker image in the presented topic, IPvlan provides efficient routing between multiple networks and reduces the management overhead associated with MAC addresses.
- Docker Bridge : a virtual network device that connects multiple Docker container networks, allowing containers to communicate with each other and the host system. By default, Docker creates a bridged network named "docker0" for containers to use. Users can create custom bridge networks to segment and isolate container traffic.
- Linux Bridge : a kernel-based network device that forwards traffic between network segments. It operates at the data link layer, similar to how ethernet frames function within the TCP/IP model. Linux Bridges are essential in creating virtual network interfaces for entities such as virtual machines and containers.
- veth : (Virtual Ethernet) a Linux kernel network device that creates a pair of connected virtual network interfaces. Docker uses veths to connect containers to their respective networks, with one end attached to the container and the other end attached to the network's bridge. In a bridged Docker network, veth pairs are created and named when a container is connected to a Docker bridge network, with one end of the veth pair being assigned a unique identifier within the container's network namespace and the other end being assigned a unique identifier in the host's network namespace. The veth pair allows seamless communication between the container and the bridge network. In simple words – veth is a virtual cable between (virtual or not) interfaces of the same machine.
- Network namespace : Docker provides containers with isolated network stacks, ensuring each container has its own private IPs and ports. VLANs (Virtual Local Area Networks) operate at the data link layer, allowing for the creation of logically segmented networks within a physical network for improved security and manageability. When combined in Docker, containers can be attached directly to specific VLANs, marrying Layer 2 (VLAN) and Layer 3 (namespaces) isolation.
- VLAN (Virtual Local Area Network) : a logical network segment created by grouping physical network devices or interfaces. VLANs allow for traffic isolation and efficient use of network resources by separating broadcast domains.
- iptable : a Linux command-line utility for managing packet filtering and network address translation (NAT) rules in the kernel's network filter framework. It provides various mechanisms to inspect, modify, and take actions on packets traversing the network stack.
- masquerade : a NAT technique used in iptables to mask the source IP address of outgoing packets with the IP address of the network interface through which the packets are being sent. This enables multiple devices or containers behind the masquerading device to share a single public IP address for communication with external networks. In the context of the presented topic, masquerading can be used to allow Docker containers to access the Internet through the router Docker image.
Solution proposal with description and steps to reproduce
Architecture overview

The architecture described consists of a Router Docker container, two applications’ containers (Container1 and Container2), a host machine, and two VLANs connected to a switch with two physical devices. The following is a detailed description of the components and their interactions.
Router Docker container
The container has three interfaces:
- eth0 (10.0.1.3): Connected to the br0net Docker network (10.0.1.0/24).
- eth1 (192.168.50.2): Connected to the home router and the internet, with the gateway set to 192.168.50.1.
- eth2 (10.0.2.3): Connected to the br1net Docker network (10.0.2.0/24).
Docker containers
Container1 (Alpine) is part of the br0net (10.0.1.0/24) network, connected to the bridge br0 (10.0.1.2).
Container2 (Alpine) is part of the br1net (10.0.2.0/24) network, connected to the bridge br1 (10.0.2.2).
Main edge device – Raspberry Pi or a firetruck main computer
The machine hosts the entire setup, including the router Docker image and the Docker containers (Container1 and Container2). It has two bridges created: br0 (10.0.1.2) and br1 (10.0.2.2), which are connected to their respective Docker networks (br0net and br1net)
VLANs and switch
The machine’s bridges are connected to two VLANs: enp2s0.1 (10.0.1.1) and enp2s0.2 (10.0.2.1). The enp2s0 interface is configured as a trunk connection to a switch, allowing it to carry traffic for multiple VLANs simultaneously.
Two devices are connected to the switch, with Device1 having an IP address of 10.0.1.5 and Device2 having an IP address of 10.0.2.5
DHCP Server and Client
Custom DHCP is required because of the IP assignment for Docker containers. Since we would like to maintain consistent addressing between both physical and virtual nodes in each VLAN, we let DHCP handle physical nodes in the usual way and assign addresses to virtual nodes (containers) by querying the DHCP server and assigning addresses manually to bypass the Docker addressing mechanism.
In short - the presented architecture describes a way to solve the non-trivial problem of isolating Docker containers inside the edge device architecture. The main element responsible for implementing the assumptions is the Router Docker container, which is responsible for managing traffic inside the system. The Router isolates network traffic between Container1 and Container2 containers using completely separate and independent network interfaces.
The aforementioned interfaces are spliced to VLANs via bridges, thus realizing the required isolation assumptions. The virtual interfaces on the host side are already responsible for exposing externally only those Docker containers that are within the specific VLANs. The solution to the IP addressing problem for Docker containers is also worth noting. The expected result is to obtain a form of IP addressing that will allow a permanent address assignment for existing containers while retaining the possibility of dynamic addressing for new components.
The architecture can be successfully used to create an end-to-end solution for edge devices while meeting strict security requirements.
Step-by-step setup
Now we start the implementation!
VLANs [execute on host]
Let’s set up VLANs.
enp2s0.1
auto enp2s0.1
iface enp2s0.1 inet static
address 10.0.1.1
network 10.0.1.0
netmask 255.255.255.0
broadcast 10.0.1.255

enp2s0.2
auto enp2s0.2
iface enp2s0.2 inet static
address 10.0.2.1
network 10.0.2.0
netmask 255.255.255.0
broadcast 10.0.2.255
Bridges [execute on host]
We should start by installing bridge-utils, a very useful tool for bridge setup.
sudo apt install bridge-utils
Now, let’s config the bridges.
sudo brctl addbr br0
sudo ip addr add 10.0.1.1/24 dev br0
sudo brctl addif br0 enp2s0
sudo ip link set br0 up

sudo brctl addbr br1
sudo ip addr add 10.0.2.1/24 dev br0
sudo brctl addif br0 enp2s0
sudo ip link set br0 up
Those commands create virtual brX interfaces, set IP addresses, and assign physical interfaces. This way, we bridge physical interfaces with virtual ones that we will create soon – it’s like a real bridge, connected to only one river bank so far.
Docker networks [execute on host]
Network for WLAN interface.
docker network create -d ipvlan --subnet=192.168.50.0/24 --gateway=192.168.50.1 -o ipvlan_mode=l2 -o parent=wlp3s0f0 wlan
Network for bridge interface br0.
docker network create --driver=bridge --subnet=10.0.1.0/24 --gateway=10.0.1.2 --opt "com.docker.network.bridge.name=br0" br0net
Network for bridge interface br1.
docker network create --driver=bridge --subnet=10.0.2.0/24 --gateway=10.0.2.2 --opt "com.docker.network.bridge.name=br1" br1net
Now, we have empty docker networks connected to the physical interface (wlp3s0f0 – to connect containers the Internet) or bridges (br0net and br1net – for VLANs). The next step is to create containers and assign those networks.
Docker containers [execute on host]
Let’s create the router container and connect it to all Docker networks – to enable communication in both VLANs and the WLAN (Internet).
docker create -it --cap-add=NET_ADMIN --cap-add=SYS_ADMIN --cap-add=NET_BROADCAST --network=br0net --sysctl net.ipv4.icmp_echo_ignore_broadcasts=0 --ip=10.0.1.3 --name=router alpine
docker network connect router wlan
docker network connect router br1net
Now, we create applications’ containers and connect them to proper VLANs.
docker create -it --cap-add=NET_ADMIN --cap-add=SYS_ADMIN --cap-add=NET_BROADCAST --network=br0net --sysctl net.ipv4.icmp_echo_ignore_broadcasts=0 --name=container1 alpine

docker create -it --cap-add=NET_ADMIN --cap-add=SYS_ADMIN --cap-add=NET_BROADCAST --network=br1net --sysctl net.ipv4.icmp_echo_ignore_broadcasts=0 --name=container2 alpine
OK, let’s start all containers.
docker start router
docker start container1
docker start container2
Now, we’re going to configure containers. To access Docker images’ shells, use the command
docker exec -it <image_name> sh.
Router container setup [execute on Router container]
Check the interface’s IP addresses. The configuration should be as mentioned below.
eth0      Link encap:Ethernet  HWaddr 02:42:0A:00:01:03
          inet addr:10.0.1.3  Bcast:10.0.1.255  Mask:255.255.255.0
          UP BROADCAST RUNNING MULTICAST  MTU:1500  Metric:1
          RX packets:745 errors:0 dropped:0 overruns:0 frame:0
          TX packets:285 errors:0 dropped:0 overruns:0 carrier:0
          collisions:0 txqueuelen:0
          RX bytes:142276 (138.9 KiB)  TX bytes:21966 (21.4 KiB)

eth1      Link encap:Ethernet  HWaddr 54:35:30:BC:6F:59
          inet addr:192.168.50.2  Bcast:192.168.50.255  Mask:255.255.255.0
          UP BROADCAST RUNNING MULTICAST  MTU:1500  Metric:1
          RX packets:4722 errors:0 dropped:0 overruns:0 frame:0
          TX packets:1515 errors:0 dropped:0 overruns:0 carrier:0
          collisions:0 txqueuelen:0
          RX bytes:3941156 (3.7 MiB)  TX bytes:106741 (104.2 KiB)

eth2      Link encap:Ethernet  HWaddr 02:42:0A:00:02:01
          inet addr:10.0.2.3  Bcast:10.255.255.255  Mask:255.0.0.0
          UP BROADCAST RUNNING MULTICAST  MTU:1500  Metric:1
          RX packets:829 errors:0 dropped:0 overruns:0 frame:0
          TX packets:196 errors:0 dropped:0 overruns:0 carrier:0
          collisions:0 txqueuelen:0
          RX bytes:190265 (185.8 KiB)  TX bytes:23809 (23.2 KiB)

lo        Link encap:Local Loopback
          inet addr:127.0.0.1  Mask:255.0.0.0
          UP LOOPBACK RUNNING  MTU:65536  Metric:1
          RX packets:60 errors:0 dropped:0 overruns:0 frame:0
          TX packets:60 errors:0 dropped:0 overruns:0 carrier:0
          collisions:0 txqueuelen:1000
          RX bytes:5959 (5.8 KiB)  TX bytes:5959 (5.8 KiB)
Then let’s set up the iptables. You can omit the first command if the iptables package is already installed. The second command configures the masquerade, and the rest of them configure routing rules.
apk add ip6tables iptables
iptables -t nat -A POSTROUTING -o eth1 -j MASQUERADE
iptables -P INPUT ACCEPT
iptables -P FORWARD DROP
iptables -P OUTPUT ACCEPT
iptables -A FORWARD -i eth1 -o eth0 -j ACCEPT
iptables -A FORWARD -i eth1 -o eth2 -j ACCEPT
iptables -A FORWARD -i eth2 -o eth1 -j ACCEPT
iptables -A FORWARD -i eth0 -o eth1 -j ACCEPT
Now, we hide the internal addresses of outgoing packets (the masquerade), and the networks are isolated. Please note that there is no routing configured on the host machine, and it’s not even a gateway for both containerized and physical network nodes.
In the mentioned config, test containers will communicate with the external environment by physical interfaces on the router container, and in other words – they will be exposed to the Internet by the Docker router container. Router, in addition to enabling communication between VLANs and the Internet, may also allow communication between VLANs or even specific VLAN nodes of different VLANs. Thus, this container has become the main routing and filtering point for network traffic.
Container1 setup [execute on Container1]
route del default
ip route add default via 10.0.1.3
Container2 setup [execute on Container2]
route del default
ip route add default via 10.0.2.3
As you can see, the container configuration is similar; all we need to do is set up the default route via the router container instead of the docker-default one. In the real-world scenario, this step should be done via the DHCP server.
Switch setup [execute on the network switch]
The configuration above requires a manageable switch. We don’t enforce any specific model, but the switch must support VLAN tagging on ports with the trunk option for a port that combines traffic for multiple VLANs. The configuration, of course, depends on the device. Pay attention to the trunk port of the device, which is responsible for traffic from the switch to our host. In our case, the device1 is connected to a switch port tagged as VLAN1, and the device2 is connected to a switch port tagged as VLAN2. The enp2s0 port of the host computer is connected to a switch port configured as a trunk - to combine traffic of multiple VLANs in a single communication link.
Summary
We’ve managed together to conduct the network described in the first article. You can play with the network with ICMP to verify which nodes can access each other and, more importantly, which nodes can’t be reached outside their virtual networks.
Here is a scenario for the ping test. The following results prove that the created architecture fulfills its purpose and achieves the required insulation.
Source Target Ping status Explanation Container1 Device1 OK VLAN 1 Device1 Container1 OK VLAN 1 Container1 Router (10.0.1.3) OK VLAN 1 Device1 Router (10.0.1.3) OK VLAN 1 Container1 Internet (8.8.8.8) OK VLAN 1 to Internet via Router Device1 Internet (8.8.8.8) OK VLAN 1 to Internet via Router Router Container1 OK VLAN 1 Router Device1 OK VLAN 1 Container1 Container2 No connection VLAN 1 to VLAN 2 Container1 Device2 No connection VLAN 1 to VLAN 2 Container1 Router (10.0.2.3) No connection VLAN 1 to VLAN 2 Device1 Container2 No connection VLAN 1 to VLAN 2 Device1 Device2 No connection VLAN 1 to VLAN 2 Device1 Router (10.0.2.3) No connection VLAN 1 to VLAN 2 Container2 Device2 OK VLAN 2 Device2 Container2 OK VLAN 2 Container2 Router (10.0.2.3) OK VLAN 2 Device2 Router (10.0.2.3) OK VLAN 2 Container2 Internet (8.8.8.8) OK VLAN 2 to Internet via Router Device2 Internet (8.8.8.8) OK VLAN 2 to Internet via Router Router Container2 OK VLAN 2 Router Device2 OK VLAN 2 Container2 Container1 No connection VLAN 2 to VLAN 1 Container2 Device1 No connection VLAN 2 to VLAN 1 Container2 Router (10.0.1.3) No connection VLAN 2 to VLAN 1 Device2 Container1 No connection VLAN 2 to VLAN 1 Device2 Device1 No connection VLAN 2 to VLAN 1 Device2 Router (10.0.1.3) No connection VLAN 2 to VLAN 1
As you can see from the table above, the Router container is able to send traffic to both networks so it’s a perfect candidate to serve common messages, like GPS broadcast.
If you need more granular routing or firewall rules, we propose to use firewalld instead of iptables . This way, you can disable non-encrypted traffic or open specific ports only.
Nevertheless, the job is not over yet. In the next article , we’ll cover IP addresses assignment problem, and run some more sophisticated tests over the infrastructure.