8 Tips for an Agile Debugging of a Web Application


Building a complex web application, you’ve probably encountered the fact that something didn’t work as planned. You’ve spent hours and hours looking for a bug in your code and then on the internet searching for help with fixing the problem. To make it easier for you, in this article we explain some effective techniques of debugging a web application that significantly reduce the pain of debugging and shorten the time of detecting issues.
Console.log
First, a commonly used javascript method console.log. You can insert a method in your code with the given variable. During code execution, the application will return the value of the variables specified inside the method in the console. This is the easiest way to check if the program returns the expected value.
Unfortunately, this is not a very effective method of debugging. Such an approach t does not allow us to see the progress of code execution (unless we insert console.log every few lines, but then the amount of data thrown in the console will be unreadable and we will only make a mess in the code.) Furthermore, it returns only the passed variable, provided that the application does not throw an error while executing the code.
Tip no. 1
If you have many console.logs put the name in a string and the next variable, e.g., console.log(‘variable’, variable).
Chrome DevTools (Source Tab)
A more efficient method for debugging a web application is to use Chrome DevTools and Source Tab. Before we start debugging in the source tab, we need to add node_modules to black boxing. We add this rule so that when going through breakpoints it does not show us files from external packages, which makes debugging difficult. We need to open settings in Chrome → Blackboxing → Add patterns and then write there /node_modules.

When you add node_modules to black boxing we can go to the Source Tab. Let’s assume you want to follow in real time the process of your function, and check the outputs. Press Ctrl + O in the source tab, and enter a source file name. Then put the breakpoints on the lines of code that interest, you and you can start executing the process in your browser. When the lines you selected start processing, the browser will stop executing the code. See the screenshot below.
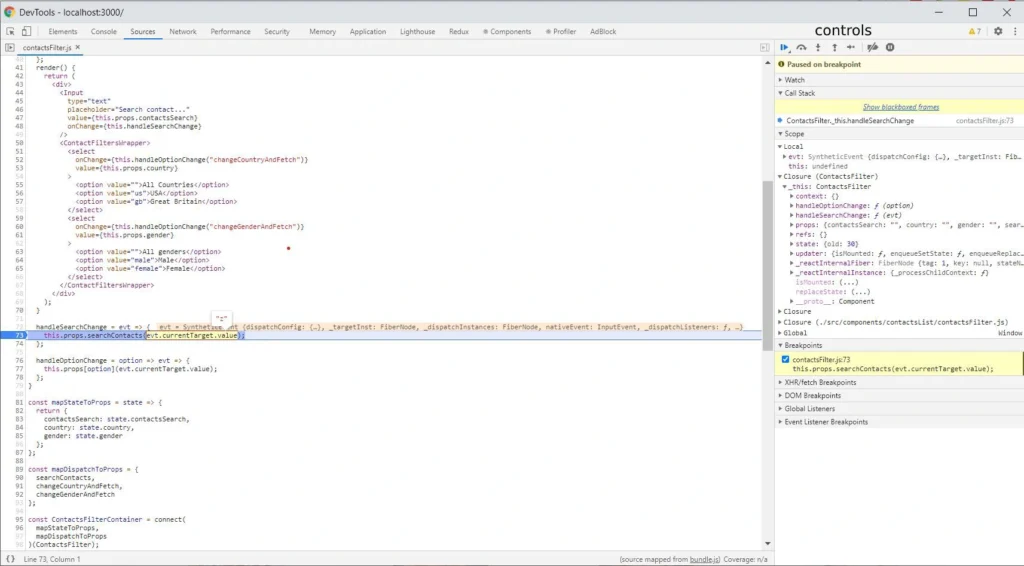
As you can see, the current line of code where the browser has stopped has a blue background. On the right side, there is a bar where our command center is located. Here is our brief introduction.
Controls
At the top of the bar, you have the controls section. Let’s focus on the crucial elements. The first Resume control takes us to the next marked breakpoint within the scope of the code being executed. The second control Step over next function call takes us to the next line of the code being executed. The last Deactive breakpoints control deactivates the selected breakpoints. It’s a useful control when we have many breakpoints selected, and we want to go back to clicking through the application for a while without pausing at every breakpoint.
Scopes
We have a scopes section below. We have several types of scopes: local (the currently performed function), and closures depending on the scope in which we are (for example, the parent of the currently performed function or a component). In each of these scopes, the browser shows us all variables occurring in them.
Breakpoints
The last section discussed is breakpoints. It shows what breakpoints and in what files are marked. Using checkboxes, we can easily deactivate and reactivate them.
Tips no. 2-5
- If you use immutable.js in your project, install the Immutable.js Object Formatter plugin and activate it in browser settings. This will significantly simplify the debugging of immutable objects.
- If you do not use immutable.js in your project and you use Visual Studio Code as IDE, We strongly recommend installing and configuring Debugger for Chrome (VSC does not have an immutable.js formatting plugin). It simplifies debugging even further and allows for faster code changes.
- If the source tab doesn’t show your local files check the source map in your project.
- When the browser stops on a breakpoint you have access to variables also in the console.
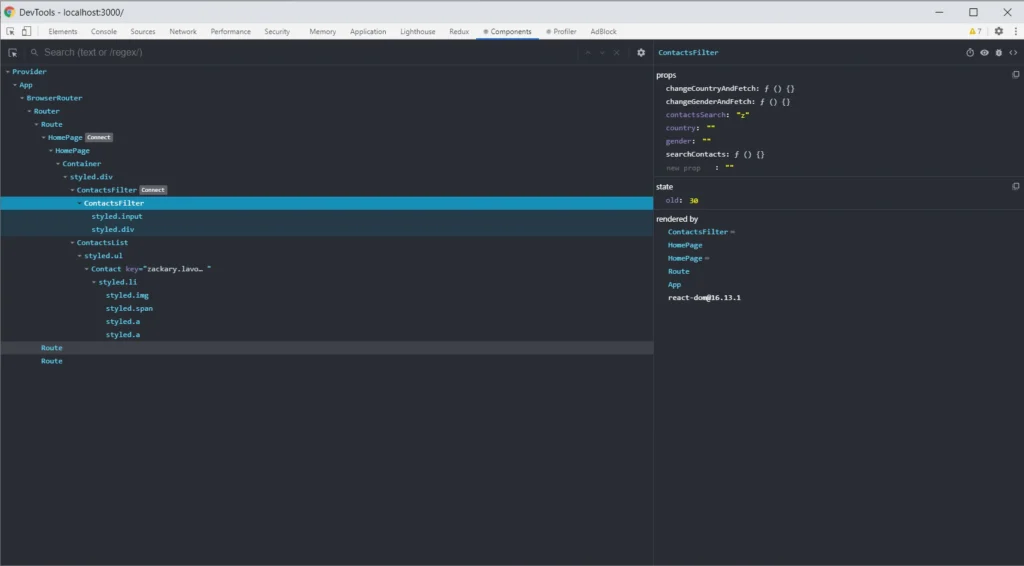
React Developer Tools
React Developer Tools are also helpful solutions. Such tools allow you to easily view the React tree structure in your project, the states, and props in the component. The Select an element in the page to inspect it function is powerful, especially when you don’t know the whole project. It helps you find the component you need to update.
Tip no. 6
If you use Vue.js, you can use Vue.js devtools. The extension has similar functions and access to Vuex (the redux equivalent in react).
Redux DevTools
If you use Redux in your project, Redux DevTools is a must-have. Such a solution allows you to track the full flow of actions, status changes, payload, and view the current store after each action performed. If something does not work as we assume, and everything seems fine in the code, it is worth considering what actions are dispatching, with what payload. Sometimes there are simple mistakes like copying the constant from the above action, renaming without changing the value, and then calling something completely different. Below is a gif showing the most important Redux DevTools functions.
Tip no. 7
If your application runs a large number of actions, the extension may not function properly due to insufficient memory to process that many actions. You can try to configure it in the extension options (in this case, the maxAge option.)
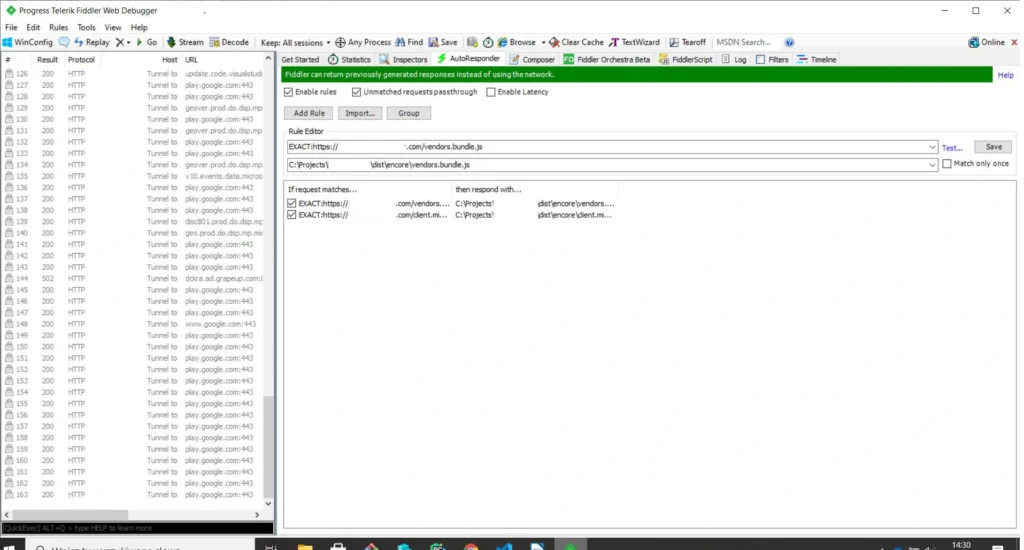
Fiddler
The last tool we would like to introduce is Fiddler. The tool was created to manage network traffic. It is extremely useful when we have some production bugs and we cannot copy the production data to a lower environment to debug locally. In such a situation, to have access to production data in the local environment, we set the traffic in the AutoResponder tab. When you open the page, instead of downloading the js file from the server, Fidler connects our locally built production file. Further debugging is done in the chrome dev tools source tab. Below is a screenshot with the setting to redirect traffic to the local file. The program also allows for mock endpoints.
Tip no. 8
If you want to create mocks of endpoints in an easy and fast way, you can use a mock moon program.
Summary of an agile debugging of a web application
For many of us, the process of debugging a web application is associated with a headache and long hours spent in front of the computer. However, this process can be shortened and made more pleasant if you have the right tools and know-how to use them. Often they are at your fingertips and for free. We shared with you the most important and useful tools that we use daily.
Is it insightful?
Share the article!
Check related articles
Read our blog and stay informed about the industry's latest trends and solutions.
see all articles