Common Kubernetes Failures at Scale


Currently, Vanilla Kubernetes supports 5000 nodes in a single cluster. It does not mean that we can just deploy 5000 workers without consequences – some problems and edge scenarios happen only in the larger clusters. In this article, we analyze the common Kubernetes failures at scale, the issues we can encounter if we reach a certain cluster size or high load – network or compute.
Incorrect size
When the compute power requirements grow, the cluster grows in size to house the new containers. Of course, as experienced cluster operators, while adding new workers, we also increase master nodes count. Everything works well until the Kubernetes cluster size expanded slightly over 1000-1500 nodes – and now everything fails. Kubectl does not work anymore, we can’t make any new changes – what has happened?
Let’s start with what is a change for Kubernetes and what actually happens when an event occurs. Kubectl contacts the kube-apiserver through API port and requests a change. Then the change is saved in a database and used by other APIs like kube-controller-manager or kube-scheduler. This gives us two quick leads – either there is a communication problem or the database does not work.
Let’s quickly check the connection to the API with curl (curl https://[KUBERNETES_MASTE_HOST]/api/) – it works. Well, that was too easy.
Now, let’s check the apiserver logs if there is something strange or alarming. And there is! We have an interesting error message in logs:
| etcdserver: mvcc: database space exceeded |
Let’s connect to ETCD and see what is the database size now:
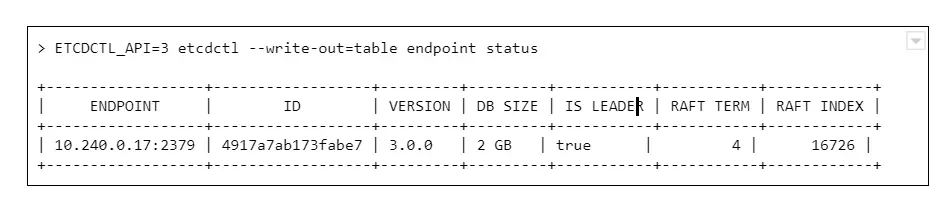
And we see a round number 2GB or 4GB of database size. Why is that a problem? The disks on masters have plenty of free space.
The thing is, it is not caused by resources starvation. The maximum DB size is just a configuration value, namely quota-backend-bytes. The configuration for this was added in 1.12, but it is possible (and for large clusters highly advised) to just use separate etcd cluster to avoid slowdowns. It can be configured by environment variable:
ETCD_QUOTA_BACKEND_BYTES
Etcd itself is a very fragile solution if you think of it for the production environment. Upgrades, rollback procedure, restoring backups – those are things to be carefully considered and verified because not so many people think about it. Also, it requires A LOT of IOPS bandwidth, so optimally, it should be run on fast SSDs.
What are ndots?
Here occurs one of the most common issues which comes to mind when we think about the Kubernetes cluster failing at scale. This is the first issue faced by our team while starting with managing Kubernetes clusters, and it seems to occur after all those years to the new clusters.
Let’s start with defining ndots. And this is not something specific to Kubernetes this time. In fact, it is just a rarely used /etc/resolv.conf configuration parameter, which by default is set to 1.
Let’s start with the structure of this file, there are only a few options available there:
- nameserver – list of addresses of the DNS server used to resolve the addresses (in the order listed in a file). One address per keyword.
- domain – local domain name.
- sortlist – sort order of addresses returned by gethostbyname().
- options:
- ndots – maximum number of dots which must appear in hostname given for resolution before initial absolute query should happen. Ndots = 1 means if there is any dot in the name the first try will be absolute name try.
- debug, timeout, attempts… – let’s leave other ones for now
- search – list of domains used for the resolution if the query has less than configure in ndots dots.
So the ndots is a name of configuration parameter which, if set to value bigger than 1, generates more requests using the list specified in the search parameter. This is still quite cryptic, so let’s look at the example `/etc/resolve.conf` in Kubernetes pod:
| nameserver 10.11.12.13 search kube-system.svc.cluster.local svc.cluster.local cluster.local options ndots:5 |
With this configuration in place, if we try to resolve address test-app with this configuration, it generates 4 requests:
- test-app.kube-system.svc.cluster.local
- test-app.svc.cluster.local
- test-app.cluster.local
- test-app
If the test-app exists in the namespace, the first one will be successful. If it does not exist at all, it 4th will get out to real DNS.
How can Kubernetes, or actually CoreDNS, know if www.google.com is not inside the cluster and should not go this path?
It does not. It has 2 dots, the ndots = 5, so it will generate:
- www.google.com.kube-system.svc.cluster.local
- www.google.com.svc.cluster.local
- www.google.com.cluster.local
- www.google.com
If we look again in the docs there is a warning next to “search” option, which is easy to miss at first:
Note that this process may be slow and will generate a lot of network traffic if the servers for the listed domains are not local and that queries will time out if no server is available for one of the domains.
Not a big deal then? Not if the cluster is small, but imagine each DNS resolves request between apps in the cluster being sent 4 times for thousands of apps, running simultaneously, and one or two CoreDNS instances.
Two things can go wrong there – either the DNS can saturate the bandwidth and greatly reduce apps accessibility, or the number of requests sent to the resolver can just kill it – the key factor here will be CPU or memory.
What can be done to prevent that?
There are multiple solutions:
1. Use only fully qualified domain names (FQDN). The domain name ending with a dot is called fully qualified and is not affected by search and ndots settings. This might not be easy to change and requires well-built applications, so changing the address does not require a rebuild.
2. Change ndots in the dnsConfig parameter of the pod manifest:
| dnsConfig: options: – name: ndots value: “1” |
This means the short domain names for pods do not work anymore, but we reduce the traffic. Also can be done for deployments which reach a lot of internet addresses, but not require local connections.
3. Limit the impact. If we deploy kube-dns (CordeDNS) on all nodes as DaemonSet with a fairly big resources pool there will be no outside traffic. This helps a lot with the bandwidth problem but still might need a deeper look into the deployed network overlay to make sure it is enough to solve all problems.
ARP cache
This is one of the nastiest failures, which can result in the full cluster outage when we scale up – even if the cluster is scaled up automatically. It is ARP cache exhaustion and (again) this is something that can be configured in underlying linux.
There are 3 config parameters associated with the number of entries in the ARP table:
- gc_thresh1 – minimal number of entries kept in ARP cache.
- gc_thresh2 – soft max number of entries in ARP cache (default 512).
- gc_thresh3 – hard max number of entries in ARP cache (default 1024).
If the gc_thresh3 limit is exceeded, the next requests result with a neighbor table overflow error in syslog.
This one is easy to fix, just increase the limits until the error goes away, for example in /etc/sysctl.conf file (check the manual for you OS version to make sure what is the exact name of the option):
| net.ipv4.neigh.default.gc_thresh1 = 256 net.ipv4.neigh.default.gc_thresh2 = 1024 net.ipv4.neigh.default.gc_thresh3 = 2048 |
So it’s fixed, by why did it happen in the first place? Each pod in Kubernetes has it’s own IP address (which is at least one ARP entry). Each node takes at least two entries. This means it is really easy for a bigger cluster to exhaust the default limit.
Pulling everything at once
When the operator decides to use a smaller amount of very big workers, for example, to speed up the communication between containers, there is a certain risk involved. There is always a point of time when we have to restart a node – either it is an upgrade or maintenance. Or we don’t restart it, but add a new one with a long queue of containers to be deployed.
In certain cases, especially when there are a lot of containers or just a few very big ones, we might have to download a few dozens of gigabytes, for example, 100GB. There are a lot of moving pieces that affect this scenario – container registry location, size of containers, or several containers which results in a lot of data to be transmitted – but one result: the image pull fails. And the reason is, again, the configuration.
There are two configuration parameters that lead to Kubernetes cluster failures at scale:
- serialize-image-pulls – download the images one by one, without parallelization.
- image-pull-progress-deadline – if images cannot be pulled before the deadline triggers it is canceled.
It might be also required to verify docker configuration on nodes if there is no limit set for parallel pulls. This should fix the issue.
Kubernetes failures at scale – sum up
This is by no means a list of all possible issues which can happen. From our experience, those are the common ones, but as the Kubernetes and software evolve, this can change very quickly. It is highly recommended to learn about Kubernetes cluster failures that happened to others, like Kubernetes failures stories and lessons learned to avoid repeating mistakes that had happened before. And remember to backup your cluster, or even better make sure you have the immutable infrastructure for everything that runs in the cluster and the cluster itself, so only data requires a backup.
Is it insightful?
Share the article!
Check related articles
Read our blog and stay informed about the industry's latest trends and solutions.
see all articles